
Abstract
Objectives:
This study aimed to explore the relationship between multidimensional factors, such as environment, health status, behavior, social support, and the well-being of middle-aged and older adults.
Methods:
This study utilized data from 2 waves of the nationally representative Taiwan Longitudinal Study on Aging Survey Report (TLSA) conducted in 2015 and 2019. The TLSA assesses socioeconomic status, physical and health status, the 5-item World Health Organization Well-Being Index (WHO-5 index), and social support. Data regarding the degree of digital development were obtained from the 2020 Township Digital Development Report. We applied a generalized estimating equation (GEE) to analyze the influencing factors.
Results:
This study included 4796 participants. Residing in areas with a higher degree of digital development, having a higher socioeconomic status, and experiencing better physical and mental health were significantly associated with well-being. Furthermore, emotional and attentive support mediated the association between physical and mental status and well-being.
Conclusion:
People’s awareness of searching for and receiving social support and medical resources is important for enhancing their well-being. It is also crucial to pay attention to the living environment and maintain one’s health status to promote well-being.
Introduction
According to the 2023 World Happiness Report, based on the Gallup World Poll, the subjective well-being scores are as follows: 6.6 in Taiwan, 6.7 in the United States, 6.7 in the United Kingdom, 6.2 in Japan, 7.7 in Finland (highest), and 1.3 in Afghanistan (lowest). 1 The low levels of well-being are closely linked with common mental disorders such as depression, anxiety, and stress-related disorders, contributing to the burden on mental health and the economy. 2 The pathway between the disruption of well-being activities and depressive symptoms with the mediators of social connectedness and rumination has been proposed. 3 The rapid pace of social change, increased economic activity, expanded infrastructure, and a growing older population have influenced population well-being.4,5 Economic prosperity and urbanization pose environmental threats, such as air pollution, and are associated with health risks, including high rates of obesity, hypertension, type 2 diabetes, and cardiovascular diseases, due to lifestyle and dietary habits. 4 The combination of aging and health risks leads to a decrease in subjective well-being, as reported in a nationwide cohort study of U.S. adults aged 50 years and older. 6 Previous studies have extensively explored the influence of economic support, social support, health status, and work satisfaction on the well-being using various scales. One commonly used scale is the 5-item World Health Organization Well-Being Index (WHO-5), which has clinical validity and serves as an adequate screening tool for depression. 7 Previous studies have shown that low income, the absence of a partner, and social dysfunction are risk factors for unhappiness.8,9 Living in an urban area, being more physically active, and in better health are significantly associated with better well-being.10,11 Furthermore, a higher density of neighborhood health and financial facilities and social cohesion were associated with subjective well-being, as reported in a community-based study conducted through a questionnaire survey in Dongguan City, China. 12 The effect of social desirability on total subjective well-being was significantly positive among cognitively healthy community-dwelling older people recruited from Sardinia, Italy. 13 In addition, several studies have included workers and retirees separately to explore satisfaction.14,15 Individuals without jobs tend to have higher well-being than those who are dissatisfied with their work. Retirement can result in positive changes in well-being. Few studies have simultaneously explored the relationship between satisfaction and work/retirement status. In addition, a face-to-face survey conducted in Yulin County, Taiwan, where agriculture is the main industry, showed that social connections, economic support, and technology acceptance had significant positive predictive effects on the subjective well-being of the older individuals. 16 However, no nationally representative study of older adults in Taiwan has explored the association between multidimensional factors and well-being, particularly in terms of follow-up duration. We explored the association between the development of residential areas, social support, work or retirement status, physical and mental status, and well-being through a nationally representative longitudinal survey of middle-aged and older adults.
Methods
Ethics
This study was approved by the Institutional Review Board of Biomedical Science Research, Academia Sinica (AS-IRB-BM-22053). Individually identified data were removed and anonymized throughout the study. This study was performed in accordance with the Declaration of Helsinki and followed an approved protocol.
Data Source and Study Population
We applied secondary data of both 2015 and 2019 Taiwan Longitudinal Study on Aging Survey Report (TLSA) from Health and Welfare Data Science Center, Ministry of Health and Welfare, Taiwan (https://www.hpa.gov.tw/Pages/List.aspx?nodeid=108), and the data had to be analyzed in person at the Health and Welfare Data Science Center, Ministry of Health and Welfare, Taiwan. The TLSA is a nationally representative survey conducted every 3 to 4 years using a stratified 3-stage systematic random sampling method, with a completion rate exceeding 80% in each wave. Trained interviewers investigated the demographic characteristics, household structure, physical and mental status, medical care utilization, social support and welfare exchange, and economic status. The sample sizes for included participants aged 50 years and above in the 2015 and 2019 waves were 5304 and 4101, respectively (Figure 1). After excluding questionnaires answered by the proxy or both the respondents and proxies, the study included 8767 person-times. After removing missing values, we included 8059 person-times. A total of 3263 participants participated in both the 2015 and 2019 surveys; 1204 participants attended only the 2015 survey, and 329 participants only participated in the 2019 survey. If the participants had more than 1 record, we considered the earliest data as the baseline.
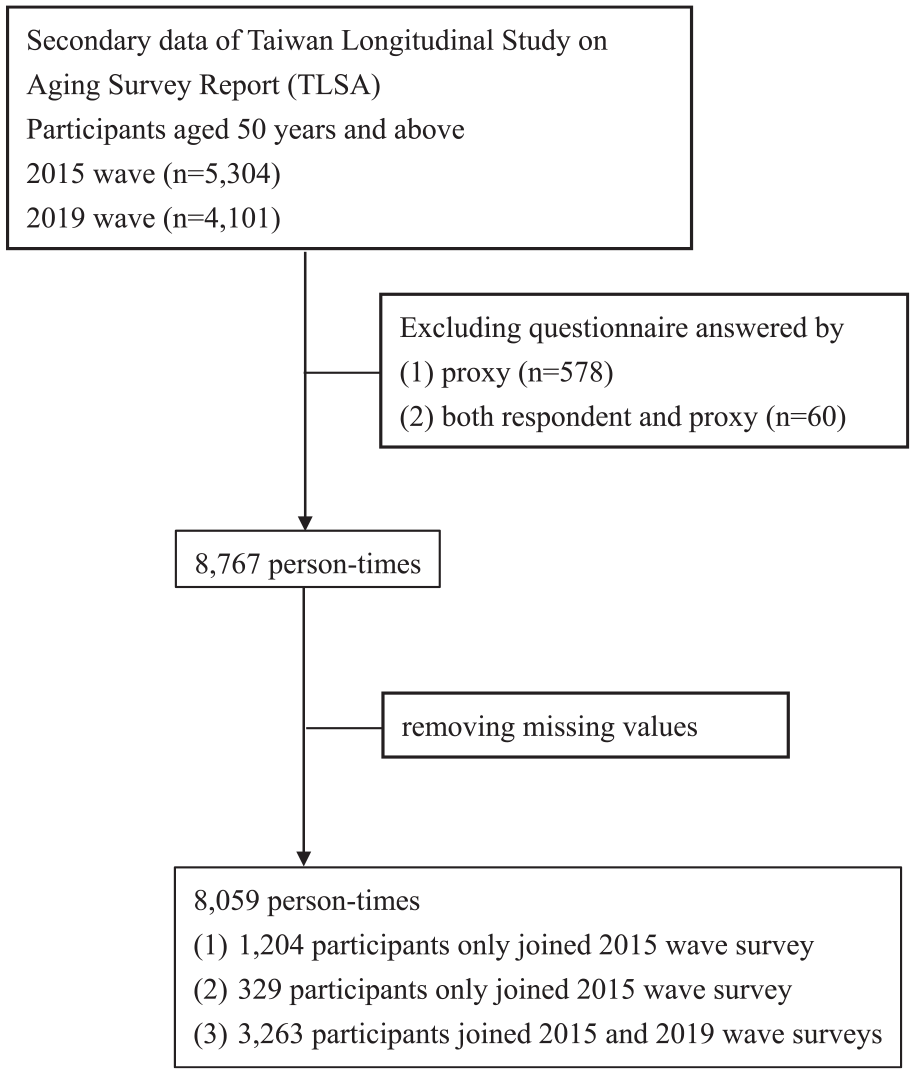
Flowchart of selection process of study subjects.
To quantify the effect of urbanization on well-being, we used the 2020 Township Digital Development Report from the National Development Council’s open-source website (https://www.ndc.gov.tw/). This report classified 368 townships into 4 clusters based on their degree of digital development, which includes the structure of human resources, information application, education and culture, environment and information infrastructure, and social economy. These 4 clusters were ranked as very high (mature), high, medium, or low (starting) in the report.
Explanatory Factors
TLSA investigates marital status, socioeconomic level, economic satisfaction, work, retirement, social activity, house type, house ownership, number of child, number of people living together, living with child, satisfaction with cohabitant living together, health behavior such as number of days eating vegetable in a week, number of days eating fruit in a week, smoking, drinking, chewing betel nut, and exercise, health status, vision, hearing, comorbidity such as hypertension, diabetes, heart disease, stroke, cancer, kidney disease, hyperlipidemia, mental illness, dementia, and Parkinson, daily activity scale (DAS), Instrumental Activities of Daily Living scale (IADL), Activities of Daily Living (ADL), social support, WHO-5 index, loneliness scale, Center for Epidemiological Studies Depression Scale (CES-D Scale), and mental health and life satisfaction.
Socioeconomic levels were self-reported on a scale from 1 (worst) to 10 (highest), where values 1 to 4 were classified as low, 5 to 7 as medium, and 8 to 10 as high. The “working history” variable combined work and retirement conditions and was classified into 4 categories: work and retirement, work and no retirement, no work and retirement, and no work and no retirement.
We conducted a principal component analysis to extract the factors using 11 social support-related questions (Supplemental Material File). Based on a scree plot and oblique (promax) rotation, we categorized the questions into 3 factors: emotional support, supervisory support, and attentive support. Questions with factor loadings greater than 0.5 were considered significant and classified into the factor. The value of each factor was calculated by multiplying the score for each question by the factor loadings. We summarized the value of each factor to obtain the total well-being score. Lower total social support scores indicated more support.
The DAS, comprising 10 questions, focuses on assessing the degree of difficulty that individuals encounter when performing specific actions independently. A 4-point scale was used, with 4 answer options: “not difficult” (0 point), “some difficult”, “very difficult”, and “totally impossible” (4 points). IADL includes 9 items in 8 areas, including ability to use telephone, shopping, food preparation, housekeeping, laundry, traveling via car or public transportation, medication use, and ability to handle finances. Each item ranges from 0 (not difficult) to 3 (totally impossible). The ADL comprises 6 items: bathing, dressing, eating, toileting, transferring from bed to chair, and walking indoors. The total score ranged between 18 (maximum performance) and 0 (lack of performance). Mental health and life satisfaction were evaluated using 9 items to identify the degree of stress or trouble related to health, economics, work, and marital status. The total score ranged between 18 (indicating maximum stress or trouble) and 0 (indicating lack of stress or trouble). The loneliness scale consists of 7 items with scores ranging from 0 (indicating no loneliness) to 2 (indicating loneliness). The CES-D consists of 11 items and the total score ranges from 0 (no depression) to 33 (depression).
Outcome
In the WHO-5 questionnaire, which is our response variable, individuals were asked how they felt in the past 2 weeks in terms of their mood with 5-items on a 6-point scale, ranging from 0 (at no time) to 5 (all of the time). 17 The Chinese version of the WHO-5 has been previously validated. 18 The raw score was transformed into a scale ranging from 0 (absence of well-being) to 100 (maximum well-being) by multiplying by 4. 7 Participants were classified into those with low and high well-being, based on the WHO-5 score. A WHO-5 cut-off score of ≤50 indicated low well-being, while a score of >50 indicated high well-being.
Statistical Analysis
We used the Wilcoxon rank-sum test for continuous variables and the chi-square test for categorical variables to test the differences between the low and high well-being groups at baseline. Residual analysis was conducted to examine which cells contribute significantly to the association when the chi-square test is significant. We presented adjusted residuals to show how far the expected values deviate from the observed values, and the cell or category is considered significant when its adjusted residual exceeds ±1.96. We applied a generalized estimating equation (GEE) and first-order autoregressive [AR(1)] correlation structure. We used mediation analyses to explore the mediating effect of social support on the associations between economic satisfaction, satisfaction with cohabitants living together, IADL, mental health and life satisfaction, and well-being. The time points of the variables used in the mediation analysis were identical. To quantify the magnitude of the mediation effect, the mediation proportion was computed by dividing the indirect effect by the total effect. The significance of the mediating effect was assessed using bootstrap resampling. Model validation was performed with 2000 bootstrap resampling iterations. All statistical analyses were conducted using RStudio, 19 including the geepack package 20 and mediation package, 21 and the level of significance was set at a 2-sided P-value of .05.
Results
At baseline, among the 4796 participants, those who were younger, married, had a higher socioeconomic level, were employed and not retired, lived with more people, expressed satisfaction with the economy and cohabitation, attended more social activities, lived in a house or villa, owned their house or had their spouse own it, had significantly higher well-being (Table 1).
Characteristics of Participants at Baseline in Relation to Well-being.

Abbreviation: SD, Standard deviation; CES-D Scale, Center for Epidemiological Studies Depression Scale.
However, participants who ate fewer vegetables or fruits per week tended to have lower levels of well-being. Those with lower levels of well-being were more likely to not drink, not chew or have quit betel nuts, and not engage in regular exercise. They also tended to have poor health status and physical performance (DAS, IADL, and ADL), receive less emotional and attentive support, experience depression and loneliness, and be less satisfied with their mental health and life.
Participants residing in areas with a higher degree of digital development, possessing a better health status, lacking hyperlipidemia, having a clear vision, experiencing higher economic satisfaction, belonging to a higher socioeconomic level, engaging in regular exercise, and reporting lower levels of depression and loneliness tended to have higher well-being (Table 2). Participants who had never been married tended to have lower well-being than those who were divorced or separated. Participants living in bungalows tended to have better well-being than those living in sanheyuan. Participants who currently chewed betel nuts tended to have higher well-being than those who had chewed betel nuts in the past but had quit. Participants who were retired tended to have higher well-being than those who had no work or retirement.
Parameter Estimations of the Association Between Multidimensional Factors and Well-being Using TLSA in Both the 2015 and 2019 Wave Surveys.

The table displays the results of the GEE for variables that have significance or boundary significance in relation to well-being.
P-value: *.05, **.01, and ***.001.
Abbreviation: CI, Confidence Interval; CES-D Scale, Center for Epidemiological Studies Depression Scale.
Emotional and attentive support explained 18.4% and 17.8% of the mediating effects of the association between economic satisfaction and well-being, respectively (Figure 2). Emotional and attentive support mediated the association between satisfaction with cohabitants living together and well-being, with significant percentages of 43.5% and 34.1%, respectively. Emotional, supervisory, and attentive support explained 4.8%, 1.3%, and 26.5% mediation effect of the association between IADL and well-being, respectively. Emotional support and attentive support mediated the association between mental health and life satisfaction, and well-being, with significant percentages of 13.8% and 10.7%, respectively.

Analytical framework for conducting mediation analysis of social support and well-being: (a) economic satisfaction, (b) satisfaction with cohabitant living together, (c) IADL, and (d) mental health and life satisfaction.
Discussion
Our results showed that residential area, house type, socioeconomic level, work and retirement status, physical and mental health status, health behavior, and marriage were associated with well-being. Comparing our study with those conducted in Yunlin County, Taiwan, on-site face-to-face surveys are challenging. 16 Although the outcome variable, well-being, was the same, the factors exploring their association with well-being were not comparable. They considered factors included social connectedness, economic support, and technology acceptance. However, we delved into more dimensions. In addition to social support, we explored environmental, physical, and mental statuses.
According to the World Health Organization (WHO) definition, well-being is a resource for daily life and is determined by environmental, economic, and social conditions. 22
One dimension of well-being, environmental conditions, is influenced by rehibition areas and house conditions, and plays an important role in health, employment, recreation, and social opportunities. 23 Urban areas offer more education, employment, income and consumption opportunities, public transit, healthcare, and infrastructure, which positively affect the subjective well-being of their inhabitants. 24 However, urbanization increases living costs, work pressure, pollution, and crime, all of which can decrease subjective well-being. 4 Results revealed that residential areas with a higher degree of digital development tended to have higher well-being. House type (eg, apartment, bungalow, and shared houses), house quality (eg, number of windows and amount of daylight exposure), neighborhood (eg, condition of pollution and noise), and green spaces have been reported to affect mental health and well-being. 23 People living in high-rise housing or apartment complexes, particularly women and children, were found to have poor overall mental health due to social isolation, limited social interactions, and restricted play opportunities. 23 In our results, we found that people who lived in bungalows tended to have higher well-being than those living in sanheyuan. One reason is that overcrowded households may lack privacy, have insufficient personal space, hinder social interactions, and social receptivity. 25
Objective measures of socioeconomic status include income, educational level, and occupation. 26 Participants experiencing higher economic satisfaction and belonging to a higher socioeconomic status tended to have higher well-being. People with low socioeconomic status may encounter diminished resources, uncertainty, and unpredictability, which are negatively related to psychological well-being. 26 People with a low income or those who are unemployed and experience economic stress tend to have lower life satisfaction. 8
The transition to retirement is accompanied by challenges and opportunities and influences changes in mental well-being. 15 We found that retired participants tended to have higher well-being than those who had no work or retirement. Retirement may result in positive changes in well-being due to reduced work stress and increased opportunities to engage in favored activities; however, losing the work role and work-related resources may result in negative changes in well-being. 15 A UK longitudinal study reported positive effect of retirement on leisure satisfaction. 27 Resources in the work-to-retirement transition and adaptation processes are important for psychological well-being. 28
In our findings, participants with better health status, lack of hyperlipidemia, clear vision, and regular exercise tended to have higher well-being. Physical health has been widely proven to influence psychological well-being among older adults, and subjective health is strongly associated with psychological well-being. Furthermore, physical health impairments and biomarkers (eg, hemoglobin and albumin) exhibit independent direct effects on subjective health, thereby establishing an indirect association with psychological well-being among the older adults. 29
There is a bidirectional association between physical activity and life satisfaction. It improves physical and mental health, increases self-efficacy, and promotes life satisfaction and psychological well-being. People with higher life satisfaction may engage in more physical activity.29,30
In our study, participants who chewed betel nuts tended to have higher well-being than those who had chewed betel nuts in the past but quit. Betel nuts contain several psychoactive compounds that stimulate the central and autonomic nervous system. 31 Habitual users experience euphoria, sense of well-being, increased alertness, and stamina. 31
We found that participants reporting lower levels of depression and loneliness tended to have higher well-being, similar to the findings of other studies. In a cross-sectional study, 40- to 60-year-old women with severe depression exhibited low happiness levels. 9 A Nordic study found a strong negative relationship between loneliness and mental health among adolescents. 32
The positive effects of marriage, such as its physical, emotional, social, and economic benefits lead to greater well-being and life satisfaction. In our study, participants who were never married tended to have lower well-being than those who were divorced or separated. Compared with happy marriages, being divorced, widowed, or never married has more disadvantages. However, an unfair or problematic marriage is worse than an unmarried marriage. 33
Regarding the social aspect, in our results, a positive relationship between emotional support and well-being was of boundary significance, and the relationship between supervisory support, attentive support, and well-being was not significant. A related study found that confidential support, which refers to the availability of help, is more influential on well-being than affective support, which refers to the satisfaction of emotional needs. The emotional needs of older individuals may not be decisive in their perceptions of well-being. Confidential support indirectly helps satisfy emotional needs. 34 Older individuals’ emotional needs may not be decisive in their perceptions of well-being. Because confidential support indirectly helps satisfy emotional needs. 34 However, another study reported that family support, friend support, and closer social networks were associated with greater emotional well-being. 35 Mediation analysis revealed the potential role of social support, including emotional and attentive support, in the relationships among economic satisfaction, cohabitant satisfaction, mental health and life satisfaction, IADL, and overall well-being. One aspect of social support named supervisory support also mediated 1.3% of the association between IADL and well-being. The relationship between social support and well-being has been extensively established, acknowledging that social support provides both physical and psychological benefits. 36 A study conducted among university students during the COVID-19 school closure examined the mechanisms of life satisfaction and affective well-being, with perceived social support acting as a mediator. The findings revealed significant and positive associations between life satisfaction and affective well-being. Moreover, perceived social support, as a mediator, exhibited a significant and positive relationship with both life satisfaction and affective well-being. 37 Additionally, Zhang et al 38 proposed that social support mediates the association between physical and mental health and subjective well-being in older individuals. However, the direct effect of physical health on subjective well-being (SWB) was not significant. Although physical health is not directly associated with well-being, the deterioration of physical health can sometimes lead to decreased mental health, ultimately resulting in lower well-being. This mediating effect validates the value-added spiral effect of Conservation of Resources theory. Older individuals with better physical health are more likely to engage in social activities, thereby expanding their relationships with others, enhancing their self-identification, obtaining higher social support, and perceiving greater well-being. With regard to different cultures, Uchida et al 39 pointed out that in North American cultural contexts, happiness tends to be predicted by personal achievement and self-esteem. In contrast, in East Asian cultural contexts, happiness is often defined in terms of interpersonal connectedness. Regional cultural differences should also be considered when influencing well-being.
Strengths
This study has several strengths. First, this was a nationally representative retrospective cohort study with an extremely high survey response rate. The dataset was derived from a large randomly selected sample, which contributes to its high external validity. Second, we considered various multidimensional factors associated with well-being, including socioeconomic status, living environment, health status, health behaviors, job status, and social support. Third, other than urbanization based on population density and housing unit density, the digital development we used was classified by human resource structure, information application, education and culture, environment and information infrastructure, and social economy.
Limitations
First, a potential reporting bias existed, as all data were self-reported and not objectively measured. However, we excluded proxy respondents to increase survey accuracy. Second, subjective well-being is influenced by multidimensional factors such as socioeconomic status, personality, social support, health and physical functioning, religion, and culture, as well as geography and infrastructure. Unfortunately, due to data unavailability, potential confounders were not considered in our analysis. Third, the participants were investigated repeatedly every 3 to 4 years. However, in our study, a few participants were only included once. Therefore, the short-term factors that may influence well-being were not controlled owing to the 4-year survey interval.
Conclusion
This study emphasizes the importance of raising awareness about physical and mental health and actively seeking social resources to promote well-being, especially among the older population. Additionally, enhancing the accessibility of social support and improving the environment are beneficial for increasing well-being.
Supplemental Material
sj-docx-1-jpc-10.1177_21501319241272023 – Supplemental material for Association of Well-Being in Middle-Aged and Older Adults With Enhanced Personal Health and Social Support: A Nationally Representative Cohort Study
Supplemental material, sj-docx-1-jpc-10.1177_21501319241272023 for Association of Well-Being in Middle-Aged and Older Adults With Enhanced Personal Health and Social Support: A Nationally Representative Cohort Study by Ping-Chen Chung, Yen-Sheng Chiang, Yi-Chien Liu, Yi-Fang Chuang, Hsiao-Han Hsu and Ta-Chien Chan in Journal of Primary Care & Community Health
Footnotes
Author’s Note
Yi-Chien Liu is also affiliated to Fu Jen University School of Medicine, Taipei, Taiwan. Yi-Fang Chuang is also affiliated to Department of Psychiatry, Far Eastern Memorial Hospital, New Taipei, Taiwan.
Author Contributions
Ping-Chen Chung: Writing—original draft. Hsiao-Han Hsu: Formal analysis and Project administration. Ta-Chien Chan: Conceptualization, Data curation, Methodology, Supervision, and Writing—review & editing. Yen-Sheng Chiang: Funding acquisition and interpretation of the results. Yi-Chien Liu, Yi-Fang Chuang: Methodology and interpretation of the results.
Declaration of Conflicting Interests
The author(s) declared no potential conflicts of interest with respect to the research, authorship, and/or publication of this article.
Funding
The author(s) disclosed receipt of the following financial support for the research, authorship, and/or publication of this article: This work was supported by Academia Sinica, Taiwan (grant number AS-TP-112-H03).
Ethical Approval
This study was approved by the Institutional Review Board of Biomedical Science Research, Academia Sinica (AS-IRB-BM-22053). Individually identified data were removed and anonymized throughout the study. This study was performed in accordance with the Declaration of Helsinki and followed an approved protocol.
Consent for Publication
Not applicable.
Data Source and Study Population
We applied secondary data of both 2015 and 2019 Taiwan Longitudinal Study on Aging Survey Report (TLSA) from Health and Welfare Data Science Center, Ministry of Health and Welfare, Taiwan (![]() ), and the data had to be analyzed in person at the Health and Welfare Data Science Center, Ministry of Health and Welfare, Taiwan.
), and the data had to be analyzed in person at the Health and Welfare Data Science Center, Ministry of Health and Welfare, Taiwan.
Data Availability Statement
The data that support the findings of this study are available from Health and Welfare Data Science Center, Ministry of Health and Welfare, Taiwan (![]() ). However, restrictions apply to the availability of these data, which are under approval for the current study and thus, are not publicly available. The datasets used in this study had to be analyzed in person at the Health and Welfare Data Science Center, Ministry of Health and Welfare, Taiwan and only the aggregated data and the statistical results can be carried out after the examination process.
). However, restrictions apply to the availability of these data, which are under approval for the current study and thus, are not publicly available. The datasets used in this study had to be analyzed in person at the Health and Welfare Data Science Center, Ministry of Health and Welfare, Taiwan and only the aggregated data and the statistical results can be carried out after the examination process.
Supplemental Material
Supplemental material for this article is available online.
References
Supplementary Material
Please find the following supplemental material available below.
For Open Access articles published under a Creative Commons License, all supplemental material carries the same license as the article it is associated with.
For non-Open Access articles published, all supplemental material carries a non-exclusive license, and permission requests for re-use of supplemental material or any part of supplemental material shall be sent directly to the copyright owner as specified in the copyright notice associated with the article.