
Abstract
Introduction/Objectives:
Elevated blood lead levels can cause impaired cognition and behavioral problems in children. Screening is important for identifying children with elevated blood lead levels, but many children who qualify for screening do not get tested. We aimed to see if the addition of prompts in the electronic health record (EHR) would lead to differences in blood lead tests ordered for children with government insurance.
Methods:
In May 2018, a prompt was added to our institutional EHR that reminded primary care practitioners to recommend lead testing for patients with government insurance. For this retrospective observational pre-post comparative study, we reviewed the rate of blood lead test orders and completed collection before and after the prompt was introduced.
Results:
The number of blood lead tests ordered did not increase after prompts were introduced in the EHR; rather, the lead screening rates at 12-month well-child visits decreased from 63.6% to 53.8% (P = .008). The 24-month visit data did not change significantly for the number of lead tests ordered before and after the prompt was introduced in the EHR. The number of lead tests completed showed a significant decrease after the prompt was introduced for the 12-month visit (P < .001) but no significant change for the 24-month visit (P = .70).
Conclusions:
This study showed that the addition of prompts in the EHR was not associated with an increase in the number of blood lead level tests ordered. Further research is needed to determine factors that could affect lead screening rates.
Introduction
Elevated blood lead levels can lead to serious health consequences in children, including impaired cognition and behavioral difficulties. 1 The Advisory Committee on Childhood Lead Poisoning concluded that lead exposure has no safe level; therefore, routine lead screening and/or risk assessment are recommended for young children. 2 Screening recommendations for blood lead levels depend on community risk factors such as age of housing and prevalence of elevated blood lead concentrations. 2 In Minnesota, risk assessment is recommended for children not enrolled in government insurance who live in areas with low blood lead level prevalence and newer housing, and blood testing is recommended for any children whose risk assessment is positive. 3 For patients enrolled in government insurance, blood lead testing is required at 12 and 24 months of age regardless of risk screening results. 4 The Centers for Disease Control and Prevention estimate that approximately half a million children between the ages of 1 and 5 years have a blood lead level greater than 3.5 µg/dL, which would necessitate follow-up care. 4 In 2021, an estimated 62.3% of US children enrolled in government insurance at 2 years of age had a blood lead level checked before their second birthday. 5
Current electronic health record (EHR) systems offer an array of benefits with clinical decision support prompts for tests and needed patient screenings, which assist clinicians in ordering those tests and performing screenings without manual review. A reasonable assumption would be that screening prompts would increase the number of tests ordered, but studies analyzing this effect have shown mixed results. Differing results were found in 2 studies that analyzed point-of-care decision-support tools for laboratory screening of children with obesity. The first showed a statistically significant increase in ordering laboratory tests, 6 whereas the second showed no difference after a support tool was implemented. 7 A systematic review showed that electronic prompts generally produced only small to moderate changes in practitioner behavior. 8
A gap exists in the literature regarding the effect of lead-testing prompts in the EHR. Few studies have been published, 9 and results were equivocal. For example, an electronic reminder built into a visit note template significantly increased the number of ordered blood lead tests but did not significantly increase the test completion rate by families. 10 The objective of our study was to determine whether any significant difference in blood lead test orders and collection occurred after introduction of electronic provider prompts for patients with government insurance. Because we could access data from before and after a new EHR system was implemented, we believed our clinic environment would provide useful results.
Methods
This retrospective observational pre-post comparative study was approved by the Mayo Clinic Institutional Review Board. Only patients who authorized use of their health records for research were included in the study. We used the automated query feature of the EHR to determine whether lead test rates for pediatric patients with government insurance were different before and after a provider prompt was added that recommended a blood test for this patient group to align with preventive care recommendations. Including the prompt coincided with implementing a new institutional EHR system (EPIC, Epic Systems Corp). The exposure variable was time, and the outcome variable was blood lead testing.
No a priori sample size calculations were performed. The after-prompt period, July 1, 2018, to February 28, 2020, was designed to be as long as possible, allowing a few months after prompt implementation and ending before the COVID-19 pandemic. The before-prompt period (July 1, 2016, to February 28, 2018) was chosen to have the same duration and begin and end on the same dates within the year. Eligible visits were the 12- and 24-month well-child visits at our primary care practice at Mayo Clinic in Rochester, Minnesota for patients with government insurance. If a patient had multiple visits during the 12- or 24-month period, the closest visit was used. Only well-child visits were included in the data set, although the data included lead level results within 6 months of a visit, which were considered within the time period for a well-child visit. Lead test orders were collected from the EHR, and completion data were provided by clinical specialists skilled in using the EHR. A lead test was considered ordered or completed if it occurred within 6 months of the well-child visit. Data for race and ethnicity were collected from the EHR.
Socioeconomic status (SES) was determined by using a housing-based SES (HOUSES) index. This validated SES index uses information about a patient’s address, obtained from the county assessor’s office, to determine SES to the unit level at a specific address, including number of bedrooms in the unit at the address, number of bathrooms, square footage of the unit, and estimated value of the unit. 11 Individuals were placed in 1 of 4 quartiles, with Q1 representing the lowest quartile and Q4 the highest. The original HOUSES index data were collected from 1985 property data in Olmsted County. The data were updated through 2021 and matched with the address where the child lived at birth. This method has been shown to be comparable to other methods of estimating SES and of predicting health outcomes associated with SES.12,13
Statistical Analyses
To summarize patient characteristics, each observation was categorized as a 12-month visit before prompt, a 12-month visit after prompt, a 24-month visit before prompt, or a 24-month visit after prompt implementation. Patient characteristics were summarized with frequency and percentage. Unknown race and ethnicity values were retained as an informative “unknown” category, given that some patients do not disclose this information. Patients missing HOUSES quartiles were not included in adjusted analyses.
Graphical analysis was used to inform model selection, with time aggregated by month for visualization only. Scatterplots were generated for the percentage of each outcome for each calendar month for 12- and 24-month visits. Differences in the average proportions and trends of the outcomes at 12- and 24-month visits suggested that these visits should be plotted and modeled separately. Based on these plots, the primary analysis was conducted with interrupted time series (ITS) logistic regression with changes in both slope and intercept.14,15 A log-linear relationship between the odds of the outcomes and time was supported by the scatterplots. Additional plots by season did not support seasonality in trend. Residuals were assumed to be uncorrelated following further analysis to check for autocorrelation.
A logistic regression ITS model was fit for each of 12- and 24-month visits with the following equation:

Time was measured continuously in months from the start of the before-prompt period. The interrupt was 0 for the before-prompt period and 1 for the after-prompt period. Time since interrupt was 0 in the before-prompt period and was measured continuously in months from the start of the after-prompt period in the after-prompt period.
Logistic regression naïve to trend was included as a reference and to observe how closely the more optimal time-series model fit to the naïve model. The trend-naïve logistic regression that compared the 2 study eras was fit with the following equation for each of 12- and 24-month visits:

Era was 0 for the before-prompt period and 1 for the after-prompt period.
Potential confounding bias due to shifting patient characteristics and other influential events was considered. In addition to the models described above, adjusted models conditioning on sex, race, ethnicity, and HOUSES quartile were fit to control for confounding due to patient demographics. The after-prompt period was selected to end before the COVID-19 pandemic. No other events were considered likely to cause additional confounding and were not evaluated.
The analysis was conducted using SAS software, version 9.4 for Linux (SAS Institute Inc). Statistical significance was determined as P < .05 using a 95% confidence level.
Results
There were 1,557 total visits, with 731 visits at 12 months and 826 visits at 24 months. The adjusted analysis included 680 patients at 12-month visits and 762 patients at 24-month visits, due to missing HOUSES quartiles. There were 254 patients with visits in both the 12- and 24-month samples. Patient characteristics and outcomes are described in Table 1. In the 24-month visit groups, rates of lead test orders were 32.2% before and 31.3% after the prompt was added, whereas in the 12-month groups, the rates were 63.6% before and 53.8% after the prompts were added. The rates of lead tests collected in the 12-month group were 53.1% before and 40.2% after the prompts were added. For the 24-month group, the rates of lead tests collected were 21.6% before and 22.7% after the prompts were added. These data and data from the trend analysis suggested that the 12- and 24-month visits should be modeled independently. Lead screening rates increased for 12-month visits before the prompt was added and decreased after the prompt was added (Figure 1), a finding that was supported by ITS logistic regression estimates. The data for the 24-month visit outcomes did not suggest any trend (Figure 2).
Patient Characteristics.
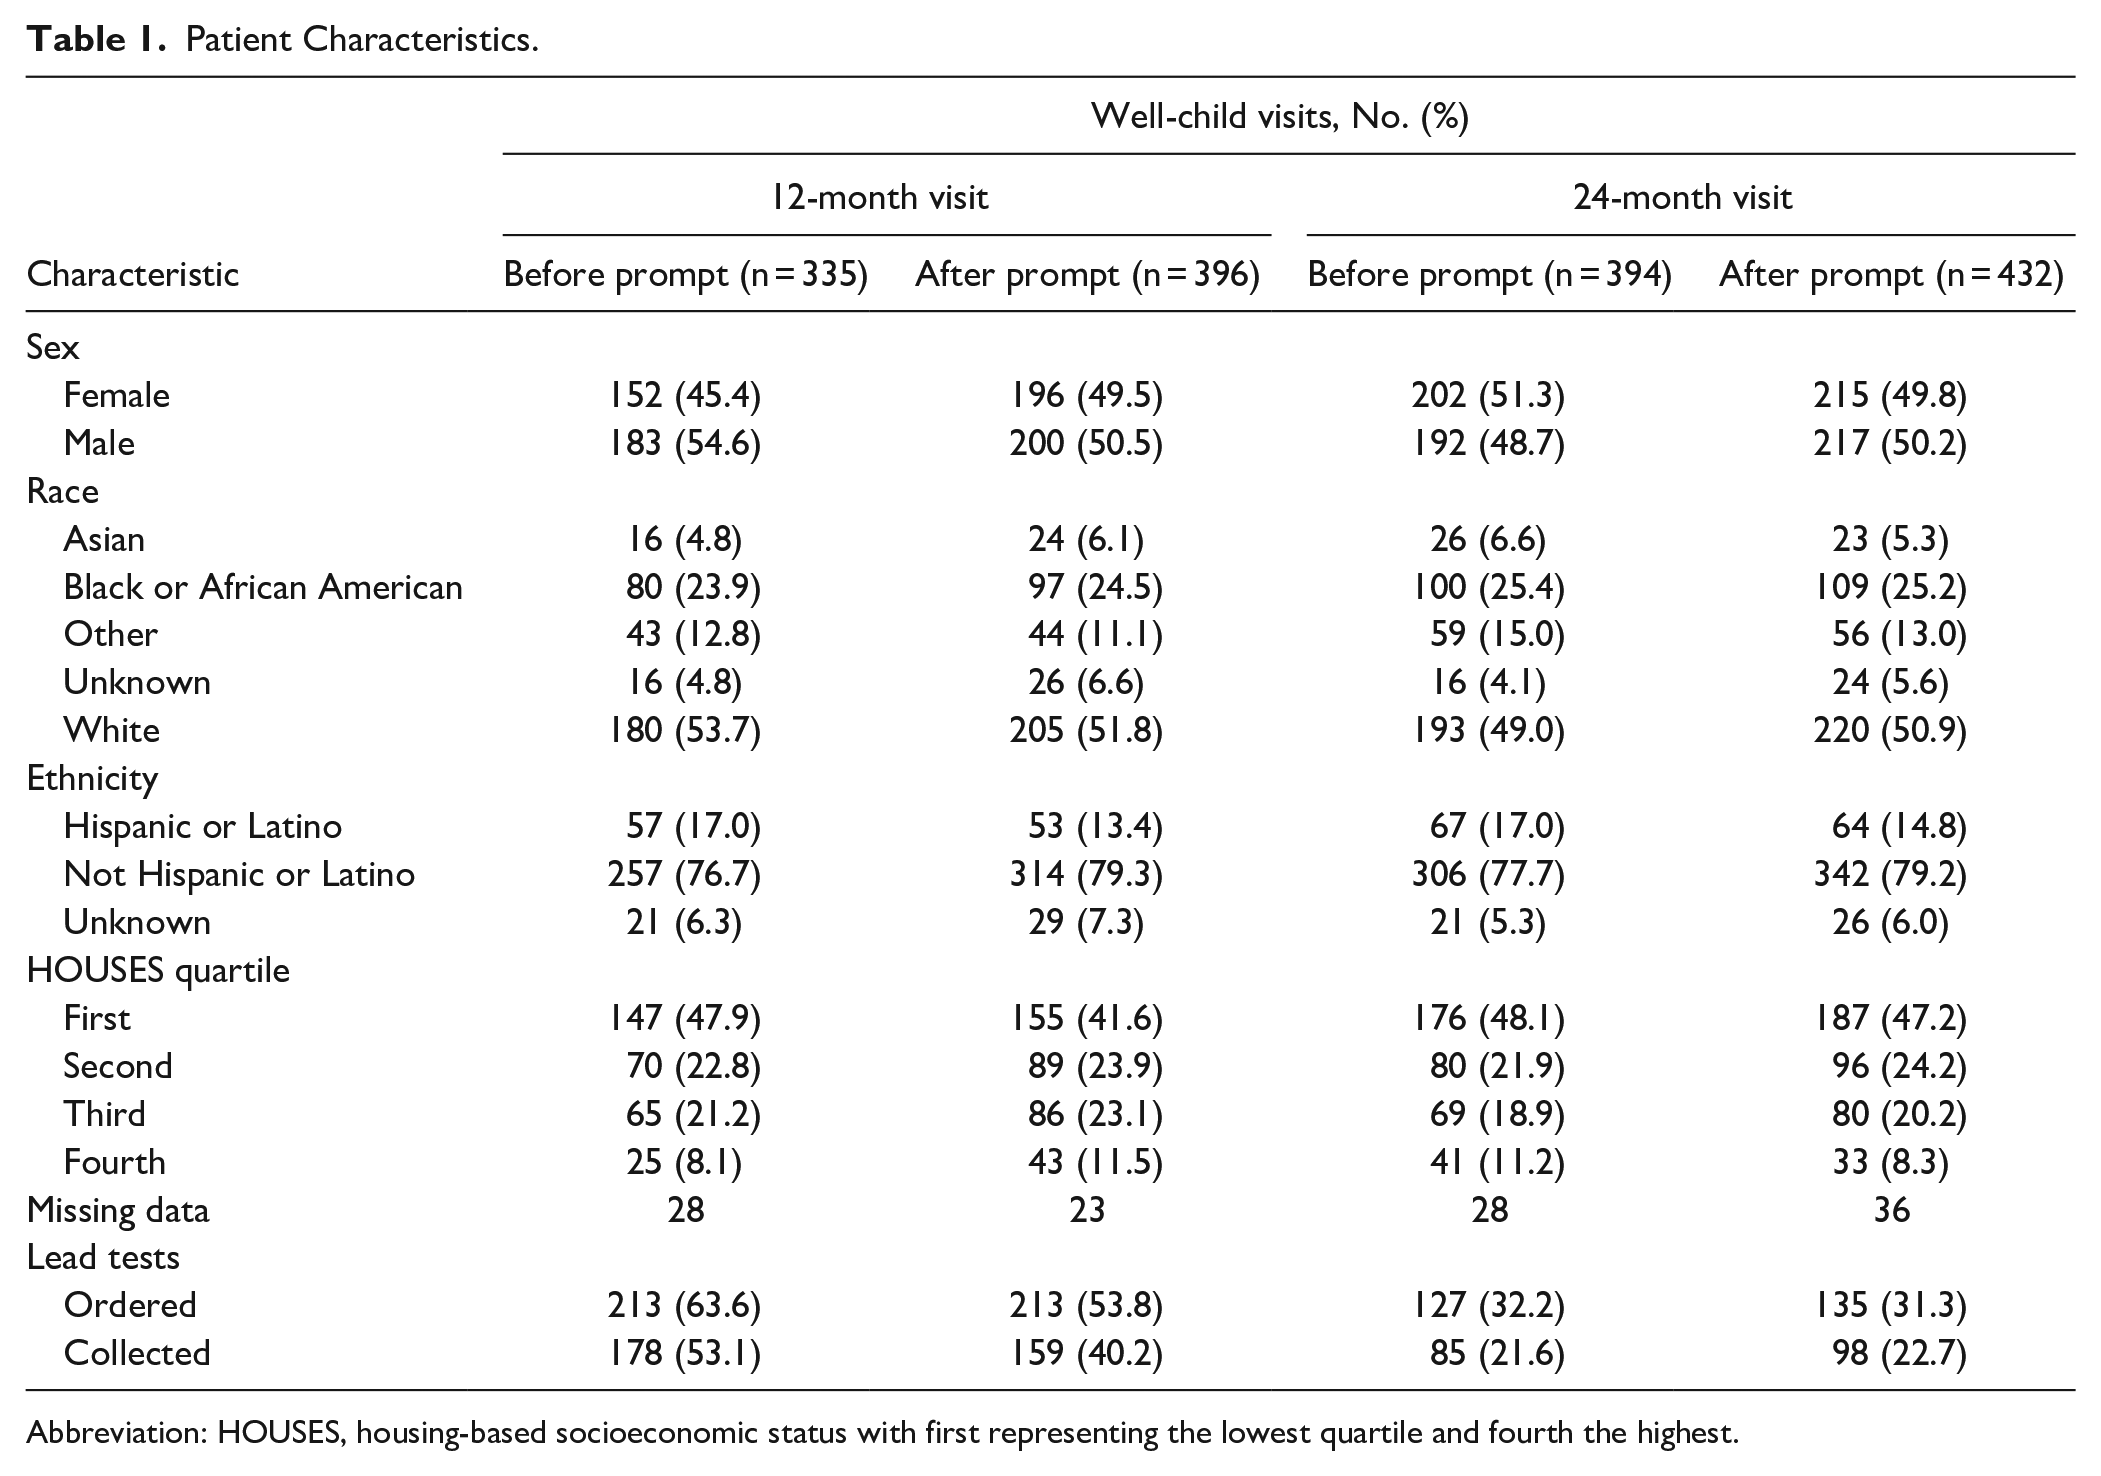
Abbreviation: HOUSES, housing-based socioeconomic status with first representing the lowest quartile and fourth the highest.

Lead tests ordered for patients at the 12-month visit.

Lead tests ordered for patients at the 24-month visit.
Results for the ITS model estimates and the trend-naïve model estimates are presented in Table 2. The results for lead tests ordered and collected were similar. The results of the adjusted regression models also closely agreed with the results of the unadjusted models. Results for the ITS supported the results for the models with the binary exposure variable for before or after the prompt was added. For 12-month visits, fewer lead tests were ordered and data collected after the prompt was added than before. The results for the ITS agreed with the graphed results from the exploratory analysis, showing an increasing rate of the outcome before and a decreasing rate of the outcome after the prompt was added. No differences were found for 24-month visits.
Interrupted Time Series and Trend Naïve Model Estimates.

Abbreviation: OR, odds ratio.
For 12-month visits, patients had 33% lower odds (odds ratio [OR], 0.67 [95% CI, 0.50-0.90]; P = .008) of having a lead test ordered after than before the prompt was added. Before the prompt, patients had 8% higher monthly odds of having a lead test ordered (OR, 1.08 [95% CI, 1.04-1.12]; P < .001). The rate of change in odds of having a lead test ordered was 10% lower (OR, 0.90 [95% CI, 0.86-0.95]; P < .001) after vs before the prompt. Patients had 41% lower odds of having a lead test collected after vs before the prompt was added (OR, 0.59 [95% CI, 0.44-0.79]; P ≤ .001).
For 24-month visits, the odds were the same for having a lead test ordered before or after the prompt (OR, 0.96 [95% CI, 0.71-1.28]; P = .76). Patients did not have different odds by month of time before the prompt (OR, 1.02 [95% CI, 0.98-1.06]; P = .34). There was no difference in the rate of change in odds after the prompt (OR, 1.00 [95% CI, 0.95-1.05]; P = .996). The odds were the same for having a lead test collected before or after the prompt (OR, 1.07 [95% CI, 0.77-1.48]; P = .70).
Discussion
Our data showed that a significant increase did not occur in the number of blood lead tests ordered after prompts were introduced into the EHR; in fact, a significant decrease occurred in the number of tests ordered for 12-month visits. For the 24-month visits, no significant changes were found in the number of lead level tests ordered. These findings may have several explanations. The numbers of tests could reflect parent or guardian attitudes toward testing rather than have anything to do with the prompts. Many parents prefer to avoid testing, particularly testing such as a blood draw that might be distressing to a child. When they believe their child to be low risk, parents may defer the test. Practitioners may also believe the child to be at low risk and defer the test after consulting with the family. For patients without government insurance, testing is recommended only if there are risk factors on risk assessment. Practitioners could have been influenced by these recommendations for patients with government insurance.
Lead test completion rates were lower than order rates. Because a test must be ordered to be collected, this outcome was expected. Our clinics are not equipped for point-of-care testing for lead, so patients must go from the clinic to the laboratory to have blood drawn, which could be a barrier for some parents. Other parents may have decided not to move forward with testing and did not schedule the laboratory appointment. Transportation or time constraints may also have kept parents from getting the recommended testing for their child.
In general, prompts in the EHR have resulted in only small to modest changes in practitioner behavior for pediatric care. 8 Our study findings are similar to findings in the current literature in that no change occurred in number of tests ordered based on introduction of a prompt. Other methods may be more successful in creating change, including linking prompts directly to order sets, having orders automatically added if a child meets certain criteria, and combining provider education and electronic prompting. These methods were shown to increase rates of screening for comorbid conditions in patients with obesity. 7 Another study showed improved adherence to Down syndrome screening guidelines by use of a best practice advisory pop-up window as well as a health maintenance tracking feature added to the EHR. 16
This study was limited in that we only included children who received care at our clinic, most of whom are White. Therefore, the results may not be generalizable. The timing of clinical-decision support prompts in the EHR for lead testing could also have influenced the results. During this study, our clinics had prompts for lead testing only for patients who came for preventive well-child visits. However, this timing is not different than our practice during the period before the EHR prompts were introduced. The effect of lead testing EHR prompts that appear for qualifying patients at any clinic visit needs to be studied further, as this could increase the number of patients compliant with lead-screening guidelines.
Conclusion
This study showed that the introduction of prompts in the EHR did not increase the number of lead level tests ordered for pediatric patients with government insurance at 12 or 24 months of age. Further areas for research could include barriers to lead testing from practitioner and parent perspectives, with the goal of finding novel ways to overcome the barriers. At the time of this study, Minnesota had targeted lead testing recommendations. Since December 2022, the Minnesota Department of Health has recommended universal lead testing at 12 and 24 months of age. 17 Future research could explore whether universal lead testing recommendations for testing at 12 and 24 months of age increases test numbers vs targeted recommendations, which could be missed by a health care team.
Footnotes
Acknowledgements
This study was made possible using the resources of the HOUSES program of the Precision Population Science Lab of the Mayo Clinic. The content of this article is solely the responsibility of the authors and does not represent the official views of the HOUSES program.
Declaration of Conflicting Interests
The author(s) declared no potential conflicts of interest with respect to the research, authorship, and/or publication of this article.
Funding
The author(s) received no financial support for the research, authorship, and/or publication of this article.