
Abstract
Introduction/Objectives:
Dysphagia is a widespread clinical condition among older adults. Although known as a risk factor for nutritional status and dehydration, dysphagia also affects meal patterns. This study aimed to determine the relationship between dysphagia and undernutrition, as well as dietary consumption patterns in older adults.
Methods:
268 older adults (144 women, 124 men) were included in the study. Mini Nutritional Assessment (MNA), dysphagia assessment (EAT-10), oral examination, and Semi-quantitative Food Frequency Questionnaire (SFFQ) were used for collecting data. Odds ratio and Chi square were used to compare independent variables in subjects with and without undernutrition as well as those who intake texture modified and non-texture modified diet.
Results:
Mean age of the undernutrition and normal nutrition groups was 68.9 ± 6.1 and 68.8 ± 6.0 years, respectively. The undernutrition group’s activities of daily living (ADL) were 19.7 ± 0.9, and the normal nutrition group was 19.8 ± 0.7. Older adults with dysphagia were 4.8 times more likely to experience undernutrition than older adults without dysphagia (95% CI = 1.75-13.13, P = .002). There was a statistically difference between the meal patterns among the dysphagic older adult group and the normal-swallowing older adults’ group at the .05 level.
Conclusions:
According to this study, dysphagia was associated with the nutritional status of older adults and dietary patterns. The study results suggested some recommendations for dental health personnel on oral care related to dietary consumption and dietary patterns in older adults.
Introduction
The number of older adults worldwide has increased significantly in the past decades. The United Nations estimates that the world’s population aged 60 and over will increase from 12% in 2014 to 21% by 2050. 1 The population survey of older adults in Thailand by the National Statistical Office reported that number and proportion of older adults in Thailand in 2014 have increased up to 14.9% compared to the previous year (2013). By 1994, the older adult population had reached to 6.8% of the total population. It is expected that by 2031, the older population proportion will increase to 28% of the whole popultion. 1 In 2020, Thailand had a total population of 66.5 million, and the number is increasing. Just 50 years ago, the Thai older persons (age 60+ years) totalled 2 million persons. By 2020, that number had increased six-fold to 12 million, reaching nearly 1 in 5 Thais (18%). 1
There is a deterioration of various systems in the body when entering old age. Along with a period of life, this changes could make problems in health, financial, and socioeconomic status of older persons. A group of degenerative diseases commonly found in older adults that caused by the deterioration of the body is called geriatric syndromes, including falls, loss of ability to walk, urinary incontinence, cognitive impairments, side effects from drug use, nutritional problems, and difficulty swallowing. 2
Nutritional problems are an important issue affecting older adults’ overall health and quality of life. There are many factors developed from aging process that found related to nutrition problems in older adults, such as physiologic, mental, emotional, economic, and social changes, as well as cultural factors.2,3 Physical changes in older adults, such as swallowing difficulty causes older adults not be able to have enough food leading to a reduced choice of foods and not getting enough nutrients as a result in a higher risk of undernutrition. 4 When illness or discomfort occurs, older adults who are undernourished often experience complications and delayed recovery. When hospitalization is required, treatment is usually longer and more expensive in undernutrition patients. 4
A study conducted in China reported that undernutrition affects the treatment of illnesses and was found to cause dependency up to 4 times longer than that of independent older adults (OR 4.46, 95% CI 2.92-6.82, P < .05). 4 From a review literature, it is reported that several factors, including mental and emotional changes, were causes of undernutrition in older persons. 5 Other study indicate that some factors including diseases and disabilities, economy, social, food consumption behavior and physiological changes from aging such as decreased sensory system oral changes due to aging and dysphagia also are causes undernutrition in older persons. 5
Dysphagia is a change in the process of swallowing and causes difficulty for older people in consuming adequate and proper food. Older adults with dysphagia have fewer options in choosing food types and tend to prefer soft foods that are easier to swallow, regardless of the number of nutrients to be obtained. 5 Several evaluation methods for dysphagia diagnosis include questionnaires, water swallowing tests, food tests, and clinical examinations. One of the self-questionnaires developed for detecting dysphagia symptoms and has been accepted as a valid screening tool is EAT-10. The EAT-10 evaluation comprises 10 statements with a range of 5 severity scores. The EAT-10 is a valid, simple, and reliable tool that can be translated into other languages.
The prevalence of undernutrition among older adults varies from area to area.6,7 Public health worker use a questionnaire such as Mini Nutritional Assessment (MNA) as a simple assessment of nutrition status. There are limited studies on undernutrition and dysphagia in Thailand as most of the studies were overseas, mainly among older adults in long-term care or older adults in dependency groups in nursing homes. Moreover, there has not been a definitive study on whether these food groups are associated with dysphagia. This study aimed to determine the relationship between dysphagia and undernutrition, as well as dietary consumption patterns and dysphagia in older adults.
Methods
Ethical Considerations
This study was approved by the Human Experimentation Committee, Faculty of Dentistry, Chiang Mai University, Thailand (No. 3/2021). Every study subjects granted their consent of study participation in signed written form.
Participants
The participants in this research were volunteer older adults aged 60 years and over who live in Bandanlanhoi district, Sukhothai province, Thailand. The sample size was calculated by estimating the population proportion formula. The proportion of older adults with undernutrition was based on former study conducted in 2012. 8 The Thai population data was obtained from the Thai Health Data Center reported in June 2020 indicating there were 6478 older adults in Bandanlanhoi district. The calculation suggested a sample size of 134 undernutrition older adults matched with 134 normal-nutrition older adults were needed to the study. A total of 268 older adults (144 women and 124 men) was recruited proportionately from each sub-district of Bandanlanhoi. The information of subjects on age, gender, height, body weight, history of illness, marriage status, living characteristics, education level, occupation, salaries, and sources of income was collected by questionnaire. The Thai mental status examination tool (TMSE) cognitive impairment screening test was used to evaluate participants’ mental status. Subjects who were eligible to participate the study must (1) agree to sign the informed consent and (2) get Thai version of Mental State Examination (TMSE) scores more than 23, 17, or 14 (maximum possible score of 30) for those who were with education level of higher than in primary school, primary school, and no education respectively. Three variables were used for matching cases and controls including age (5 years range), activities of daily living (ADL) (ADL < 12 and ADL ≥ 12), and functional occlusal pairs (<4 functional occlusal pairs and ≥4 functional occlusal pairs).
Nutritional Assessment Tool
Mini Nutrition Assessment (MNA) is a nutrition screening tool that has been accepted and used to assess the nutritional status of older adults especially when used in community. MNA has validation with a Cronbach’s alpha of .83. 9 It was reported in former study, this assessment was compassionate and be quick to identify at-risk and undernourished groups in community. 9
MNA provided a possible range of score between 0 and 30. A score of 0 to 23.5 was classified as an undernutrition group, and a score of 24 to 30 was classified as a normal nutritional group. In this study, a normal nutritional group was also measured the arm length of the older adults (Demi-span). The unit was measured in meters to calculate the Mindex (women) and Demiquet (men) values (Mindex >69.55 kg/m and Demiquet >93.98 kg/m2) 10 for separating over-nutrition from this group.
The Dysphagia Screening Tool
A 10-item eating assessment tool (EAT-10) was used to screen for oropharyngeal dysphagia. The EAT-10 consists of 10 questions with a total score of 40 points. If EAT-10 score of 3 or more was obtained, the participant was categorized as having a swallowing problem. The internal consistency of the EAT-10 was 0.96, whereas the test-retest intra-item correlation coefficient was from .72 to .91. 11 The accuracy of the EAT-10 in the Thai version was reported as high as 96.9% sensitivity and 93.4% specificity. 12
The Semi-Quantitative Food Consumption Record Form
The semi-quantitative food frequency questionnaires (SFFQ) was used to collect data of food types, frequency of consumption, and amount of food study subjects consumed. The SFFQ, has been reported of the 0.89 validity and the 0.83 reliability (P < .05). The intraclass correlation coefficient (ICC) performed on this tool showed a range from a fair level to a very good level (.544-.974). 9 All items of food subjects consumed were recorded by SFFQ. Then the recoded items were grouped according to the International Dysphagia Diet Standardization Initiative (IDDSI) to levels 0 to 7. The level 0 means thin food group. The level 7 means easy to regular food group. Texture modified diets which are IDDSI level 3 to level 6. 13
Dental and Oral Health Examination
All subjects were examined for oral condition by the dentist, where the number of teeth and functional units 14 and occlusal pairs were recorded.
Statistical Analysis
Data analysis was carried out by using the software program SPSS version 17. All the general data were analyzed using descriptive statistics. The normality of data distribution were analyzed using a Kolmogorov-Smirnov test statistics. For data with normal distribution, the differences between the 2 sample groups were examined using t-test. The differences in the 2 sample groups were analyzed with the Mann-Whitney U test statistics in data with non-parametric distributions. The Pearson chi-square test statistic was used to examine proportional data for differences in the 2 sample groups as well as the relationship between dietary consumption patterns and dysphagia. The relationship between dysphagia and undernutrition was analyzed by odds ratio.
Result
The 268 older adults in this study were divided into 2 groups by MNA and Demi-span. There were 134 older adults classified as the undernutrition group, and 134 as the normal nutrition group. The general information of participants is shown in Table 1.
General Information of the Participant (N = 268).

Mann-Whitney U test, *P < .05.
Chi-square test, *P < .05.
Relationship of Dysphagia With Undernutrition
Of the total 268 older adults, there were 26 older adults (9.7%) with dysphagia. The relationship of dysphagia and undernutrition status was analyzed by odds ratio. It was revealed that older adults with dysphagia were 4.8 times more likely to experience undernutrition than those without dysphagia (95% CI = 1.75-13.13, P = .002) (Table 2).
Relationship Between Dysphagia and Undernutrition in the Older Adults.

P < .05, Binary logistic regression.
The Relationship of Consumption Patterns to Dysphagia
In this study, older adults consumption patterns were statistically associated with dysphagia (P = .044). About 50% of participants with dysphagia were about to consume texture modified diet, compare to 30% in the normal group (30.6%) (Table 3). It was found that most of the dysphagia group ate level 6 (soft and bite-sized) (42.3%), followed by level 2 (mildly thick) (34.6%), and level 7 (easy to chew/regular) (11.5%) respectively. In comparison, the normal swallowing group consumed diet mostly in level 2 (mildly thick) (35.5%), followed by level 7 (easy to chew/regular) (30.6%), and level 6 (soft and bite-sized) (26.5%), respectively (Table 4).
Relationship Between Consumption Patterns and Dysphagia.
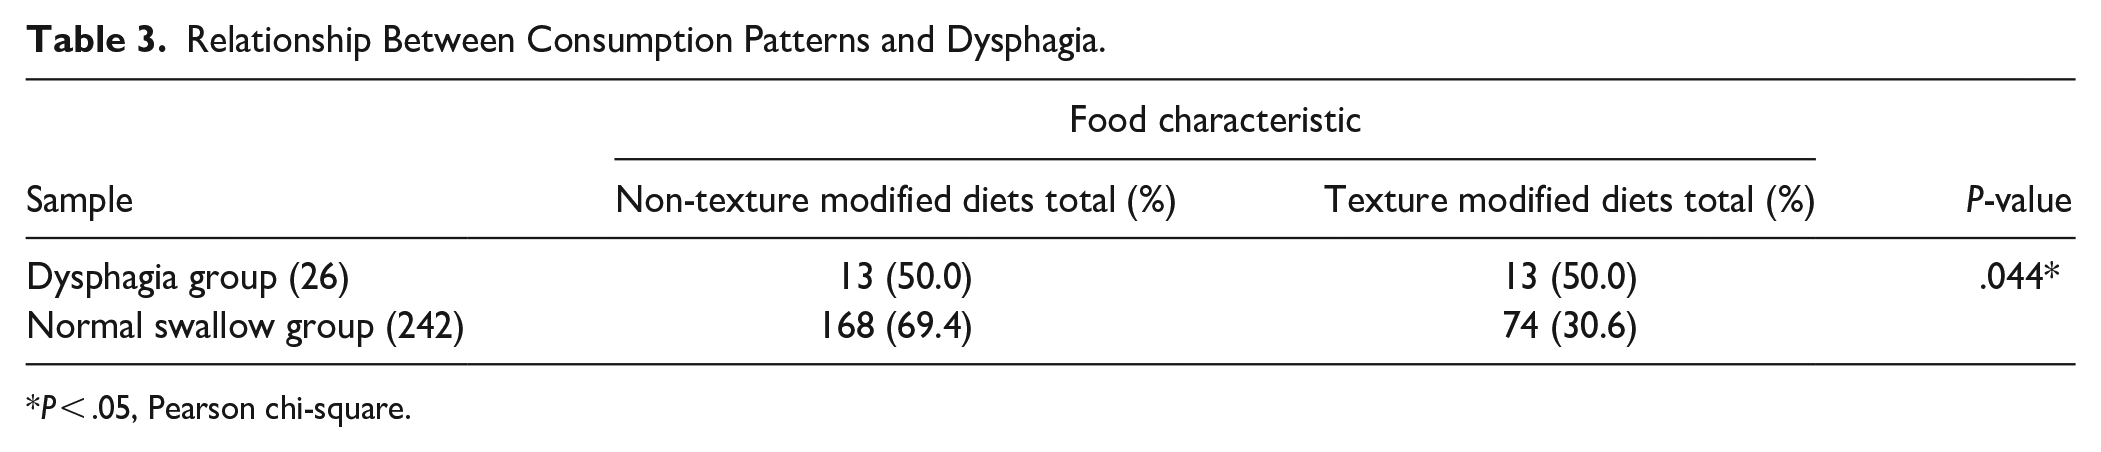
P < .05, Pearson chi-square.
Characteristics of Food Classified According to the Dietary Standards for Dysphagia Patients (IDDSI).

Discussion
In this study, dysphagia was presented at the prevalence of 9.7% among the whole participants. Another study found a prevalence of 11.4% in healthy community-dwelling older adults. 15 This study found that older adults with dysphagia were 4.8 times more likely to experience undernutrition than older adults without dysphagia. Consumption patterns among older adults were associated with dysphagia, likely due to the ability of the older adults to swallow food differently.
This study controlled 3 factors that highly contribute to undernutrition in older adults by determining the inclusion and exclusion criteria of the sample selection. The method of matching samples within age factors, activities of daily living (ADL) and functional pairs of teeth were also used, so that the effect of dysphagia on undernutrition in older adults can be appropriately studied. Other factors that may cause undernutrition in older adults included occupation, education, socioeconomic status, and living alone. These factors were associated with undernutrition in dependent older adults because it affects their ability to find and consume food properly. 16 However, in this study, these factors were not associated with undernutrition among older adults because most older adults were independent and could take care of themselves, including cooking, consuming food independently, and doing daily routines. Our finding differed from previous studies, 17 which found that the risk factors for undernutrition among hospitalized older adults were their dependency, education, and living alone status. A reason might be because of the difference in subjects’ characteristics that most of participants in this study were independent. Some studies have found that systemic disease and illness, mental and emotional state, beliefs, culture, and food security, defined as having enough food, access to food, utilization, and stabilization, can cause undernutrition in older adults.18-20 However, this study did not control or analyze these factors. Therefore, these factors may confound the association between dysphagia and undernutrition in older adults.
Older adults with dysphagia had more undernutrition than older adults without dysphagia.21-23 Moreover, there have also been reported that a lot of older adults lost their teeth partially or completely. Pattern and number of tooth loss influenced older adults’ quality of life, especially on eating function. 24 Older adults have changes in physiology of oral cavity, salivary characteristics, and a decreased sense of taste and strength of teeth. In addition, a decreased chewing force also reduces the ability to chew food, especially protein foods, resulting in undernutrition. 25 Besides the dysphagia factor, oral health factors are likely to cause undernutrition in older adults. A study found that 30% of older adults were undernourished, where the factor driving the older adults to have undernutrition was tooth loss from untreated caries that required tooth extraction. These factors were also associated with a lower quality of life. Older adults with oral health problems have an increased risk of undernutrition. 26 The prevalence of undernutrition in older adults may be as high as 90%, depending on the mouth and teeth conditions. Loss of teeth contributes to undernutrition in older adults. 27 Older adults with fewer than 19 functional permanent teeth had lower nutritional status scores than those with 20 or more permanent teeth. It shows that in addition to the dysphagia factor, improper oral health conditions may affect food choices, dietary consumption, and nutrition, leading to undernutrition in older adults. 27
This study also found that consumption patterns among older adults were associated with dysphagia due to the older adults swallowing ability of various food type. Older adults who have difficulty swallowing tend to choose soft foods, small pieces of food, or finely chopped foods, which are texture-modified diets and can be chewed or swallowed easily. Food texture-modification groups are possible to be undernutrient because soft, easy-to-chew food tends to have insufficient amount of nutrition composition.28,29 Older adults with dysphagia usually choose food suitable for their degree or severity of swallowing. Food with different viscosities was also an essential factor in the swallowing ability of older adults. A normal swallower could easily consume dense or regular food, while this ability was often impaired according to their pathology in the dysphagia group. 29 Older adults with dysphagia required food choices that allowed them to consume. Most foods are modified in texture to make them easier to eat. 29 A previous study found that older adults consumed lower amount consumption of texture-modified diet compared to regular diet, especially in energy and calcium, with statistically significant differences. 30 Texture-modified diets can reduce chewing and swallowing difficulties in older adults with reduced masticatory capacity and tooth loss, including dysphagia. Despite the increasing number of texture modification food, there are limited studies on how food texture changes affect consumption and nutrients consumption in dysphagic older adults. It is essential to monitor amount of texture-modified diet consumed by older adults in order to know nutrition level the elderly got because insufficient energy and insufficient intake of nutrient fluids from textured diets lead to a higher risk of undernutrition. 30 Textured-modified foods, especially ground food, contribute to undernutrition in dysphagic older adults, especially in long-term care, because crushed food is lower in calories, protein, and nutrients than regular food. 31 Also, older adults with soft foods like snacks between meals. 32 Consuming food between meals at high frequencies is also highly likely to cause oral diseases such as dental caries. 33 Therefore, an individual oral health care plan for older adults should be performed to prevent possible dental caries. 33
Older adults with dysphagia should be assessed and given detailed dietary advice. A study by Furuya et al 34 suggests that patients with dysphagia should be fed a diet that is sensible between the food texture and severity of their dysphagia and that the patient’s nutritional intake is adequate so that dysphagic older adults can consume appropriately for the seriousness of their dysphagia and obtain energy and nutrients. A previous study found that a bolus-like texture is essential for safe swallowing in older adults with dysphagia due to its proper texture. It helps reducing food residues around the esophagus but should be considered in its nutrient content. 29 The altering of food textures in older adults with dysphagia is challenging because modified food or textured-modified food is not preferred by most people as it is not look like food they usually consume. In some areas, it is difficult to obtain food with a modified texture due to the lack of product with proper consistency and amount of nutrients and energy. In addition, older adults with dysphagia may depend on others for food consumption, which is a risk factor for inadequate feeding. Studies suggest that smaller, more frequent meals benefit people with dysphagia. 35 Therefore, to prevent possible oral disease, a personalized oral care plan for the older adult with dysphagia should be prioritized to prevent possible dental disease. Brushing teeth or cleaning the mouth after meals and visiting the dentist regularly could help prevent oral diseases from frequent eating.
Therefore, dentists or dental hygienists should understand the context of patients entering older age and focus on their health examinations and treatments. Together, including systematic oral examination and screening for dysphagia will enable more comprehensive care for these older adults. Knowledgeable advice, choosing the right food or dietary characteristics and considering the total nutritional intake for the needs of older adults with dysphagia is essential for dental personnel and healthcare workers to pay attention to. This study’s results suggested the need to develop and promote innovative education to older adults care giver on appropriately modified food textures that have total nutritional value for older adults with difficulties of swallowing as well as the need to develop nutritional care guidelines for older adults with swallowing difficulties. The strength of this study is the matching of factors highly influence undernutrition so that the association between nutrition status and dysphagia could be demonstrated appropriately. However, this study was cross-sectional, so it could not clearly reveal the cause or effect of the disease. Study tools like MNA, EAT-10, and SFFQ primarily rely on experiences, memory, and hearing. When such tools are studied in the older population, they may produce discrepancies.
Conclusions
Dysphagia was associated with the nutritional status of older adults and dietary patterns. This study will inspire dentists or dental personnel to pay more attention on screening for dysphagia in older adults to estimate better oral health conditions, which could lead to better dietary advice.
Footnotes
Declaration of Conflicting Interests
The author(s) declared no potential conflicts of interest with respect to the research, authorship, and/or publication of this article.
Funding
The author(s) received no financial support for the research, authorship, and/or publication of this article.