
Abstract
Background:
Our study aimed to describe the variation in the frequency of correct mask use among pedestrians in the first and second waves of the COVID-19 pandemic in high-flow indoor public spaces from different geographic and social settings in Peru.
Methods:
We carried out a cross-sectional exploratory study among pedestrians in Lima (the capital city) and other coastal and highland cities in Peru. Pedestrians were directly observed by trained medical students in 2 high-flow indoor areas at different times in November 2020 (first wave) and October 2021 (second wave). Primary outcomes included the frequencies of mask use and correct use. We applied multinomial logistic models and estimated crude and adjusted relative prevalence ratios for sex, age, obesity, and location. Additionally, we used binomial generalized linear models to estimate prevalence ratios in crude and adjusted models.
Results:
We included 1996 participants. The frequency of mask use was similar in both years: 96.9% in 2020 and 95.5% in 2021. However, the frequency of correct mask use significantly decreased from 81.9% (95% CI, 79.4-84.3) in 2020 to 60.3% (95% CI, 57.2-67.3) in 2021. In 2020, we observed an increase in the probability of misuse in the cities of Lima (aRP: 1.42; P = .021) and Chiclayo (aPR: 1.62, P = .001), whereas, in 2021, we noted an increase in the probability of misuse in the cities of Lima (aRP: 1.72; P < .001) and Piura (aPR: 1.44; P < .001).
Conclusions:
The correct mask use decreased during the second wave, although no significant overall variations were observed in mask use in pedestrians between both periods. Also, we found regional differences in correct mask use in both periods.
Introduction
The coronavirus disease 2019 (COVID-19) pandemic has exerted a devastating impact on the worldwide population, especially in low-income and middle-income countries. 1 It has accounted for more than 630 million cases and 6.5 million deaths. 2 Several public health strategies have been implemented to mitigate scenarios such as travel restrictions, border measures, gathering regulations, contact tracing, and testing. 3 Nevertheless, they must be administered according to the conditions of each setting. Masks are one of those strategies mainly used in scenarios of high transmissions, such as in the Latin American (LATAM) region, 4 wherein Peru was one of the most devastated countries by the pandemic (mortality, morbidity, health system saturation, economically, and socially). 5 Peru has a segmented, fragmented, and inequitable Healthcare System, also the country is featured by abrupt changes in politicians and, in turn, inconsistent public policies.6,7 Masks are beneficial in poorly ventilated places and will continue to be needed despite improvements in vaccination coverage that constitutes the most cost-effective strategy for disease control. 7 Herein lies the relevance of ensuring excellent adherence to health policies, which is a key to any strategy.
Mask use is one of the most efficient strategies to control the transmission of infectious respiratory diseases, particularly COVID-19. However, several studies showed that it is not a universal practice.8-11 Systematic reviews showed that mask use decreased the incidence of COVID-19 in the general population and healthcare staff.12-14 Although there are masks from different materials, there is no evidence that suggests the superiority of a specific type of mask in the general population.15,16 However, masks should be used correctly to be effective; that is, they should cover an individual’s nose and mouth. 17 Despite their effectiveness in decreasing viral transmission, some studies also suggest that correct mask use decreased as the pandemic evolved. 18 Yet the variation in the frequency of correct mask use may be affected by climatological, social, and economic conditions. The decrease in adherence should be a public health concern given that, although COVID-19 vaccination is efficient and has shown advancements in coverage, it could affect disease control at the community level. 19
Although Peru was one of the first countries to establish community mitigation strategies in the area, it had the highest number of COVID-19 cases and associated deaths. 20 Despite multiple factors accounting for this situation, one of the reasons may be a lack of adherence to correct mask use, which decreased after the first year of the pandemic. At present, even though vaccination coverage has resulted in more than 36 million doses being administered and more than 70% of the target population being vaccinated with 2 doses, mask use remains a strategy recommended by the Peruvian government.21,22 Although most studies regarding mask use adherence and correct use are online,8-11 there have been several studies conducted with direct observation of the general population as it is necessary to assess actual mask use in the same way as assessing hygiene practices by health care staff. 23 Similarly, although some studies estimate variations in adherence to correct mask use, their follow-up was limited, 18 making them inadequate for a pandemic that has lasted more than 18 months.
Therefore, our study aimed to describe the variation in the frequency of correct mask use among Peruvian pedestrians in the first and second waves of the COVID-19 pandemic in high-flow indoor public spaces from different geographic and social settings in Peru.
Methods
Design
We carried out a multicenter cross-sectional exploratory study after the first wave (November 2020) and second wave (October 2021) of the COVID-19 pandemic in Peru. The first measurement of the outcome was in the pre-vaccination period, whereas the second measurement was in the vaccination period. For further illustration, we presented a timeline showing the main facts since the beginning of the pandemic (Figure 1). However, there were variations across health policies at the regional level.

Timeline of the main facts on the COVID-19 pandemic in Peru.
Population and Sample
We included pedestrians in 5 cities of Peru with more than 150 000 adult inhabitants: Lima (capital city), Cusco, Arequipa, Piura, and Chiclayo. Lima is the capital city of Peru that reported the highest number of COVID-19 cases in the country. 24 Similarly, Piura and Chiclayo are coastal cities in the north and capitals of the departments of Piura and Lambayeque and 2 of the regions of the country most affected by the pandemic. 24 In comparison, Piura is a hot desert city and is far from the sea, whereas Chiclayo is windier and is close to the sea. Moreover, Cusco and Arequipa are 2 cities in the country’s southern highlands and are the capitals of the regions of the same name (Figure 2). In the 2 observation periods, the inclusion of participants did not distinguish sex and age. We excluded runners, cyclists, people who were in the process of eating or smoking, and children aged below 5 years.

General characteristics of the Peruvian cities included in the study.

Frequency of mask misuse across all the cities between the two periods of observation (2020 and 2021).
Data Collection
We performed the registration process twice: in the morning (10:00-11:00 a.m.) and in the afternoon (3:00-4:00 p.m.). In both periods, the registration was directed at 2 observation points for each of the 5 selected cities: a commercial center (mall) and a local market. We included at least 50 people in every place and shift.
Lima: Jockey Plaza Shopping Center and Gamarra local market
Chiclayo: Real Plaza Shopping Center and Moshoqueque local market
Arequipa: Mall Plaza Shopping Center and Siglo XX Avelino Cáceres market
Cusco: Real Plaza Shopping Center and Wanchaq local market
Piura: Plaza del Sol Mall and Central Market.
We chose these indoor locations due to the high flow of pedestrians, minimizing the time spent by the observers at each location. The observations were stopped after including 50 participants (45-60 min). Only participants who were not in direct contact with the researchers and at a distance of >2 m were included. Data were collected using a printed tab matrix.
Variables
The primary outcome was the use of masks classified into 3 categories: “no use,” “incorrect use,” and “correct use,” according to the Ministry of Health (MINSA) regulations (ie, covering the nose and mouth). This classification was independent of the material of the masks. Additionally, “misuse” was defined as “no use” and “incorrect use.”
The primary exposure variable was the 5 selected cities—Lima, Piura, Cusco, Arequipa, and Chiclayo—based on the characteristics of each town on demographic, geographic, social, and economic levels, reflecting the regional presentation of the waves of the COVID-19 pandemic in Peru (Figure 2).
Other variables included in the analysis were: sex (male and female), age (young adults: <40 years, middle-aged adults: 40-59 years, and old-aged adults: ≥60 years), and obesity (obese or not obese, based on the Body Mass Index higher than 30 kg/m2). In all cases, these values were defined by the assessment of medical students trained in anthropometric evaluation. The same evaluator measured in both periods for each city.
Statistical Analysis
Database and descriptive analysis
We generated a dataset in Microsoft Excel® (Microsoft Corporation, Los Angeles, CA) by inputting the data collected by each of the observers. We compared the values between the physical matrix and digital records in a random sample of 30 observations for every city and period as a quality control measure. We used STATA® software version 17.0 (StataCorp, College Station, TX).
Bivariate analysis using hypothesis testing and confidence intervals
Categorical data were presented as frequencies and percentages. The chi-square test was used to compare the participants’ general characteristics among the 5 cities within each period. The test of proportions was used to compare the 2 periods (2020 and 2021) in each of the analyzed cities.
The frequencies of non-use, correct use, incorrect use, and misuse of masks were compared between 2020 and 2021 for all participants and each city using the test of difference in proportions estimating the 95% confidence intervals (95% CIs) for the exact binomial distribution.
Regression models
Considering mask use as a response variable, we applied multinomial logistic models with correct use as the reference category (vs non-use and incorrect use) in each period. The dummy variable for each city was exposure. We estimated crude relative prevalence ratios (RPRs) and adjusted RPRs (aRPRs) for sex, age, obesity, and location (mall and local market) with 95% CIs based on the binomial distribution with non-parametric bootstrap with corrected and accelerated bias (1000 repetitions in each year) and with the Jackknife replications differentiated each year (997 for 2020 and 999 for 2021).
Additionally, we applied a binomial generalized linear model in an exploratory way using misuse as the binary outcome and city as the polytomous exposure to estimate prevalence ratios with 95% CIs in crude prevalence ratio (PR) and adjusted PR (aPR) models. We used the same bootstrap procedure as the multinomial model for each study period, although we incorporated a robust standard error term.
It is important to mention that we employed a frequentist approach for our analysis. Due to the lack of a known distribution at the population level, we decided to apply a nonparametric bootstrap.
Ethics
The Institutional Research Ethics Committee of the Universidad Católica Santa María approved the research protocol (192-2020). Our study was conducted following the Declaration of Helsinki. No personal information or sensitive data were collected, and the data of the observed participants were confidential.
Results
Participant Characteristics and Distribution of Variables Across the Cities
We included 999 observations in 2020 and 997 observations in 2021. In the case of Lima (metropolitan area), we registered 200 participants in 2020 and 202 in 2021. In Piura, Arequipa, and Chiclayo, we observed 200 people each year. In Cusco, we had 199 observations in 2020 and 195 in 2021 (Table 1).
General Characteristics of the Study Population.

Participants wearing masks.
When the distribution of age groups among the cities was evaluated, we observed a statistically significant difference in terms of age and obesity analyzed in 2 years (P < .001). In both years, Arequipa had the highest frequency among old-aged adults, showing a considerable increase in 2021 (16.5% vs 55.5%). Cusco had the highest proportion of young adults in both periods (71.3% in 2020 and 61.0% in 2021). Concerning obesity, the highest frequency was observed in Piura in 2020 (45.5%) and Lima in 2021 (29.7%). Notably, the frequency of obesity was considerably higher in the capital city and the 2 northern coastal cities than in the 2 cities of the southern highlands. In contrast, no statistically significant difference was observed in the distribution of sex among the 5 cities in 2 years. Moreover, when we compared the distribution of these 3 variables between the 2 periods for all cities, we observed statistically significant differences for the age groups (P = .002) and obesity (P = .01) but not for sex (Table 2).
General Characteristics of Participants Across the Cities in Both Periods.
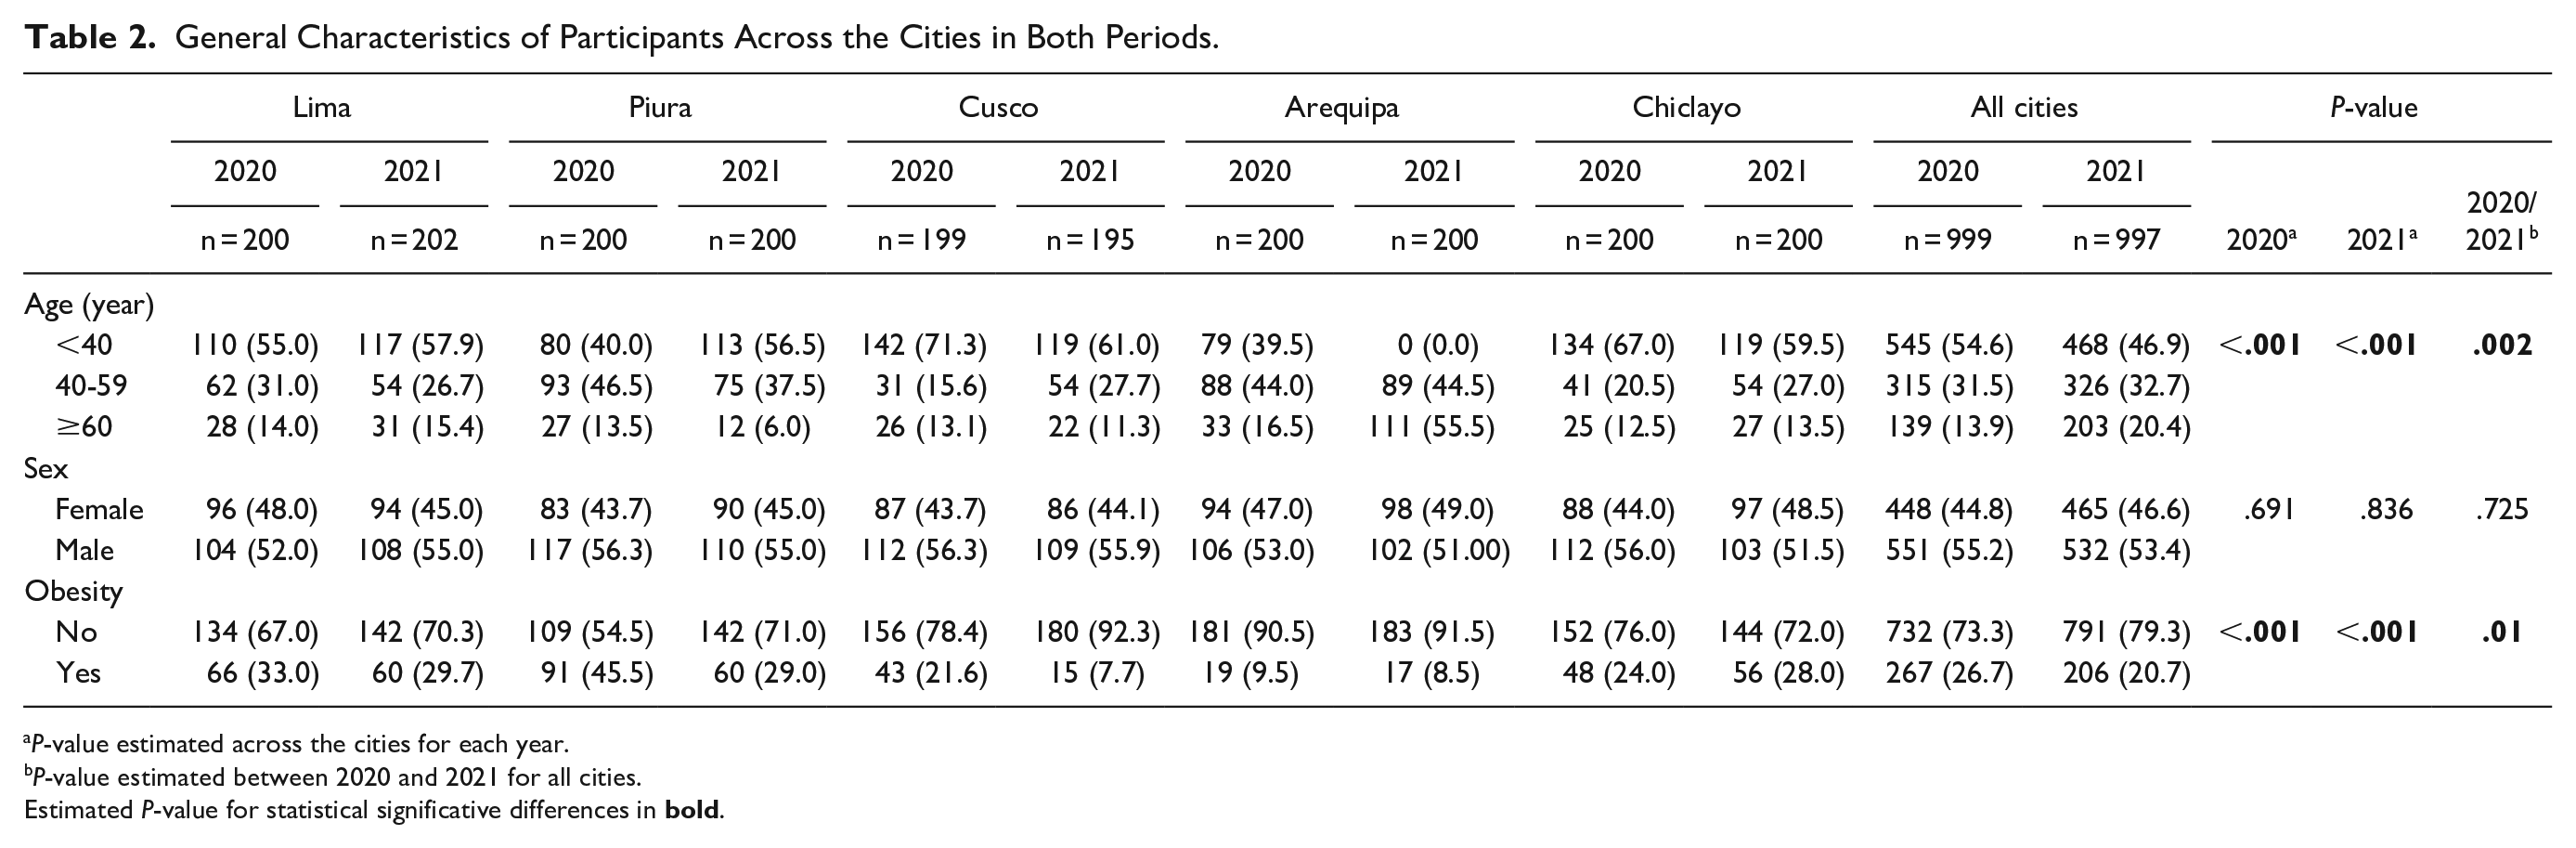
P-value estimated across the cities for each year.
P-value estimated between 2020 and 2021 for all cities.
Estimated P-value for statistical significative differences in
Frequency of Non-Use, Incorrect Use, Correct Use, and Misuse
When the response variable across all the cities between the 2 years of observation (2020 and 2021) was evaluated, we noted that there was a statistically significant increase in incorrect use (14.9% vs 35.2%, P < .001) and misuse (18.7% vs 39.7%, P < .001) and a statistically significant decrease in correct use (81.9% vs 60.3%, P < .001). However, no variations were observed in the frequency of non-use. In Lima, Piura, and Cusco, a pattern similar to the national pattern was observed, albeit with a higher relative frequency of misuse and incorrect use in the first 2 cities analyzed in 2 years. In the case of Arequipa, we only found a significant increase in non-use (2.0% vs 11.0%, P < .001). In Chiclayo, we observed a statistically significant increase in the frequency of incorrect use (19.5% vs 34.5%, P < .001; Table 3 and Figure 3).
Use and Type of Use of Masks in the Cities Included in the 2 Analysis Periods (2020 and 2021).

One side 95% confidence interval (95% CI).
Estimated P-value for statistical significative differences in
Multinomial Logistic Models
In Table 4, based on the dummy variables approaching, we observed that in Lima (metropolitan area), the probability of incorrect use increased (compared with correct use) in both years, albeit with a greater magnitude in 2021 (aRPR: 3.42, P < .001). In Piura, we only observed an increase in the probability of incorrect use (compared with correct use) in 2021 (aRPR: 1.98, P < .001) but not in 2020. In Cusco, we noted a decrease in the probability of incorrect use (compared with correct use)—concerning the rest of the cities—in both years (aRPR: 0.17, P < .001 in 2020 and aRPR: 0.14, P < .001 in 2021). Compared with the other cities, a statistically significant increase in the probability of incorrect use (compared with correct use) was observed in Arequipa in 2020 (aRPR: 1.73, P < .015) but a decrease in 2021 (aRPR: 1.73, P < .015). In Chiclayo, we noted an increase in the probability of non-use and incorrect use (compared with correct use) in the other cities in 2020. In 2021, we did not observe significant changes in the probabilities.
Relative Prevalence Ratios for Non-Use and Incorrect Use of a Mask According to the City in the 2 Analysis Periods (Multinomial Logistic Models).
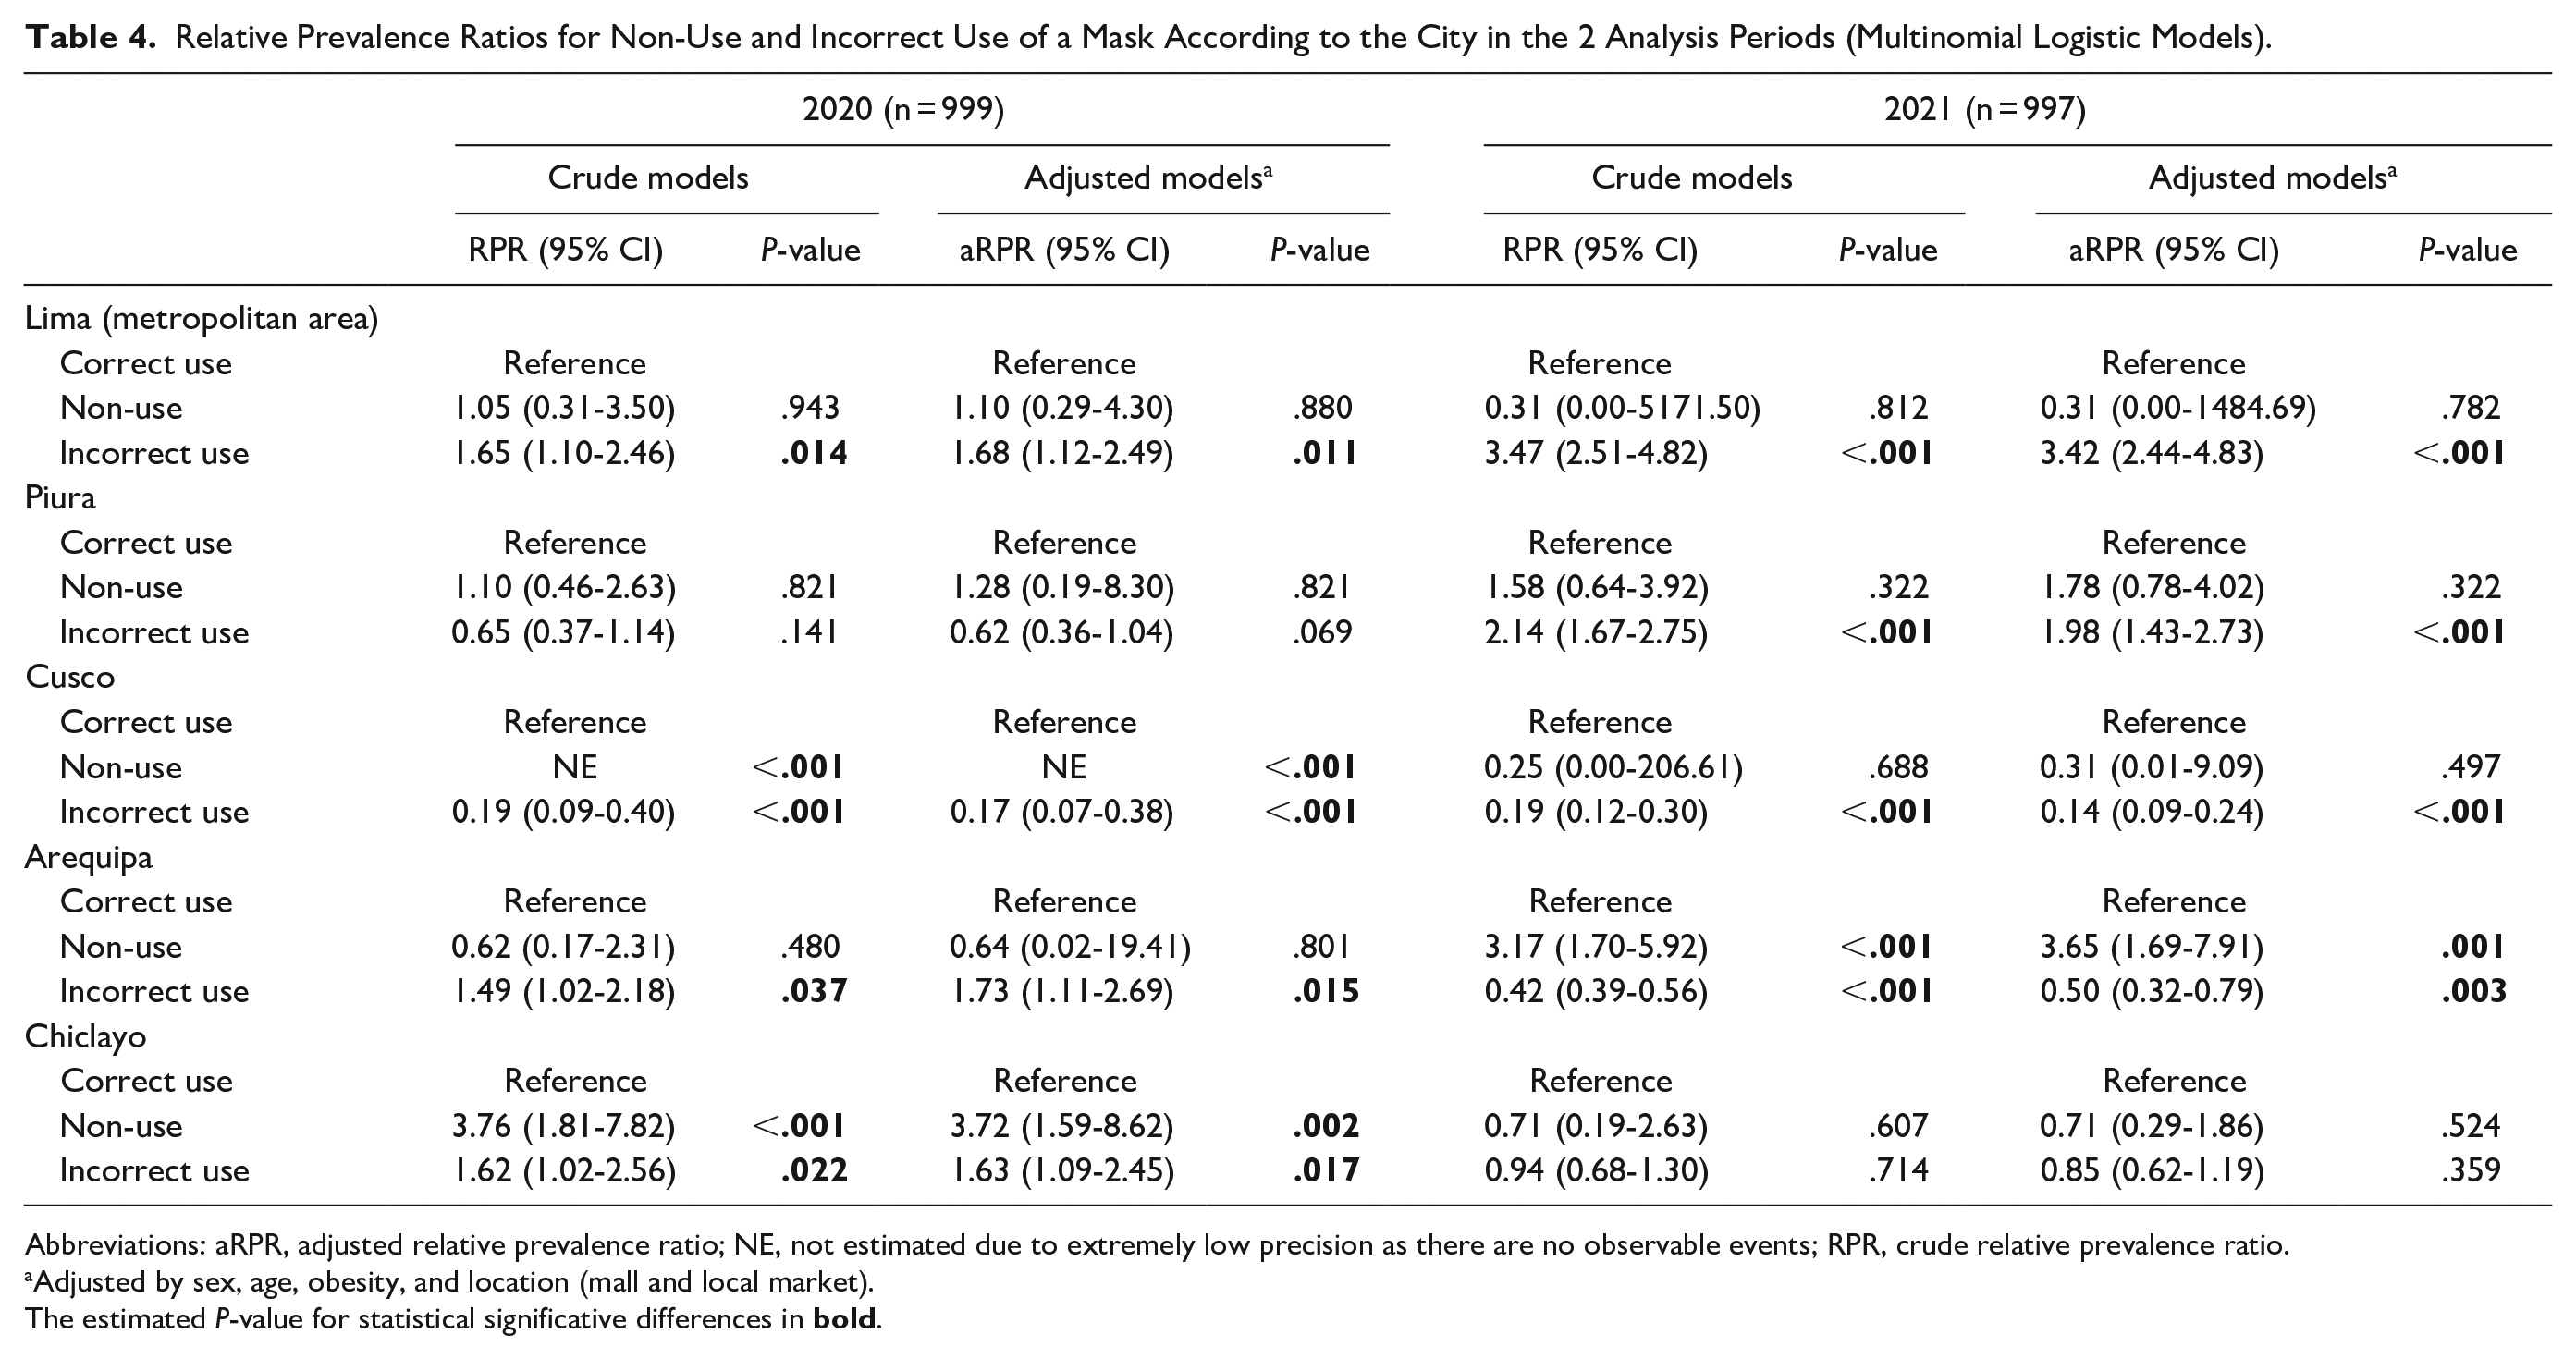
Abbreviations: aRPR, adjusted relative prevalence ratio; NE, not estimated due to extremely low precision as there are no observable events; RPR, crude relative prevalence ratio.
Adjusted by sex, age, obesity, and location (mall and local market).
The estimated P-value for statistical significative differences in
Binomial Generalized Linear Models
In Table 5, we present the estimates for the binomial family models. In 2020, we observed an increase in the probability of misuse in the cities of Lima (aRP: 1.42, P = .021) and Chiclayo (aPR: 1.62, P = .001) with no statistical evidence of association with the cities of Piura and Arequipa. In 2021, we noted an increase in the probability of misuse in the cities of Lima (aRP: 1.72, P < .001) and Piura (aPR: 1.44, P < .001) without association with the cities of Arequipa and Chiclayo. In Cusco, we found a decrease in the probability of misuse in both years (aRP: 0.18, P < .001 in 2020 and aRP: 0.29, P < .001 in 2021).
Prevalence Ratios for Misuse of a Mask in All Cities in the 2 Analysis Periods (Binomial Generalized Linear Model).

Abbreviations: aPR, adjusted prevalence ratio; PR, crude prevalence ratio.
Adjusted by sex, age, obesity, and location (mall and local market).
The estimated P-value for statistical significative differences in
Discussion
Main Findings
The results of our study show that there were intercity variations in correct mask use between both periods. In Lima, misuse and incorrect use persisted since 2020 and increased in 2021. In Piura, both parameters were not significant in 2020 but were substantial in 2021. On the other hand, a substantial decrease was observed for both parameters in Cusco in 2021, and the probability of incorrect use decreased in Arequipa. Therefore, there is a global decrease in the use of masks; however, there are variations among the 5 selected cities. These variations might be due to external factors of each city, as the policies on mask use are nationally implemented.
Plausibility and explanation
Several unmeasured variables prevail in each region such as geography, weather, and humidity. These factors could exert an impact on adherence to correct mask use. For instance, in coastal cities such as Piura and Chiclayo, the weather is hotter than in the highland cities such as Cusco and Arequipa. Moreover, the idiosyncrasies and customs of each region could condition adherence to the use of masks. Even though the policies on mask use were nationally implemented, adherence is locally determined. Interestingly, there was a decline in adherence to the correct mask used in the second measurement. It may be related to the arrival and administration of the vaccines.
In Lima, mask misuse and incorrect use showed significant values in both observation periods, with an increasing trend in 2021. This finding is of great concern as this city had the majority of the country’s cases and deaths, which at present accounts for more than 1 million confirmed cases and 89 000 deaths. 21 Nevertheless, Lima has better education and social and health indicators, including a higher concentration of healthcare centers than the other assessed areas.25-30 Although the reasons for this increase were not studied, they are likely related to factors such as being the city with the highest economic activity in the country, in which the need for going to work decreased the probability of adherence to correct mask use. 31 This is possibly related to sex, considering that there are more men than women in the country’s economically active population 31 and that being a male is associated with a lower probability of mask use adherence. 32
However, these differences cannot be easily explained. Although it is tempting to assume that our findings could be explained by certain social determinants that vary in each region, their association is unclear. For example, when considering education as an indicator suggesting that the higher the education, the higher the probability of following health indications, contradictory findings are observed. Indeed, the percentage of participants aged 18 to 25 years with complete high school education in 2020 was 91.7% in Cusco and 81% in Piura, and the net attendance rate among participants aged 17 to 24 years at a higher education level was 20.4% in Piura and 22.4% in Cusco.26,29 These findings suggest that education accounts for the lower adherence level observed in Piura, but when compared with Lima, the association is not so evident. In Lima, the percentage of participants aged 18 to 25 years with complete high school education in 2018 was 89.7%, and the net attendance rate among participants aged 17 to 24 years at a higher education level was 40.7%. 25 These findings show that assuming certain influencing factors is uneasy, although some studies suggest a possible association of these factors with COVID-19 prevention and control strategies in the Peruvian population, 33 inadequate information use and inadequate emotional confrontation against COVID-19, 34 or even a varying perception and knowledge of COVID-19 among regions of the country. 35
Another aspect to be considered is the so-called pandemic fatigue. Physical and psychological fatigue has been reported as a consequence of COVID-19 restrictions, and some people are taking fewer precautions to prevent COVID-19 as opposed to the beginning of the pandemic.36,37 A study conducted in Turkey found that 34.4% of participants reported a decrease in the precautions taken against COVID-19 as opposed to the beginning of the pandemic. 36 A study performed in Hong Kong reported similar results when assessing adherence in the June and July waves that occurred in 2020 against the November and December waves in the same year.36,37 Pandemic fatigue occurs when stress increases beyond a certain threshold and people do not feel motivated to follow the recommendations aimed at protecting themselves and others, thereby becoming a public health threat.36,37 Our health authorities should consider strategies to support society and strengthen the government–society association to achieve a successful, solid, and effective public health response.
Comparison With Previous Studies
Several studies have analyzed the reasons for and barriers against mask use. A qualitative study showed that the most prevailing motivation was protecting or respecting others. 38 Other motivations were self-protection, responsibility, a desire for control, and experts’ advice. 38 On the contrary, the barriers identified included physical and social malaise, confusion or lack of information, certain concepts related to autonomy, and low susceptibility to COVID-19 perceived by participants. 24 Oftentimes, the messages sent by national and global regulatory authorities were the reason why initial messages did not fully motivate mask use due to inconsistency of information. 39
Mask use decreases viral transmission, and several ecological studies have associated mask use with a decrease in hospital admissions and mortality among patients with COVID-19.12-14,19 However, adherence varied in each country during the first phase of the pandemic. Chinese studies reported an adherence between 79.7% and 99%.9,24 Moreover, compliance varied depending on whether it was enforced by law, reaching more than 90% in countries such as Vietnam and Mozambique. 40 On the contrary, it reached 43.2% in the Democratic Republic of the Congo. 40 In countries where mask use was not mandatory, adherence varied, for example, in some Latin-American countries such as Brazil (45.7%) and Ecuador (91.7%). 40 In Peru, an assessment conducted between June 5 and June 11, 2021, showed that adherence to mask use was 99.7%. 40 Nevertheless, these studies consisted of virtual surveys, which may overestimate mask use.
Few studies with direct observations have been conducted to assess adherence to mask use during the pandemic. A study conducted in Vermont, USA, with pedestrians walking by public shops in May 2020, found that 75.5% of participants used a mask. 41 Another study conducted by observing consecutive photographs taken at the airports of Bangkok, Paris, Boston, Atlanta, and Lima in March 2020 reported 46%, 4%, 3%, 2%, and 27% adherence, respectively. 42 A study performed in April 2020 near a Hong Kong hospital showed that 96.6% of participants used masks. 43 In addition, a study conducted between September and November 2020, a period similar to the one of our first observation, showed that masks were used by 85.5% of university students in the United States. 23 The differences observed between these results and our findings may be explained by various scenarios in which adherence was assessed, leading to incomparable results. In this sense, our study included not only different cities within the same country but also different times and places with the high pedestrian flow to assess mask use adherence in a scenario that is as real as possible.
Similarly, the time at which the recommendations were made has affected the adherence to mask use. In the United States, messages sent between the end of July and the beginning of August increased adherence. 32
Public Health Implications
Nevertheless, no studies assessed variations in adherence to mask use between 1 year and another. Although studies assessing correct mask use in the first phase of the pandemic showed an adherence that ranged from 30% to 80%,8-11 depending on the study country and regardless of the type of evaluation used (online assessment or direct observation), few studies have analyzed variations in adherence as the COVID-19 pandemic evolved. A study conducted in Poland showed that correct mask use decreased by 7% between April and May 2020. 18
Our results suggest that the decrease in mask use was heterogeneous, and significant differences were observed in different areas of the country, with potential implications for public health policies. From this perspective, it is important to develop strategies to increase adherence to correct mask use and to adapt them to each particular region, such as has been suggested in other areas. 44 This is because although advances in immunization have been made, community mitigation strategies will still be necessary given the presence of high-infectivity variants. 45
Although the number of cases and deaths has decreased and vaccination coverage has shown significant advancements worldwide, cases are continuously increasing, thereby shaping the fourth pandemic wave in the country, which may be due to the increase in mask misuse or incorrect use in this area. 21 Indeed, although the effect of COVID-19 vaccination is reflected in the decrease in hospital admissions and deaths, the number of diagnosed cases could increase, especially given the emergence of new virus variants46,47; hence, community mitigation strategies are still necessary.
Limitations and Strengths
Our study has some limitations. First, it was an exploratory study conducted in 5 specific cities, so the results cannot be generalized to the country overall. However, we tried to increase the representativeness of our results by including some of the biggest cities in the country in an attempt to capture the conditions of different natural regions. Second, secondary outcomes were assessed by direct observation with possible variations among evaluators, given that social distancing was maintained with pedestrians for safety reasons. Indeed, the measurement method is useful in epidemiological studies, especially in situations where direct contact is restricted, as in the case of the COVID-19 pandemic. Third, there are unmeasured variables that are of the individual and of the conglomerate that could influence the correct use of masks. However, the general characteristics of each city have been presented. Fourth, given the small sizes among the stratified groups, the Bayesian approach is an interesting alternative for the analysis. Nevertheless, we designed the study with a predefined frequentist approach using bootstrap non-parametric methods, avoiding the risk of confirmation bias due to the use of post hoc (non-predefined) Bayesian methods. Despite these limitations, to the best of our knowledge, this is the first publication in the Peruvian setting assessing variations in correct mask use that included a long follow-up period across 2 first waves of the COVID-19 pandemic.
Conclusion
In conclusion, there was a decrease in the frequency of correct face mask use between the first and second waves of the COVID-19 pandemic in high/flow indoor public spaces in Peru. There was a regional variation due to geographic and sociological factors.
Footnotes
Declaration of Conflicting Interests
The author(s) declared no potential conflicts of interest with respect to the research, authorship, and/or publication of this article.
Funding
The author(s) received no financial support for the research, authorship, and/or publication of this article.