
Abstract
This study compares hospital admissions over a 3-year period (2009-2011) between a community’s 2 major private, fee-for-service physician groups and an insurance administration–free, hospital-affiliated clinic designed to provide a full array of primary care services to low-income individuals at little or no cost. We use data on patients’ chronic conditions and inpatient hospital admissions to compare patients’ average number of physician office visits and overall hospital admission rates per 1000 patients. The data indicate that while clinic patients have a higher (or equal) average number of chronic conditions compared with patients in the private physician groups, they exhibit lower hospital admission rates. Clinic patients also exhibit a higher average annual frequency of physician visits. Results of this study suggest that enhanced access to primary care could help mitigate inefficient use of non–urgent care hospital resources for the uninsured and reduce costly hospitalizations even in the short run.
Keywords
Introduction
Administrative costs in US primary care offices have been growing steadily over the past 40 years without improvements in overall patient health. Obesity and diabetes mellitus (DM) rates continue to rise and according to the World Health Report (2000), the US health system ranked 37th out of its 191 members in health outcomes. 1 The percentage spent on billing and insurance in a single specialty primary care office has risen to 14.5% of total revenue according to Kahn et al. 2 While health insurance plans have taken steps to reduce the administrative time burdens they place on physicians and clinical staff, physicians spend nearly 3 weeks per year, and nursing staff nearly 23 weeks per year, interacting with health plans. This time cost is especially large for primary care offices, particularly small offices. 3
This article examines the potential health outcomes benefits of a new approach to ambulatory medicine, an insurance administration–free primary care office. The current patient-centered medical home (PCMH) model initiatives around the country have shown promise,3,4 although results vary.5,6 Geisinger’s PCMH has shown a decrease of 56 admissions per 1000 patients in hospital admissions using the coordinated method.7,8 The home model uses nurse managers who coordinate the care between the patients, primary care physicians, and subspecialists. However, managers are also responsible for maneuvering patients through their individual insurance plans. The more variable the covered benefits and associated time costs needed to administer patients’ insurance plans, the more difficult it is for managers to execute a truly coordinated treatment plan. Also, cost is a key factor in patients’ choice of treatment plans. With the advent of high deductible plans in the health exchanges, the RAND study showed that with a $1000 deductible policy, both low- and high-income patients chose to forgo certain tests and procedures important to their preventive care. 9 This contrasts with mounting evidence that increased interaction with health care professionals leads to improvements in patient well behaviors and health outcomes.10-13
Study, Data, and Methods
This study compares Partnering for Health Services (PHS), a completely insurance administration–free office located in Altoona, Pennsylvania, with the 2 largest primary care groups in the Altoona, Blair County, Pennsylvania region: Blair Medical Associates (BMA) and Mainline Medical Associates (MMA). BMA and MMA provide primary care under the traditional insurance fee-for-service payment method to almost 60% of Blair County’s 127 121 residents. 14 BMA is a large multispecialty group with a total of 40 physicians. We limit our focus to the family practice portion of this group, which consists of 16.5 fulltime equivalents (FTEs). MMA is Altoona’s second largest family practice group with 12.84 FTEs. BMA and MMA follow a patient procedure common to most insurance fee-for-service primary care offices in the United States: The patient enters the office and is met by a receptionist who must process his or her insurance information. The patient is then escorted by a nurse to an examination room. In the examination room, the nurse assesses the patient’s perceived clinical symptoms and insurance coverage. The physician then examines the patient and designs a treatment plan around the patient’s insurance coverage. Finally, the patient stops at the receptionist a second time to pay co-pays required by insurance. After the patient leaves the office, a nurse must contact the insurance company via telephone or electronically for approval of the treatment plan and any tests ordered by the physician. The nurse must also inform the patient of the treatment plan and discuss any barriers to compliance of the treatment plan due to cost.
Partnering for Health Services is a hospital-based family practice clinic started by Altoona Regional Health System (ARHS) in 1999 as a way to divert uninsured patients away from the emergency department for nonurgent services yet still provide the care they need. The clinic does not accept health insurance for its primary care services, even though approximately 30% of PHS patients carry hospitalization-only coverage. PHS is not a free clinic; rather it functions as a traditional full-service doctor’s office, open 4.5 days per week, providing all types of primary care services, diagnostic services, medications, and referrals to specialists within its network. PHS is an affiliate of ARHS as a cooperative effort among ARHS, volunteer physicians, full-time paid physician assistants, and patients. Patients are accepted into the practice by proof of no primary care insurance, have household income up to 300% of the federal poverty level, and do not qualify for Medicaid. For unlimited visits to the clinic with no co-pays or deductibles, patients pay a monthly capitation fee based on income. Patients with household income up to 150% of poverty level pay no fee; patients with income up to 300% of poverty level pay $99 per month. Small business owners can also purchase an employee-based plan for $169 per month per employee.
Partnering for Health Services’ patient procedure differs from that of a traditional insurance fee-for-service primary care office. Initially, each patient is assessed clinically by a nurse. The physician then examines the patient without insurance influence and designs a treatment plan based solely on the clinical criteria set forth by the PHS providers using American College of Physicians guidelines. After the examination, the patient meets one-on-one with a nurse care coordinator (or “nurse-closer”) who counsels the patient about the treatment plan and the patient’s role in the plan, reviews medications, sets up referral appointments with any specialists, and orders all tests, prescriptions, and refills. The patient then leaves the office without co-pays or deductibles. Clinic patients who are diagnosed with chronic illnesses are encouraged to have frequent visits to the clinic. Dieticians and diabetic educators are also embedded into the clinic’s model as part of a comprehensive treatment plan.
The forgoing analysis uses 3 years of data on unique (currently active) patients’ chronic health conditions, practice FTEs, number of patient visits, and number of inpatient hospital admissions to compare the PHS clinic with BMA and MMA in terms of overall patient health and hospital admission rates. Data consist of all patients in the 18- to 64-year age range currently active at PHS, BMA, or MMA from 2009 to 2011. Hospital admission rates are compared between the practices using average admissions per provider per 1000 patients.
Prevalence of Chronic Disease
Table 1 provides some basic summary health statistics on the patient populations based on data obtained from the CFOs of MMA and BMA (Val Mignogia, CEO, MMA; Charles Zorger, CFO, ARHS, personal communications), and from the PHS clinic nurse manager and hospital billing department (Cloyd Beers, Director, personal communication). We calculate group percentages of chronic diseases from the top five diagnoses outlined by Vital and Health Statistics from the National Center for Health Statistics. 15 The 5 diagnoses determined by ICD-9 codes of each patient visit are hypertension (HTN), cerebral vascular accident (CVA), coronary artery disease (CAD), diabetes mellitus (DM), and chronic obstructive pulmonary disease (COPD). Percentages are calculated as the annual number of unique patients with each disease divided by total annual unique patients. Since the annual percentages exhibit very little variation over the 2009-2011 time range, Table 1 figures represent 3-year averages.
Provider Population Percentages by Chronic Disease Diagnosis. a

Abbreviations: PHS, Partnering for Health Services; MMA, Mainline Medical Associates; BMA, Blair Medical Associates; HTN, hypertension; CVA, cerebral vascular accident; CAD, coronary artery disease; DM, diabetes mellitus; COPD, chronic obstructive pulmonary disease.
Group percentages were compared using the χ2 test; household income was compared using the t test.
In Table 1, group percentages of HTN, DM, and CAD were significantly higher among MMA patients. According to HCUP (Healthcare Cost and Utilization Project), 16 CAD is the second leading cause of a hospital admission. Among PHS patients, the prevalence of COPD (at 16.6%), the sixth leading cause of a hospital admission, is significantly higher than BMA and MMA patients. BMA patients exhibit the lowest prevalence of 4 of the 5 diseases, but do not differ significantly from PHS patients with the exception of COPD prevalence. While MMA patients claim the highest prevalence in 3 of the 5 categories, PHS patients exhibit the widest between-practice disparity in COPD cases. One plausible explanation for this disparity is household income, as higher COPD rates have been found to occur among unemployed or low-income workers who either smoke or work in jobs that expose them to dust or other respiratory hazards. 17 However, with regard to the other 4 diagnoses, no such income gradient is apparent.
Frequency of Provider Visits
Frequency of provider visits per patient was calculated using data on actual appointments confirmed within the specific calendar year for all unique patients aged 18 to 64 years. Since there were only slight annual differences in visit numbers across PHS, BMA, and MMA over the 2009-2011 time period, numbers are calculated as 3-year averages. In addition, because of slight differences in the number of unique patients per provider, patient numbers were rounded to the nearest thousand to maintain consistency. This rounding actually led to slightly lower average annual visits for PHS and higher average annual visits for BMA and MMA patients.
Table 2 shows BMA with a total of 46 100 visits from 17 074 unique patients averaging 2.7 visits per patient per year from 2009 to 2011. MMA recorded slightly lower average visits at 2.5 for its 12 938 unique patients. PHS recorded the highest number of average visits, totaling 4860 visits from its 986 unique patients, nearly twice that of MMA and BMA. One explanation for this difference could be the PHS clinic’s design, which encourages patients to visit the clinic often until control over their chronic illness is established. Another explanation might be that PHS patients, once accepted, encounter no insurance-related access problems; also, clinic physicians and staff engage in no insurance administration activities thus enabling them to see more patients.
Average Annual Provider Visits for Unique Patients Aged 18 to 64 Years, 2009-2011.

Abbreviations: BMA, Blair Medical Associates; MMA, Mainline Medical Associates; PHS, Partnering for Health Services.
Hospital Admissions
All 3 primary care practices—PHS, BMA, and MMA—use the same hospitalist service, Lexington Hospitalist, for their inpatient admissions. The 11-group hospitalist rotates shifts and has standing orders for most responsibilities, including determination of the appropriateness and the coordination of patient admissions and follow-up visits, providing bedside care, managing consultations and communications with specialists, ordering labs and procedures, and managing the discharge of patients. 6 Lexington Hospitalist has no access to insurance information of the patient, unless they request it, and treat each patient with predesigned treatment protocols to assure no variability in management of patients amongst the primary care physician, regardless of practice. Lexington Hospitalist provided data on admissions per each of the 3 providers for the years 2009 to 2011. Data provided by the Altoona Regional Hospital’s billing services was used to cross-check Lexington Hospitalist data for accuracy. Table 3 tabulates, for each practice, the average annual admissions per provider per 1000 patients.
Average Annual Hospital Admissions per Provider per 1000 Patients.
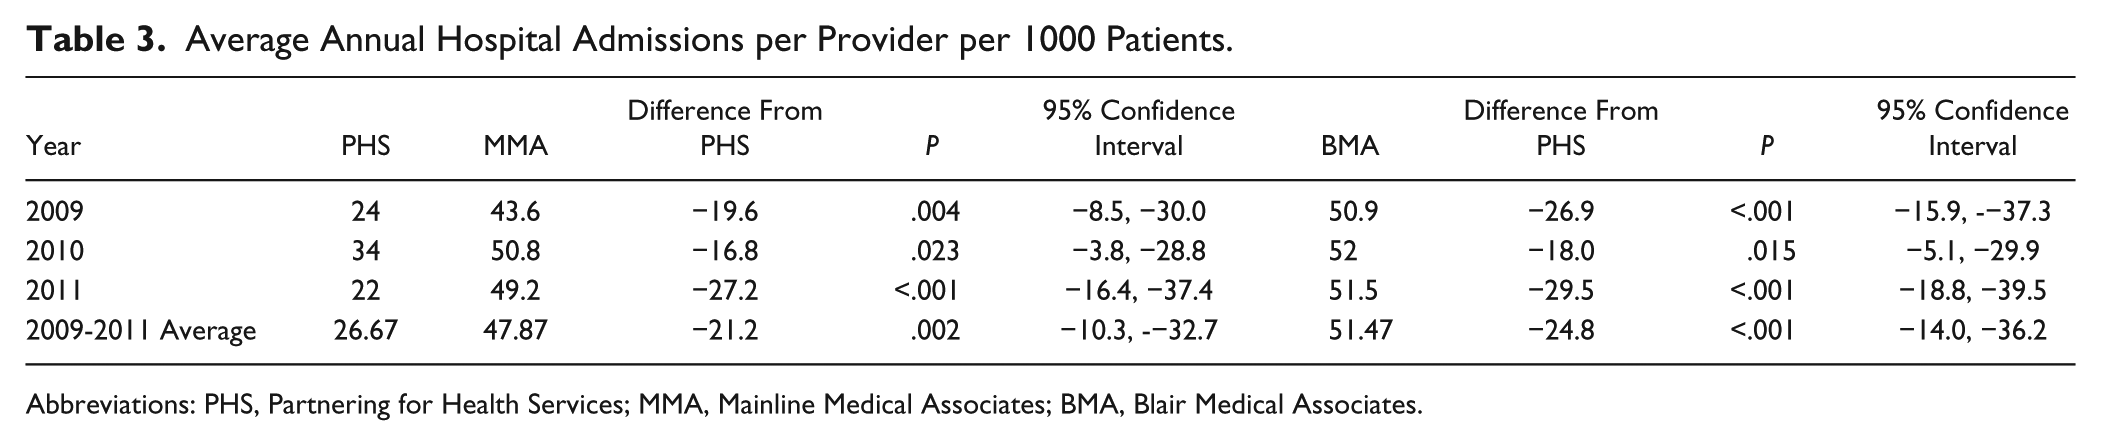
Abbreviations: PHS, Partnering for Health Services; MMA, Mainline Medical Associates; BMA, Blair Medical Associates.
The average annual admission rate for BMA patients varied only slightly from 2009 to 2011 with a 3-year average of 51.47 admissions per provider per 1000 patients. MMA’s rate was slightly lower at 47.87. By comparison, the average admission rate for PHS was 26.67 per provider per year, 21.2 fewer annual admissions than MMA (P = .002, 95% confidence interval = −10.3 to −32.7) and 24.8 fewer admissions than BMA (P < .001, 95% confidence interval = −14.0 to −36.2).
Discussion
This study compared hospital admission rates from 3 primary care practices located in the community, Altoona, Blair County, Pennsylvania. PHS is a full service, insurance-free primary care practice serving low-income and uninsured residents. BMA and MMA are the community’s 2 largest traditional insurance fee-for-service primary care practices serving approximately 60% of privately insured patients and 5% Medicaid patients. Data on patients’ chronic illnesses, household income, number of provider visits, and number of hospitalizations were used to compare the 3 practices’ patients’ chronic health conditions, household income, patient–physician visits, and hospitalization rates over the 3 year period from 2009 to 2011. Of the 3 practices examined, the PHS clinic recorded the highest number of patient office visits (nearly twice that of BMA and MMA) and the lowest number of hospital admissions (nearly half that of BMA and MMA).
One possible explanation for PHS’s visits/hospitalizations numbers is the clinic’s insurance administration–free model, reducing insurance-related access problems for qualified low-income patients as well as eliminating the time physicians and nurses must allocate toward administering health insurance. Recent research suggests the time burden associated with insurance administration could be substantial.2,3,18 According to Michelle Adams, Clinical Director of PHS, based on her past experience in a traditional insurance fee-for-service office:
When a patient has any type of insurance there are always numerous steps the provider and office staff must take in order to ensure payment of the service for the patient. These steps can be very time consuming and are usually spent on the phone with an insurance representative anywhere from 30 to 60 minutes for the approval of one test for one patient. Of course, this step is repeated multiple times each day, which consequently leads to less time directly spent on patient care and education.
Reflecting on her current role at the PHS clinic, Ms Adams remarks,
. . . fortunately, PHS provides office visits, ancillary testing, hospital admissions, emergency department visits, and, in most cases, consultations with specialists at low or no cost. The PHS design not only greatly benefits patients from a financial perspective but also benefits them from a healthcare delivery perspective. All our staff including the clerical staff, nurses and providers have increased time to spend on direct patient care. (Michelle Adams, PHS, personal communication, August 19, 2013).
Our results are consistent with some prior research in which greater patient–physician contact lead to improvements in patients’ health outcomes.10-13,19-21 Whether this increased contact improves patients’ ability to better follow treatment guidelines and/or encourages patient activation (a patient’s willingness and ability to take independent action to manage their health and care 22 ), evidence from this research found that, even after disease severity and demographic characteristics were controlled for, patients’ active engagement with their health care providers resulted in lower rates of costly use of medical services such as hospitalizations and emergency department visits. Albeit limited, there is also research suggesting that patient engagement strategies applied to uninsured patients in a low or no cost medical clinic setting results in significant improvements in patients’ management of their chronic diseases.23-25 The treatment and patient activation strategies examined in these prior studies, which included a nurse-managed delivery system, evidence-based disease management guidelines, and promotion of patient self-management, are very similar to the PHS model. The PHS model is designed to aggressively manage chronic health conditions of the uninsured by moving them from the outpatient setting to the inpatient setting. By design, the clinic provides more face time with physicians, physician’s assistants, and nurses to provide care for chronic illnesses. For example, by request of the clinic, diabetic patients are seen at PHS as often as once or twice per week until control over their diabetes is established. COPD patients are also encouraged to visit the clinic as early as possible on onset of an exacerbation in order for the clinic to monitor changes in their condition (see, eg, Lawlor et al 26 ). This approach would be difficult for BMA and MMA to implement since insurance generates a variable cost with each office visit because of the tasks of billing and processing co-pays and deductibles. Indeed, the current US health insurance market discourages frequent use of primary care services and would dramatically increase premiums if every chronically ill patient would use services in this manner.2,3,9 The PHS’s cost is fixed; this cost does not change by increasing or decreasing office visits because each patient’s visit does not generate a bill that must be processed.
The PHS clinic also uses a “nurse-closer” whose role is to review test results, explain and reinforce the treatment information provided by the physician, and explain and call in prescriptions, thus strengthening the PHS clinic’s aggressive approach to managing chronic conditions. According to the CEOs of BMA and MMA (Val Mignogia, CEO, MMA, and David Duncan, CEO, BMA, personal communications), since the nursing staff spends nearly half their clinical time processing insurance, both practices would have to increase their staff to make available a nurse-closer to meet exclusively with every patient at discharge. Such an increase in staff would make it difficult for the practices to maintain neutral operating margins.
Although the Patient Protection and Affordable Care Act (PPACA), when implemented in full, projects that 32 million additional Americans will acquire health insurance coverage, the Congressional Budget Office estimates that 23 million people will remain uninsured. There will also continue to be a large number of immigrants and others without access to insurance. Since most of our nation’s uninsured are low-income working households, their health care options are limited even if they qualify for Medicaid. As a result, the uninsured often delay or forego necessary primary and preventive health care because of cost and/or access problems. Most policy makers, health care industry leaders, and health care providers agree that accessible primary care for the uninsured can be long-run cost saving as early and preventive care costs less than use of emergency department or inpatient services that might later be needed for undertreated chronic health conditions. As such, communities, hospitals, and other health care providers will need to continue exploring new mechanisms for providing primary care services to vulnerable populations. The results of this study suggest that access to primary care could help reduce the inefficient use of hospital resources for nonurgent care for the uninsured and thus reduce costly hospitalizations even in the short run.
In August 2013, the Pennsylvania General Assembly unanimously passed Senate Bill 5, which makes available $10 million annually to the State Department of Health for grants to hospital-based clinics. 27 The $10 million appropriation is sufficient to fund a pilot program to open 5 new clinics that replicate the PHS model of primary care delivery. Funding will cover all salaries, operating and laboratory costs for a clinic of up to 1500 patients, as well as additional money to expand the clinics’ range of care to improve prenatal, obstetric, postpartum, and newborn care. In addition, another $5 million annually will be made available as tax credits to businesses that donate funds, products, or services to a hospital-based health care clinic. Senate Bill 5’s design was based in part on the record of success of the PHS clinic. For example, from 2009 to 2012, ARHS funded the PHS clinic’s operating costs and salaries at an average annual cost of $1.36 million. On average, ARHS realized an estimated annual savings of $1.49 million in avoided emergency department visits and inpatient admissions from uninsured patients, for a net annual savings of $201 414. 28
Footnotes
Acknowledgements
Helpful comments and suggestions from an anonymous reviewer are gratefully acknowledged. The authors also thank Patrick Irwin for excellent research assistance, and Val Mignogia, Mainline Medical Associates; Charles Zorger, Altoona Regional Health System; and David Duncan, Blair Medical Associates, for provision of data.
Declaration of Conflicting Interests
The author(s) declared no potential conflicts of interest with respect to the research, authorship, and/or publication of this article.
Funding
The author(s) received no financial support for the research, authorship, and/or publication of this article.