
Abstract
Introduction
Colorectal cancer (CRC) remains the second leading cause of cancer death in the United States. 1 Uptake of CRC screening tests remains below the Healthy People 2010 goal of 70.5%. 2 In 2010, only 58.6% of eligible adults in the United States were up to date for CRC screening. Adults living in rural locations have lower CRC screening uptake than their urban peers.3-8
Racial disparities in CRC screening rates are well documented,2,9,10 with non-Hispanic whites having higher screening rates than African Americans, Hispanics, Asians, or American Indian/Alaska Natives. Between 2000 and 2008, the prevalence of up-to-date CRC screening increased more in non-Hispanic white and African American populations than American Indian/Alaska Native and Hispanic/Latino populations. 11
Income, education, health insurance, and access to primary care are associated with receipt of CRC screening.12-14 Minorities living in rural areas may experience higher evels of poverty, uninsurance, and limited access to care compared with urban minorities or non-Hispanic white rural residents, 15 potentially leading to even greater disparities in receipt of CRC screening.
In this study, our primary aim is to evaluate urban–rural CRC screening disparities variability by race/ethnicity. We examine the results by type of test used in the context of the US Preventive Services Task Force guidelines available at the time the surveys were completed. 16 Knowledge of the prevalence types of tests used by subpopulations may guide development of targeted interventions to reduce CRC screening disparities. To overcome the relatively small sample sizes of rural minorities in many national studies, we combined multiple years of the Centers for Disease Control’s Behavioral Risk Factor Surveillance System (BRFSS).
Methods
Sample and Subjects
This cross-sectional prevalence study used data from BRFSS. Additional details about the sampling method, and methods of analysis for the BRFSS have been published elsewhere.17-19 Data from 1998-2005 were combined to maximize our sample. The BRFSS sample size increased during each year examined, but median response rates declined over this time frame. Additional information describing the BRFSS data collection process, BRFSS publications, and public use data itself can be accessed at http://www.cdc.gov/brfss/index.htm#about_BRFSS.
Dependent Measures
The primary dependent measure was report of timely screening for CRC for adults 50 years or older, as recommended by the United States Preventive Services Task Force Recommendations. 16 We considered respondents up to date if they reported receipt of a fecal occult blood test (FOBT) within the preceding 1 year or a flexible sigmoidoscopy or colonoscopy within the preceding 5 years.
Independent Measures
We ascertained rural residence by classifying respondent’s county of residence as being either metropolitan versus nonmetropolitan using Federal Information Processing Standards codes available on BRFSS. Residents were further classified using the 2003 Urban Influence Codes (UIC) of the Economic Research Service of the US Department of Agriculture, where urban was UIC 1 and 2 and rural was UIC 3-12. This study excludes states in which no nonmetropolitan counties exist. Alaska was excluded because county-level Federal Information Processing Standards codes for Alaska were not available, which makes differentiation between rural and urban residents impossible.
Race was determined by self-reported answer to the question “Which race do you most identify with?” Response choices included “White, Black or African American, Asian, Native Hawaiian or Other Pacific Islander, American Indian or Alaska Native, or other.” Respondents choosing other and Native Hawaiian or Other Pacific Islander were not included in this analysis due to their small numbers. Ethnicity was determined by self-reported answer to the question: “Are you Hispanic or Latino?” Response choices included “Yes, No, Don’t know or refused.” Respondents choosing “Yes” were coded as Hispanic/Latino. All other responses were coded as non-Hispanic.
Covariates
Using data from BRFSS, we adjusted for the follow characteristics: age, gender, census region. Socioeconomic status was characterized by educational attainment and annual household income Health status and insurance status were also included. Survey year (1998, 2000, 2002, 2003, 2005) was included as a control variable to account for secular trends in screening uptake.
Analytic Plan
We used χ2 testing to examine the unadjusted proportion of respondents who reported being up to date on CRC screening for each characteristic. We used logistic regression to model the relationship between CRC screening uptake and the independent measures of urban/rural geography and race/ethnicity, tested for significant interaction between rural status and race/ethnicity, adjusted for demographic and socioeconomic characteristics, and used the fully adjusted models to calculate the adjusted predicted probability of screening for each group. For each estimate, 95% confidence intervals were used for between group comparisons. Tests were 2 tailed, with a significance of P < .05. We repeated the modeling described above for the outcome of receipt of FOBTs versus no screening and for the outcome of receipt of endoscopy screening (flexible sigmoidoscopy or colonoscopy) versus no screening. We adjusted all significance tests for the BRFSS’s complex sample design using the Centers for Disease Control and Prevention’s formula; we conducted analyses using Stata software, version 11 (StataCorp, College Station, TX).
Results
Descriptive characteristics of the population studied are shown in Table 1.
Demographic and Socioeconomic Characteristics of the Population, US 1998-2005 Combined. a

All values in percentage.
Unadjusted prevalence and adjusted predicted probability of being up to date on CRC screening using any test are presented in Table 2. After adjustment for demographic and socioeconomic characteristics, urban African American/blacks had higher uptake of screening than urban non-Hispanic whites (51.8% vs 49.5%). However, rates of screening for rural African American/blacks remained lower than urban non-Hispanic whites (44.8% vs 49.5%).
Unadjusted Prevalence and Adjusted Predicted Probability of Up-to-Date Colorectal Cancer Screening Status Using Any Test.
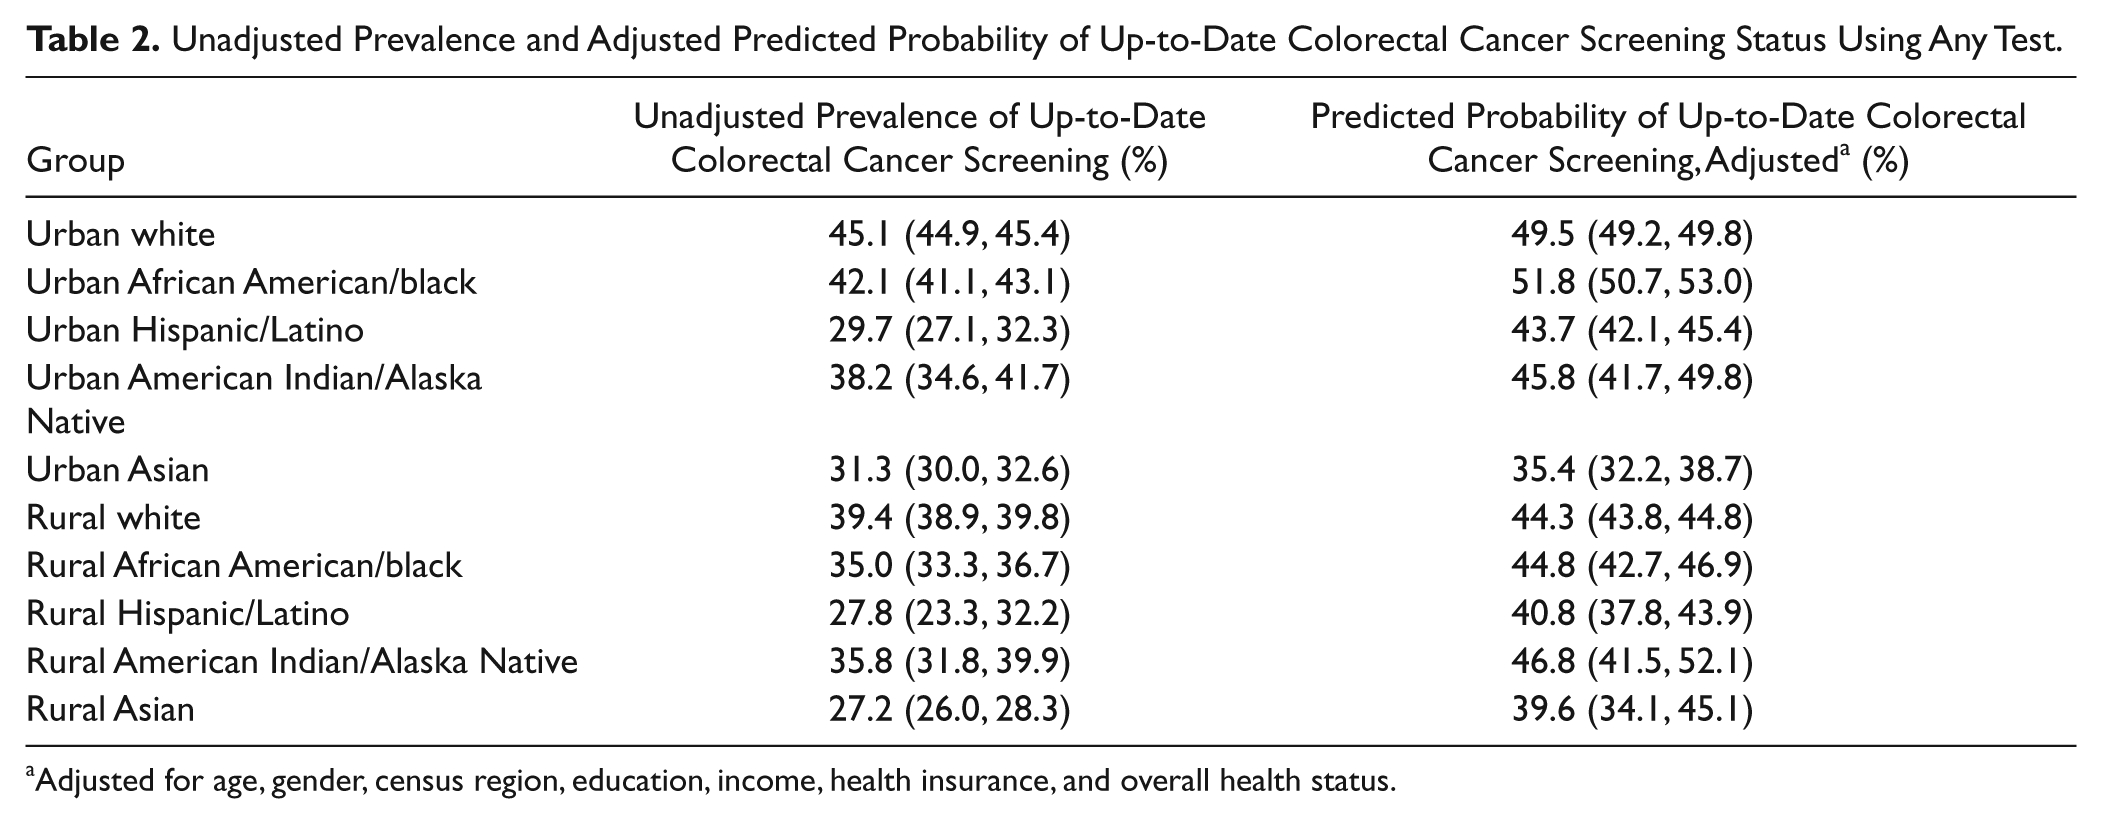
Adjusted for age, gender, census region, education, income, health insurance, and overall health status.
Rural African American/blacks had a lower probability of reporting CRC screening than did urban African American/blacks (44.8% vs 51.8%, P < .05). Rural Hispanic/Latinos had a lower predicted probability of reporting CRC screening than urban Hispanic/Latinos (40.8% vs 43.7%, P < .05). No statistically significant differences in predicted probability of screening were seen between urban and rural Asians or urban and rural American Indian/Alaska Natives. Contrasts are not shown in tables.
We also examined use of FOBT versus no screening and endoscopy versus no screening (Table 3). Compared with urban non-Hispanic whites, urban Hispanic/Latinos, urban Asians, rural Hispanic/Latinos, and rural American Indian/Alaska Natives had significantly lower predicted probability of reporting endoscopy screening (9.5% vs 6.4%, 6.1%, 7.7%, 6.9%, P < .05 for all comparisons). Compared with urban non-Hispanic whites, urban Asians, rural non-Hispanic whites, and rural Hispanic/Latinos had significantly lower predicted probability of reporting endoscopy screening (26.2% vs 22.0%, 23.7%, 23.0%, P < .05 for all comparisons).
Adjusted Predicted Probability of Self-Reported Receipt of Fecal Occult Blood Test (FOBT) in the Past 12 Months and Adjusted Predicted Probability of Self-Reported Receipt of Endoscopy Screening in the Past 5 Years, 1998–2005 Combined.

Adjusted for age, gender, income, education, health insurance status, and general health.
Discussion
The described persistent disparities for rural minorities may be because of limited resources20-22 and limited access to care. 15 Cancer screening rates are lower in counties experiencing persistent poverty, 23 where rural minorities are more likely to live. 20 Physician supply has been found to be lower in rural areas with large minority populations compared to rural areas without large minority populations, 24 and rural African American/blacks and rural Hispanics are less likely than their urban counterparts to report having had a health care visit in the past year. 25 Because physician recommendation is one of the strongest predictors of receipt of CRC screening,26,27 fewer health care visits may contribute to decreased screening rates in rural minority populations. Importantly, studies demonstrating that racial disparities in receipt of CRC screening are attenuated by adjustment for socioeconomic factors9,28,29 may be missing persistent disparities in rural minority subgroups.
Previous research has shown FOBT rates have remained stable in low income and minority populations while declining in higher income and non-Hispanic white populations. 30 Our research suggests that greater use of annual FOBT screening among rural adults may be an effective strategy for reducing CRC burden.
Our findings regarding endosocpy use are consistent with those recently reported showing that from 2000 to 2008, endoscopy rates increased more quickly in higher income and non-Hispanic white populations than in low income and minority populations. 30 CRC screening programs focusing on endoscopy only may have the unintended consequence of increasing CRC disparities for rural minorities. Including adequate numbers of rural minorities in studies evaluating CRC screening interventions will be important in addressing this issue. Successful programs have demonstrated effectiveness in increasing CRC screening in urban primary care clinics serving low-income and minority patients. 31 Expansion of these to rural areas may be effective at reducing CRC screening disparities.
Because of the age of the data used in the analysis and changes in screening over time, current CRC screening disparities may be different than what we report. We combined multiple years of data from BRFSS. If there are significant differences in urban–rural disparities or race/ethnicity disparities over the time of our study or up to the present, this may impact our conclusions. However, analysis of CRC screening trends over similar time periods demonstrate that while overall screening rates are increasing, urban–rural disparities have persisted (A. M. Cole, “Urban–Rural Colorectal Cancer Screening Disparities 1998-2005,” unpublished data, 2012), and race/ethnicity disparities have persisted as well.11,30 A recent study reported by Bennett et al 32 suggested that there were no significant disparities in CRC screening for rural racial minorities. Whether this represents a resolution of the disparities we report here or a limitation of the sample size used in that study remains uncertain. Our findings are similar to those reported in the “Health Disparities: an Urban–Rural Chartbook” in 2009, which showed significant disparities in CRC screening for rural minorities. Our findings contribute additional information with regard to the types of tests used for CRC screening and the persistence of the disparities after adjustment for sociodemographic factors.
The survey design combined colonoscopy and flexible sigmoidoscopy into one response. To avoid misclassifying screened individuals as unscreened and potentially overstate disparities in screening, we used endoscopy screening within 5 years as our outcome. During the time of this study, the US Preventive Services Task Force recommended flexible sigmoidoscopy and reported insufficient evidence to recommend colonoscopy. 16 Therefore, the majority of respondents reporting endoscopy screening likely had flexible sigmoidoscopy.
Our study demonstrates significant disparities in CRC screening for rural minority populations that are not explained by demographic and socioeconomic factors. Future research should focus on identifying additional factors contributing to these disparities and on developing interventions to reduce CRC screening disparities.
Footnotes
Declaration of Conflicting Interests
The author(s) declared no potential conflicts of interest with respect to the research, authorship, and/or publication of this article.
Funding
The author(s) disclosed receipt of the following financial support for the research, authorship, and/or publication of this article:
This study received grant support from NRSA T32 Ruth L. Kirchstein Primary Care Research Fellowship.