
Abstract
To illustrate the feature and structure of cultural authority of science in a Chinese context, this study reports on the features and current status of the cultural authority of science across China via a structural analysis of public perceptions of science as measured by cognitive, evaluative and behavioural indicators. Regional socio-economic disparity in China is significant, and we expect that disparity to give rise to diverse public attitudes to science. This study aims not only to enrich the regional data on current international efforts to compare public attitudes to science, but also to provide evidence-based research for other countries to discuss the diversity in the patterns of the cultural authority of science.
Since the founding of the People's Republic of China, China's science and technology (S&T) development has been carried out under a government-led strategy. With the recent new focus on an ‘innovation-driven development strategy’ as China's basic policy in the ‘New Era’ of China, the political authority of S&T has been firmly established. For some time, science popularization has been part of a ‘literacy’ campaign that aims to provide cultural education for the wider population. Both the literacy campaign and the new innovation strategy lay the foundation of what one might call a ‘lighthouse model’ (see Bauer et al., 2018) of science authority in a Chinese context, in which the vision of science shines a directing light into Chinese society. As the knowledge-producing part of the national innovation system, universities and research institutes are supported mostly by the government. In this case, the science community in China is considered a beacon for the lay public, as suggested by the lighthouse model. However, as we know from other contexts, the formally established authority of science does not yet guarantee the public's endorsement of that authority as a matter of everyday culture. This is what we call the ‘cultural authority of science’.
Previous research in China on attitudes to science
Although an increasing number of foreign researchers have noted studies related to the public understanding of science (PUS) in China, such studies have been rare. The survey-based research stream of Chinese scholars focuses mainly on the fostering and analysis of ‘civic science literacy’ in China. As some researchers have indicated, ‘Far Eastern countries, such as Japan and China, focus on literacy, and the issue of public attitudes to science is approached with hesitation’ (Bauer, Shukla and Allum, 2012).
Ren and Xie (2012) noted that the history of Chinese science communication, which was initially dominated by top-down government concerns, has been adjusted to increasingly meet the needs of a diversifying public audience. Through their analysis of the demand structure of science communication, they concluded that different groups in China have different predilections for the communication channels and lifestyle patterns by which they access relevant information. With the establishment of multiple and more individuated cultural lifestyles, public demand for popular science also tends to become more varied and individualized. In the absence of thorough descriptions and analyses of public attitudes to science in China, their conclusion on changing demands for science popularization strongly suggests the need for such studies. Individuation and diversification can be seen as two hypothetical trends in Chinese attitudes to science, and a basically utilitarian view of science is one key dimension of that orientation.
Li and Yao's research (2014a, 2014b) explored the formation of Chinese public attitudes to science through exploratory and confirmatory factor analysis using several versions of questionnaires in Anhui Province. Their results summarized public attitudes to science in three dimensions: ‘emotional experience to science’, ‘cognition to science’ and ‘behavioural tendency to science’. With excellent reliability and data fit, Li and Yao believed that their questionnaire was a viable instrument for measuring the public's attitudes towards science. However, based on the three-component attitude theory (affect, behaviour and cognition), the three dimensions had been presupposed, and satisfactory statistical results were obtained only by repeatedly amending the questionnaire. Therefore, whether the conclusion drawn from this context is applicable needs further consideration and discussion. Moreover, even ignoring the sample size of the study, the sampling areas were all within Anhui Province, which limited the complexity of attitudes revealed by the study. Geographical and cultural specifics, even within Anhui Province, would greatly condition the structure of public attitudes to science. When looking at the whole of China, can public attitudes to science simply be summarized by these three dimensions? Is this 3D-structure solid enough to deal with the diversity of the country? These key questions are still waiting for answers from a questionnaire that is used in a nation-wide survey.
Yang (2014) used multivariate regressions to model the factors that influence public attitudes to science. Similarly to Li and Yao's study, Yang also started from the three-component attitude theory and translated Rosenberg and Hovland's classic ternary theory—comprising ‘cognition’, ‘emotion’ and ‘behaviour’ in relation to an object—into ‘interest in science’, ‘opinion about science’ and ‘concerns about science and science controversy’. Since this translation was made before any supporting evidence was produced, the conclusions seemed premature. The sample for the study (n = 1,071) was collected in the cities of Chongqing, Taizhou and Yichang, similarly to the strategy used in Li and Yao's study. Both studies made reference to the seven waves of China's civic scientific literacy survey from 1992 to 2007; however, they did not mention the eighth survey of 2010.
The series of reports on Chinese civic scientific literacy (He, Zhang and Ren, 2015; Ren, 2010, 2011) edited by the China Research Institute for Science Popularization (CRISP) introduced the nationwide civic science literacy survey in China and stressed, in particular, the results of the 2010 survey. In the first volume of the reports, three surveys conducted before 2007 categorized public attitudes towards science into four types: ‘opinion about science’, ‘cognition on science development’, ‘attitude to science innovation’ and ‘ideas about S&T professionals’. In each category, positive and negative descriptions were used. In volumes 2 and 3, ‘public attitudes to nature’ was added as an index; in volume 3, the description of public attitudes was visualized in graphs and figures, detailed for each province and municipality under the central government.
Previous research (see Gao, Ren and He, 2008; He, Zhang and Gao, 2008; Ren, Liu and Ren, 2015; Wang et al., 2012; Zhang, 1991) based on the scientific literacy surveys in China introduced the foundations for researching public attitudes to science across a timeline of 25 years in China, without further examining the structure of those attitudes. Ren et al. (Ren, Zhang and He, 2014) tried to analyse these structures with two dimensions: ‘promise’ and ‘reservation’. However, there remains a need to see the whole picture of public attitudes to science across China more clearly. Meanwhile, the two dimensions examined in the study are based on the previous observations by Jon Miller (2004) in his comparison of attitudes to science in the United States, the European Union (EU), Canada and Japan. However, Miller's conclusions may need further consideration when they are introduced to China. First, he used two dimensions (‘benefit’ and ‘concern’) directly interpreted from people's positive and negative responses in the data to address public attitudes to science in four areas. It appears that interpreting those two dimensions as ‘expectation’ and ‘impact’ was unreasonable, especially as only four items out of 15 were selected from the questionnaire to justify the validity of their classification. Second, since the contexts of Miller's study were quite different from China, we need to keep an open mind about whether his structure could be generalized and applied as a model for confirmative purposes in China. In his study, even though he tried to describe a wider image from the data, the attitude measures were restricted within two simple evaluative dimensions, and there was no further exploration of the complex structure of attitudes in cognition, evaluation and behavioural features. Li Daguang (2005) used a similar method to describe public attitudes in China in two dimensions: positive and negative.
Pardo and Calvo (2002) reviewed the measurement and methods of analysis of attitudes to science using the Eurobarometer. They indicated the importance of using qualitative methods in interpreting the survey results. They critically discussed Durant et al.'s earlier structural analysis and considered the latter two of three factors (‘progress’ ‘panacea’ and ‘future shock’), which drew on 11 items about value and judgment, although that was not clearly stated. They suggested using more rigorous research instruments and more concrete and solid theory building to advance the structural comparison of attitudes to science. Durant et al.'s earlier three dimensions were obtained from exploratory factor analysis; they applied the three dimensions to all countries without distinguishing varied regional conditions. Although Pardo and Calvo (2002) criticized the power of exploratory factor analysis, they admitted that it is an essential first research instrument for analysing public attitudes to science. They also emphasized the complexity of those attitudes and suggested improvements to the 3D category labels, coming up with ‘positive’, ‘negative’ and ‘ambivalent’.
Based on varied observations of and conclusions about global efforts to survey PUS, Bauer, Shukla and Allum (2012) proposed a future strategy for PUS worldwide. Considering the problems caused by linguistic and cultural differences, they suggested that reanalyses of existing data with different eyes and open minds should be the way forward, not least to solve the problem of functional equivalence in otherwise different questionnaire studies, which is poignantly expressed by the Chinese scholar Cheng Donghong in a cooking metaphor: cooking the same ingredients with different sauces to release new flavours. 2 To develop science culture indicators, they suggested thinking about potential dilemmas between building a campaign guidance system and comparing cultural systems when thinking about research targets for general or specific indicators. From our review of studies of Chinese and foreign scholars, we conclude that most of them have built a campaign guidance system using general indicators. In this study, we introduce a focus on reconsidering the general indicators of new understanding when comparing cultural systems.
Liu, Tang and Bauer (2012) merged the Chinese (Anhui Province) and European data and analysed features of PUS in the two regions. The variables in their study were very similar to those in China's civic scientific literacy survey in 2010, which are used in the present study. Therefore, their methods offered an important ‘pilot’ for this study. They found ‘level of education’ and ‘urban– rural divide’ to be the two most important sociodemographic variables. That insight is used in the present study when exploring public attitudes to science in different areas and among people with very different backgrounds. These two sociodemographic variables add meaning when comparing the geographical variable (‘province’). Shukla and Bauer's (2012) conditional transformation method for securing linearity between indicators in different contexts when constructing the science cultural index across 32 European countries and 23 Indian provinces also provides a good model for processing cultural indicators.
The structure of attitudes to science in China today
Based on the previously cited studies in China and beyond, this paper tries to answer one question: Given that China is a country with a large population and a variety of cultures, how should its public attitudes to science be described?
Previous studies indicated that scholars had realized the limitation and increasing inadequacy of using a single, one-dimensional model of ‘literacy’ when describing China's emerging public attitudes to science. Moreover, although fixed dimensions are convenient and easier when measuring and comparing data, such methods would largely ignore the complexity of public attitudes to science across the country. Therefore, in this study, exploratory factor analysis was first conducted to examine the multifarious public attitude structures across China. In a second step, confirmatory factor analysis was conducted to test the fit of a 4D model of public attitudes towards science (see Bauer and Suerdem, 2016; Bauer et al., 2018). On the basis of this 4D model, 32 provincial regions (in which Xinjiang Production and Construction Corps, also known as ‘Bingtuan’, is treated as an independent region) of China are clustered into two groups with different science culture contexts.
Overview of the attitudes to science database
The eighth civic scientific literacy survey in 2010 was the largest sample of its kind in this field (n > 60,000). It covered all regions of the Chinese mainland and was statistically representative for 32 provincial regions using a three-stage stratified PPS (probability proportionate to size) sampling method. The total sample size was n = 69,360; n = 68,414 was the final valid sample. Data collection through computer-assisted personal interviews started in March 2010 and continued until October 2010. CRISP officially released the results in November 2010. In this round, the sampling methods were greatly improved compared to the previous seven surveys, not least by increasing the sample size in order to guarantee data reliability for each provincial region by using PPS sampling.
In order to take regional development into account, the 32 provincial regions were classified into four groups according to Renmin University's 2008 RCDI (RUC China Development Index) report (2008):
Category 1 (municipalities): Beijing, Shanghai, Tianjin
Category 2 (developed provinces): Zhejiang, Jiangsu, Shandong, Liaoning, Jilin, Guangdong
Category 3 (central provincial regions): Fujian, Inner Mongolia, Heilongjiang, Shanxi, Hunan, Hebei, Hubei, Henan, Hainan, Xinjiang, Bingtuan, Ningxia, Chongqing, Jiangxi, Guangxi, Shaanxi
Category 4 (developing provincial regions) Sichuan, Anhui, Qinghai, Yunnan, Gansu, Guizhou, Tibet.
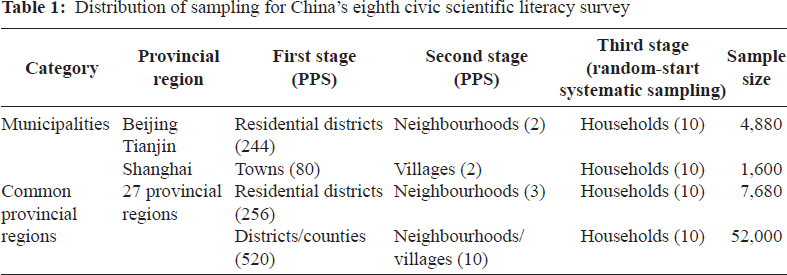
For the first category, a three-stage stratified sampling method—PPS—was directly applied. In the first stage, residential district units (towns) were selected. In the second stage, neighbourhoods (villages) were selected. In the third stage, individual households were selected, and only one respondent was selected in each household. PPS sampling was applied during the first two stages according to the population size. Random-start systematic sampling was applied for the households.
For the other categories of provincial regions (27 provincial regions, except Tibet and Bingtuan), the same strategy was applied. At the first stage, counties were selected; in the second, neighbourhoods (villages) were selected according to the population; in the third, households were selected, and each respondent was selected randomly using two-dimensional stochastic indicator tables.
Tibet and Bingtuan—were treated differently. Only Lhasa city and Shigatse city in Tibet were selected. The sampling strategy was the same as in the first category. Bingtuan has an administrative division different from other provincial regions. At the first stage, divisions were selected, then regiments and finally households. Table 1 summarizes the sample strategy for the eighth civic scientific literacy survey (Ren, 2010).
Distribution of sampling for China's eighth civic scientific literacy survey
The 2010 scientific literacy survey included several items that are relevant to the analysis of Chinese attitudes to science, including true/false knowledge items, Likert-type evaluations, measures of interest and engagement with science. To indicate ‘public attitudes to S&T’, we considered four dimensions: knowledge, interest, engagement and attitude. We included 12 knowledge items (Table A1). Respondents were asked to judge whether a statement was right or wrong and scored a point for a ‘correct’ answer. Three items examined interviewees' interest in science and science-related information (Table A2). We combined the responses ‘very interested’ and ‘moderately interested’ to indicate interest, which was scored as a binary: 1 for ‘interested’, and 0 for ‘not interested’. Four items examined people's engagement in exhibitory spaces such as science museums, science centres, zoos, aquariums, public libraries and art museums. We focused on engagement with science, including visits to science museums (or centres) and zoos (or aquariums) (Table A3). Similarly to interest, we created a binary variable: ‘visiting places’ was counted as 1, and ‘not visiting’ as 0.
Finally, 15 evaluative attitude items entered our analysis (Table A4). They were Likert items with five levels from ‘strongly disagree’ to ‘strongly agree’, and ‘don't know’. Responses were scored from 1 to 5, and ‘don't know’ was scored as 3, which was the same as for ‘neither agree nor don't agree’. Of the 15 items, four items expressed concern about or negative attitudes to science.
For the final indicator selection, an exploratory factor analysis on the attitude items was conducted; items with factor loadings lower than 0.30 were excluded. Two sets of variables were run: the first included all 15 attitude items; the second included the 15 attitude items, the knowledge score, and the binaries of interest and engagement with science. For comparison with the EU data, a confirmatory factor analysis followed up on 30 indicators that were common between the EU and China. Finally, we identified a viable four-dimensional model of attitude structure, which is the basis of our present interpretation of Chinese attitudes to science.
Findings: One size does not fit all
After a set of exploratory and confirmatory factor analysis, four dimensions of attitude structure were reliably identified based on various indicators. We use the following labels to name the four dimensions.
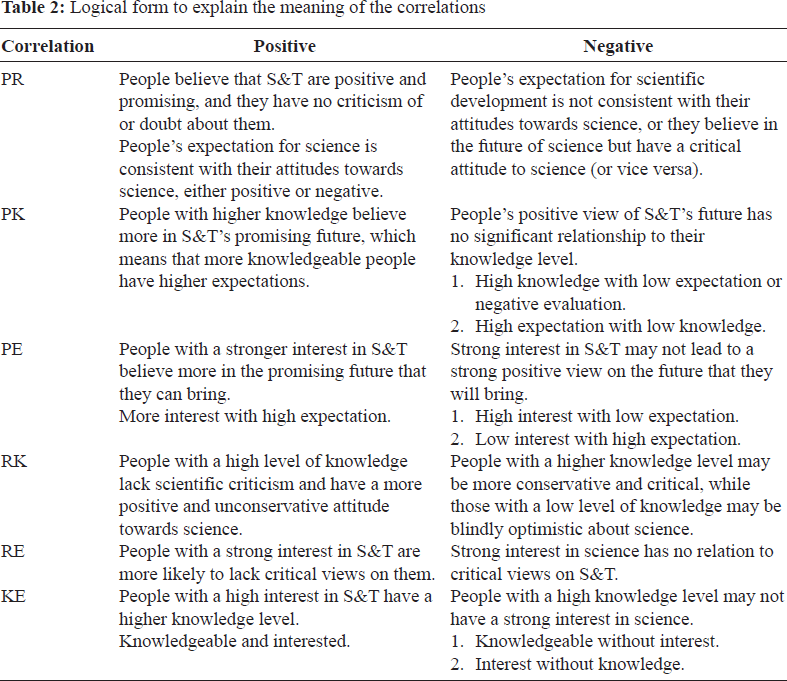
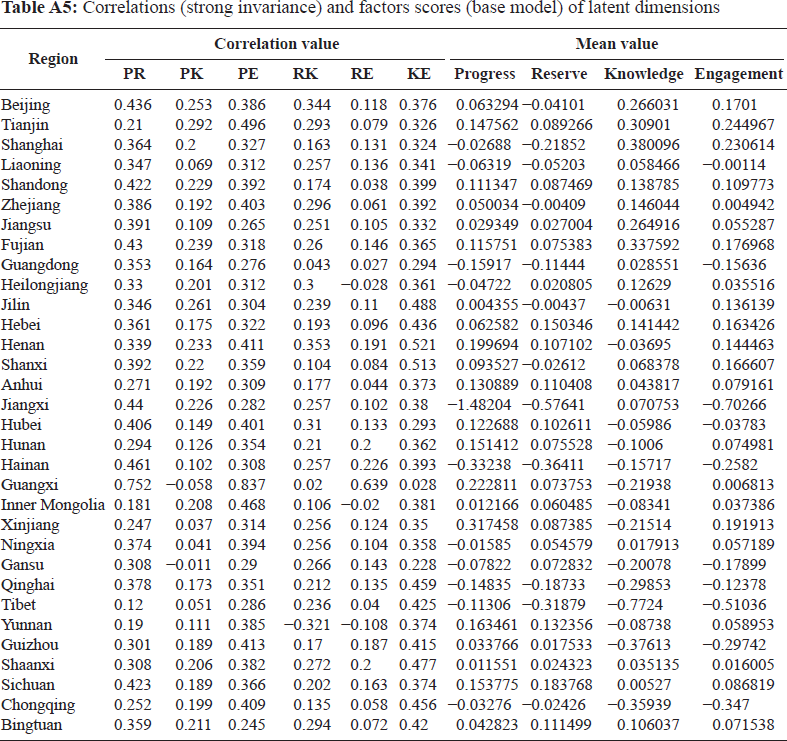
For our interpretation of science culture in China, we followed the MACAS (Mapping the Cultural Authority of Science, an Indo-European led project aims to map the cultural authority of science, and to construct a system of indicators) idea (see Bauer and Suerdem, 2016; Bauer et al., 2018) of considering correlations between the key indicators, and not the level of the indicators. On the basis of this 4D model, an intercorrelation matrix with six correlations was examined for further discussion (Table 2 and Table A5). For the positive and negative interpretation of each of these six correlations (PR, PK, PE, RK, RE, KE), we used the logical form as shown in Table 2 to explain the meaning of the relationship.
Logical form to explain the meaning of the correlations
On the basis of the correlation matrix of the 4D model, cluster analysis was conducted among the 32 provincial regions in China. Six correlations between indicators were identified, marking the science culture in each provincial region. Two regional clusters with different features of science culture emerged from the hierarchical grouping. We applied R software in this study to conduct the analysis and to visualize the results. In the end, three provincial regions were excluded as outliers: Guangxi, Yunnan and Shanghai. Two typical clusters of different science culture features were evident (Figure 1).
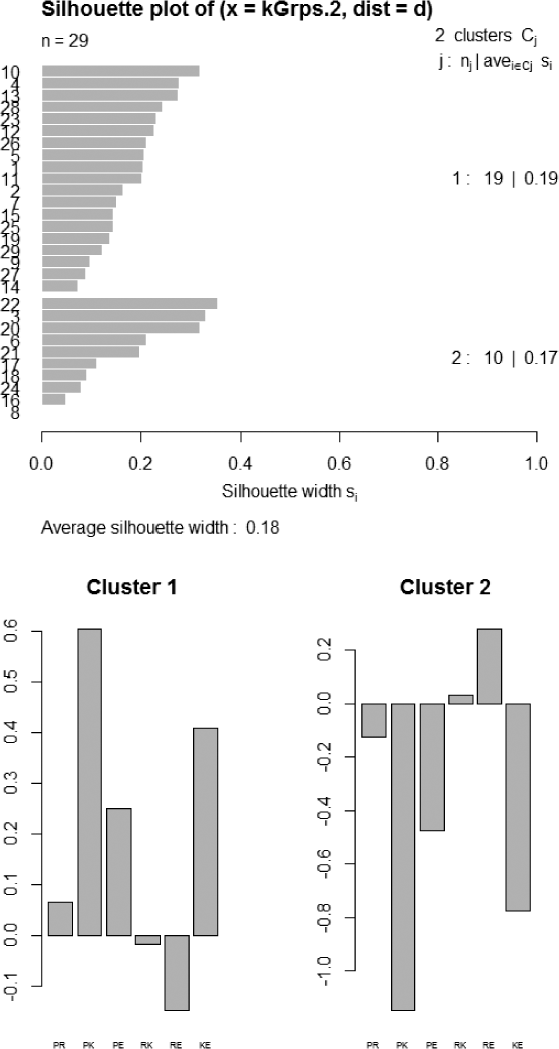
Cluster analysis results of 29 provincial regions in China
From the hierarchical cluster analysis, two clusters emerged. The two clusters showed opposite correlations among each dimension of public attitudes towards S&T. Cluster 1 shows positive and generally strong correlation of PR, PK, PE and KE, but negative correlation of RE and RK. Cluster 2 shows strong negative correlation for each correlation except RK and RE.
According to Table 2, in which we tried to interpret the logical meaning of each correlation, we can profile the following two different models of attitudes to science.
These attitudes are mainly presented in Cluster 1, including 19 provincial regions: Beijing, Tianjin, Shandong, Zhejiang, Fujian, Heilongjiang, Jilin, Hebei, Henan, Shanxi, Anhui, Jiangxi, Inner Mongolia, Qinghai, Guizhou, Shaanxi, Sichuan, Chongqing and Bingtuan.
These attitudes are mainly found in Cluster 2, including 10 provincial regions: Liaoning, Jiangsu, Guangdong, Hubei, Hunan, Hainan, Xinjiang, Ningxia, Tibet and Gansu.
Figure 2 shows the values of correlation of 29 provincial regions: the darker the colour, the stronger the correlation. Hunan Province, which is in the central part of China, has the highest value of RE. Anhui Province has the strongest PK correlation.
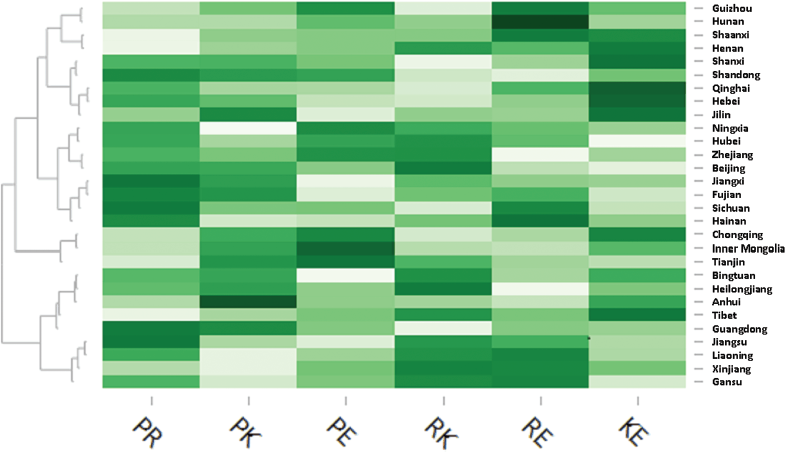
Values of correlation of 29 provincial regions in China
As to the geographical distribution of the two attitude models, Model 1 occurs mainly in the eastern and central parts of China, which are more advanced in social and economic development; Model 2 occurs mainly in the western areas, which are generally less developed.
To better understand the differences between the two attitude models, we might reflect on two different patterns of the cultural authority of science as it relates to ‘ideal’ or ‘typical’ people:
Ms Shi Lei, who is 37 years old and lives in Beijing City, is well educated and works in a national academy as a researcher. Shi represents the up-and-coming new middle class in present-day China and lives in a fully urbanized world. She may have the highest level of S&T knowledge and strong interest in science, and be generally positive about S&T developments.
Mr Liu Shandong is 56 years old, is self-employed and lives in the rural countryside of Liaoning Province (Cluster 2, Model 2). His formal education ended when he left school before his 16th birthday, and he has been working as a full-time farmer for many years. Because of opportunities for migrant workers moving into the cities, he has found a job in an urban area, where he works during the slack parts of the agricultural cycle, and returns to his rural home during the busy parts of the cycle. He has limited formal scientific knowledge, but may follow the ‘lighthouse beacon’ of the authority of science in China. He expresses a rather keen attitude towards modern science, but that keenness can border on superstitious or unreasonable expectations. At the same time, he may show little interest in scientific information or daily news, and be unlikely to take part in science culture by visiting museums and exhibitions.
Our research has shown that we need to use more than one model to describe public attitudes to science in China. With certain caveats, the lighthouse model best characterizes the cultural authority of science.
We need more than one model to characterize public attitudes to science in China
Based on the results of this study, we return to the questions raised at the start. When cooking given ingredients with a new sauce (that is, when rethinking and analysing the existing survey data), do we need general or specific indicators? Do we need a campaign guidance system, or are we to compare cultural systems in the first instance? (See Bauer, Allum and Miller, 2007; Bauer, Shukla and Allum, 2012.)
From the results of this and previous studies, the answer might be: we need both types of indicators.
The general indicator is still useful and meaningful when describing and comparing the public's attitudes to science on a macroscopic scale. Our results support the positive– negative evaluative dimensions of attitudes to science. However, general indicators are descriptors that miss specific features of local culture and concerns; they are the result of approximations for the purposes of better observability and describability.
This paper reflects the contrast between general indicators and specific indicators and shows the meaning of each of them. However, there remains an urgent and important need to develop the research on specific indicators, including the demographic factors that affect the structure of the public's attitudes to science. Since China has followed the Outline of the National Action Plan for Scientific Literacy (issued in 2006) faithfully for a decade, it might now be time to rethink the conception of ‘scientific literacy’ on a single, one-dimensional measurement model and to introduce more insights on the diversity of modern attitudes in China. That diversity includes views on the authority of science that are manifested in the patterning of knowledge, evaluations, interest and engagement with the world of science in modern life. In that sense, ‘one size does not fit all’.
The lighthouse model may best illustrate the cultural authority of science in China
For the moment, the ‘lighthouse model’—the beacon of enlightenment towering over a stormy sea of uncertain attitudes to science (see Bauer et al., 2018)—seems to be the better model to describe the cultural authority of science in China. To some extent, the Chinese Government seeks to boost S&T as part of its development strategy, and this has laid the formal foundation for the cultural authority of science. The cultural authority of science has been strengthened during the past decade, along with the political authority of science.
However, we have also noticed that when specific S&T issues are raised, such as PX (p-xylene) projects or the siting of nuclear power plants in particular neighbourhoods, the ‘bungee jump’ culture of science can occur.
Therefore, we can summarize the cultural authority of science in China as one in which the lighthouse model is the foundation, and in which ‘bungee jumps’ will occur in specific circumstances. And, last but not least, the diversity in the culture of science in China must also be considered.
Footnotes
1
This article was first published as a book chapter in 2018 by Routledge (see Bauer et al., 2018). It is reproduced with permission of the licensor through PLSclear. Necessary edits are made to make it more suitable for republication in the journal.
2
Cheng Donghong's colourful metaphor for the secondary mining of existing civic scientific literacy data was expressed over a dinner discussion at PCST (International Network on Public Communication of Science and Technology) Seoul, in April 2006: ‘We have cooked our dish [that is, PUS indicators] exclusively with sweet and sour sauce, but now let us consider cooking it with black bean sauce to discover its real flavour.’
Author biographies
Xuan Liu, PhD, is an associate professor of National Academy of Innovation Strategy, China. Her research areas include scientific culture, academic environment and innovation ecology.
Fujun Ren, Professor, is the general director of National Academy of Innovation Strategy, China. His main interests are in science communication, scientific culture and innovative culture, scientific policies, and scientific personnel.
Ahmet Süerdem is a full time professor at Istanbul Bilgi University and a senior academic visitor at the London School of Economics and Political Science (LSE). His research interests include text analysis, social network analysis, cultural and social cognition/language, analysis of policy discourses, and organizational and consumer culture.
Xiang Li, PhD, is an assistant researcher of National Academy of Innovation Strategy, China. His research interests are in science museums, scientific culture and art and science.
Martin W Bauer is a professor of the Department of Psychological and Behavioural Science at LSE. His research focus is the relationship between science and common sense through theoretical elaboration and comparative research using national surveys, mass media monitoring and also qualitative enquires.
Appendix
Correlations (strong invariance) and factors scores (base model) of latent dimensions
| Region | Correlation value |
Mean value |
||||||||
|---|---|---|---|---|---|---|---|---|---|---|
| PR | PK | PE | RK | RE | KE | Progress | Reserve | Knowledge | Engagement | |
| Beijing | 0.436 | 0.253 | 0.386 | 0.344 | 0.118 | 0.376 | 0.063294 | -0.04101 | 0.266031 | 0.1701 |
| Tianjin | 0.21 | 0.292 | 0.496 | 0.293 | 0.079 | 0.326 | 0.147562 | 0.089266 | 0.30901 | 0.244967 |
| Shanghai | 0.364 | 0.2 | 0.327 | 0.163 | 0.131 | 0.324 | -0.02688 | -0.21852 | 0.380096 | 0.230614 |
| Liaoning | 0.347 | 0.069 | 0.312 | 0.257 | 0.136 | 0.341 | -0.06319 | -0.05203 | 0.058466 | -0.00114 |
| Shandong | 0.422 | 0.229 | 0.392 | 0.174 | 0.038 | 0.399 | 0.111347 | 0.087469 | 0.138785 | 0.109773 |
| Zhejiang | 0.386 | 0.192 | 0.403 | 0.296 | 0.061 | 0.392 | 0.050034 | -0.00409 | 0.146044 | 0.004942 |
| Jiangsu | 0.391 | 0.109 | 0.265 | 0.251 | 0.105 | 0.332 | 0.029349 | 0.027004 | 0.264916 | 0.055287 |
| Fujian | 0.43 | 0.239 | 0.318 | 0.26 | 0.146 | 0.365 | 0.115751 | 0.075383 | 0.337592 | 0.176968 |
| Guangdong | 0.353 | 0.164 | 0.276 | 0.043 | 0.027 | 0.294 | -0.15917 | -0.11444 | 0.028551 | -0.15636 |
| Heilongjiang | 0.33 | 0.201 | 0.312 | 0.3 | -0.028 | 0.361 | -0.04722 | 0.020805 | 0.12629 | 0.035516 |
| Jilin | 0.346 | 0.261 | 0.304 | 0.239 | 0.11 | 0.488 | 0.004355 | -0.00437 | -0.00631 | 0.136139 |
| Hebei | 0.361 | 0.175 | 0.322 | 0.193 | 0.096 | 0.436 | 0.062582 | 0.150346 | 0.141442 | 0.163426 |
| Henan | 0.339 | 0.233 | 0.411 | 0.353 | 0.191 | 0.521 | 0.199694 | 0.107102 | -0.03695 | 0.144463 |
| Shanxi | 0.392 | 0.22 | 0.359 | 0.104 | 0.084 | 0.513 | 0.093527 | -0.02612 | 0.068378 | 0.166607 |
| Anhui | 0.271 | 0.192 | 0.309 | 0.177 | 0.044 | 0.373 | 0.130889 | 0.110408 | 0.043817 | 0.079161 |
| Jiangxi | 0.44 | 0.226 | 0.282 | 0.257 | 0.102 | 0.38 | -1.48204 | -0.57641 | 0.070753 | -0.70266 |
| Hubei | 0.406 | 0.149 | 0.401 | 0.31 | 0.133 | 0.293 | 0.122688 | 0.102611 | -0.05986 | -0.03783 |
| Hunan | 0.294 | 0.126 | 0.354 | 0.21 | 0.2 | 0.362 | 0.151412 | 0.075528 | -0.1006 | 0.074981 |
| Hainan | 0.461 | 0.102 | 0.308 | 0.257 | 0.226 | 0.393 | -0.33238 | -0.36411 | -0.15717 | -0.2582 |
| Guangxi | 0.752 | -0.058 | 0.837 | 0.02 | 0.639 | 0.028 | 0.222811 | 0.073753 | -0.21938 | 0.006813 |
| Inner Mongolia | 0.181 | 0.208 | 0.468 | 0.106 | -0.02 | 0.381 | 0.012166 | 0.060485 | -0.08341 | 0.037386 |
| Xinjiang | 0.247 | 0.037 | 0.314 | 0.256 | 0.124 | 0.35 | 0.317458 | 0.087385 | -0.21514 | 0.191913 |
| Ningxia | 0.374 | 0.041 | 0.394 | 0.256 | 0.104 | 0.358 | -0.01585 | 0.054579 | 0.017913 | 0.057189 |
| Gansu | 0.308 | -0.011 | 0.29 | 0.266 | 0.143 | 0.228 | -0.07822 | 0.072832 | -0.20078 | -0.17899 |
| Qinghai | 0.378 | 0.173 | 0.351 | 0.212 | 0.135 | 0.459 | -0.14835 | -0.18733 | -0.29853 | -0.12378 |
| Tibet | 0.12 | 0.051 | 0.286 | 0.236 | 0.04 | 0.425 | -0.11306 | -0.31879 | -0.7724 | -0.51036 |
| Yunnan | 0.19 | 0.111 | 0.385 | -0.321 | -0.108 | 0.374 | 0.163461 | 0.132356 | -0.08738 | 0.058953 |
| Guizhou | 0.301 | 0.189 | 0.413 | 0.17 | 0.187 | 0.415 | 0.033766 | 0.017533 | -0.37613 | -0.29742 |
| Shaanxi | 0.308 | 0.206 | 0.382 | 0.272 | 0.2 | 0.477 | 0.011551 | 0.024323 | 0.035135 | 0.016005 |
| Sichuan | 0.423 | 0.189 | 0.366 | 0.202 | 0.163 | 0.374 | 0.153775 | 0.183768 | 0.00527 | 0.086819 |
| Chongqing | 0.252 | 0.199 | 0.409 | 0.135 | 0.058 | 0.456 | -0.03276 | -0.02426 | -0.35939 | -0.347 |
| Bingtuan | 0.359 | 0.211 | 0.245 | 0.294 | 0.072 | 0.42 | 0.042823 | 0.111499 | 0.106037 | 0.071538 |