
Abstract
Objective:
To examine whether plasma neurofilament light (NFL) might be a potential longitudinal biomarker for Alzheimer’s disease (AD).
Methods:
A total of 835 individuals from the Alzheimer’s Disease Neuroimaging Initiative were involved. Correlations of the rate of change in plasma NFL with cerebrospinal fluid biomarkers, cognition, and brain structure were investigated. Cox proportional hazards models were used to assess the associations between quartiles of plasma NFL and the risk of AD conversion.
Results:
Participants were further divided into β amyloid-positive (Aβ+) versus β amyloid-negative (Aβ−), resulting in five biomarker group combinations, which are CN Aβ−, CN Aβ+, MCI Aβ−, MCI Aβ+ and AD Aβ+. Plasma NFL concentration markedly increased in the five groups longitudinally (p < 0.001) with the greatest rate of change in AD Aβ+ group. The rate of change in plasma NFL was associated with cognitive deficits and neuroimaging hallmarks of AD over time (p < 0.005). Compared with the bottom quartile, the top quartile of change rate was associated with a 5.41-fold increased risk of AD (95% CI = 1.83−16.01) in the multivariate model.
Conclusion:
Our finding implies the potential of plasma NFL as a longitudinal noninvasive biomarker in AD.
1 Introduction
Alzheimer’s disease (AD) is a common neurodegenerative disease which is characterized by brain accumulation of β-amyloid (Aβ) and tau, progressive atrophy, and cognitive decline [1]. Biomarkers that capture biological processes in AD are increasingly used to support the diagnosis of AD in research and clinical practice [2, 3]. The most well-established AD biomarkers include cerebrospinal fluid (CSF) biomarkers of Aβ, tau, and neurodegeneration / neuronal injury, positron emission tomographic (PET) imaging of Aβ, tau, and brain metabolism, as well as structural magnetic resonance imaging (MRI) [4 −6]. The application of these biomarkers is hampered by a high degree of invasiveness, high cost, or limited availability [7]. Therefore, there is a strong need to develop blood-based biomarkers that, when applied in a proper context of use, could serve as relative noninvasive screening tests.
Neurofilament light (NFL), a neuronal injury marker, is one of the potential blood-based biomarkers for AD [8, 9]. NFLs are neuron-specific heteropolymers that act as key structural components of the neuronal cytoskeleton and are mostly expressed in large-caliber myelinated axons [10]. Axonal damage leads to the release of NFL molecules into the extracellular space and consequently into body fluids, including CSF and plasma [11]. In line with this, increased blood NFL concentrations were reported in neurodegenerative and neuro-inflammatory disorders [12, 13], including AD [1, 14]. Previous studies have validated that baseline plasma NFL concentration is increased in AD patients [11, 15] and it correlates with impaired cognition, neuroimaging abnormalities, and CSF biomarkers of AD pathologic features [16]. These evidences suggest that plasma NFL might be a promising peripheral biomarker for AD. However, this analysis was based on the baseline concentration of plasma NFL. A recent study analyzed the longitudinal change in serum NFL and found that it predicted neurodegeneration and clinical progression in presymptomatic familial AD [17]. However, studies using NFL in plasma as a longitudinal noninvasive proxy for neurodegeneration in sporadic AD are rare.
Herein, based on the longitudinal data gathered from the Alzheimer’s Disease Neuroimaging Initiative (ADNI) prospective cohort, we calculated the rate of change in plasma NFL and tested the hypothesis that it correlates with cognitive, biochemical, and imaging hallmarks of AD.
2 Materials and methods
2.1 Participants
Data used in the preparation for this article were obtained from the ADNI database (http://adniloni.usc.edu) [18, 19], which was led by Principal Investigator Michael W. Weiner, MD. ADNI is a multisite longitudinal biomarker study that to date has enrolled over 1,800 cognitively normal (CN), amnestic mild cognitive impairment (MCI), and AD individuals, aged from 55 to 90 years old. Participants received baseline and periodic physical and neurological examinations as well as standardized neuropsychological assessments, and provided biological samples (blood, urine, CSF, etc.) throughout the study. Imaging (MRI and PET) is performed at baseline and at regular intervals thereafter. Informed consent was obtained from study participants, and the study was approved by the local institutional review board at each participating site. Our study population consisted of all CN, MCI, and AD dementia participants with available plasma NFL, CSF biomarker, cognitive and imaging data. Inclusion and exclusion criteria are described in detail online (http://www.adni-info.org).
2.2 Plasma NFL
Plasma NFL was examined by the Single Molecule array (Simoa) technique. The assay uses a combination of monoclonal antibodies, and purified bovine NFL as a calibrator. All samples were measured in duplicate. Analytical sensitivity was < 1.0 pg/mL. Values are presented as pg/mL. Further information about the methods can be found at adni.loni.usc.edu.
2.3 CSF measurements
CSF was sampled by lumbar puncture from a subset of participants, with CSF Aβ, CSF total tau (T-tau), and CSF phosphorylated tau (P-tau) measured using a multiplex platform (xMAP; Luminex Corporation) with a kit (INNO-BIA AlzBio3; Fujirebio Europe).
2.4 Cognition
Cognition was assessed by Mini-Mental State Examination (MMSE), Clinical Dementia Rating Sum of Boxes (CDRSB) and Alzheimer Disease Assessment Scale-cognitive subscale (ADAS-cog 11 and 13). All tests were administered at baseline and follow-up.
2.5 Neuroimaging
Structural brain images were acquired using 1.5-T MRI imaging system with T1-weighted MRI scans using a sagittal volumetric magnetizationprepared rapid acquisition gradient-echo sequence. A software program (FreeSurfer; https://surfer.nmr.mgh.harvard.edu/) was used for quantification of cortical thickness and subcortical volumes. We used volumetric data for entorhinal cortex (EC) thickness and hippocampal volume (HV).
2.6 Statistical analysis
Based on the cut-off threshold of CSF Aβ [15, 20], we dichotomized the population, resulting in five different biomarker group combinations, including CN Aβ− (CN−), CN Aβ+ (CN+), MCI Aβ− (MCI−), MCI Aβ+ (MCI+) and AD Aβ+ (AD+). Tests of inter-group differences were performed using one-way analysis of variance and post-hoc analysis. Categorical variables are presented as number (percentage); continuous variables as mean ± standard deviation (SD). The longitudinal rate of change in plasma NFL, CSF biomarkers, cognition and brain structure were calculated by linear mixed-effects models. Associations between rate of change in plasma NFL and CSF biomarkers / subsequent disease progression (measured by MMSE, CDRSB, ADAS-cog scores, EC thickness and HV atrophy) were tested using linear mixedeffects models adjusted for age and sex (and educational level for cognitive measurements, and intracranial volume for volume measurements). All outcome variables in linear mixed-effects models were log-transformed to facilitate comparisons between modalities. Baseline plasma NFL and rate of change in plasma NFL were quartered. Kaplan-Meier analysis with log-rank test to determine the progression from CN to prodromal AD (defined as CDRSB score ≥ 0.5) and that from MCI to AD were performed. Time to event was defined as time from baseline CN to prodromal AD and that from MCI to AD onset (with end of study time or dropout as censoring). Multi-adjusted Cox proportional hazard regression models adjusted for age, sex and educational level and additional adjustment for APOE ε4 status were performed. We also calculated diagnostic accuracies using area under the receiver operating characteristic curve (AUROC) analysis with 10-fold cross-validated logistic regression models.
All tests were 2-sided and statistical significance was set at p < 0.05. All statistical analyses were performed using a software program (R, version 3.5.1) and IBM SPSS Statistics 23.
3 Results
The present analysis involved 835 participants, including 178 CN−, 113 CN+, 168 MCI−, 290 MCI+, and 86 AD+ individuals. Characteristics of participants in the final data set are presented in Table 1 (female percentage: 45.9%; age: 72.53 ± 7.02 years old; years of education: 16.23 ± 2.66; and percentage of APOE ε4 positive: 43.5%). At baseline, high plasma NFL levels were associated with lower CSF Aβ (Spearman correlation β = −0.295, p < 0.001), elevated CSF P-tau (β = 0.210, p < 0.001), higher CSF T-tau (β = 0.254, p < 0.001), worse performances on MMSE (β = −0.228, p < 0.001), ADAS-cog 11 (β = 0.315, p < 0.001), ADAS-cog 13 (β = 0.340, p < 0.001) and CDRSB (β = 0.234, p < 0.001), smaller hippocampal volume (β = −0.388, p < 0.001), and thinner EC thickness (β = −0.272, p < 0.001).
Basic characteristics of population included
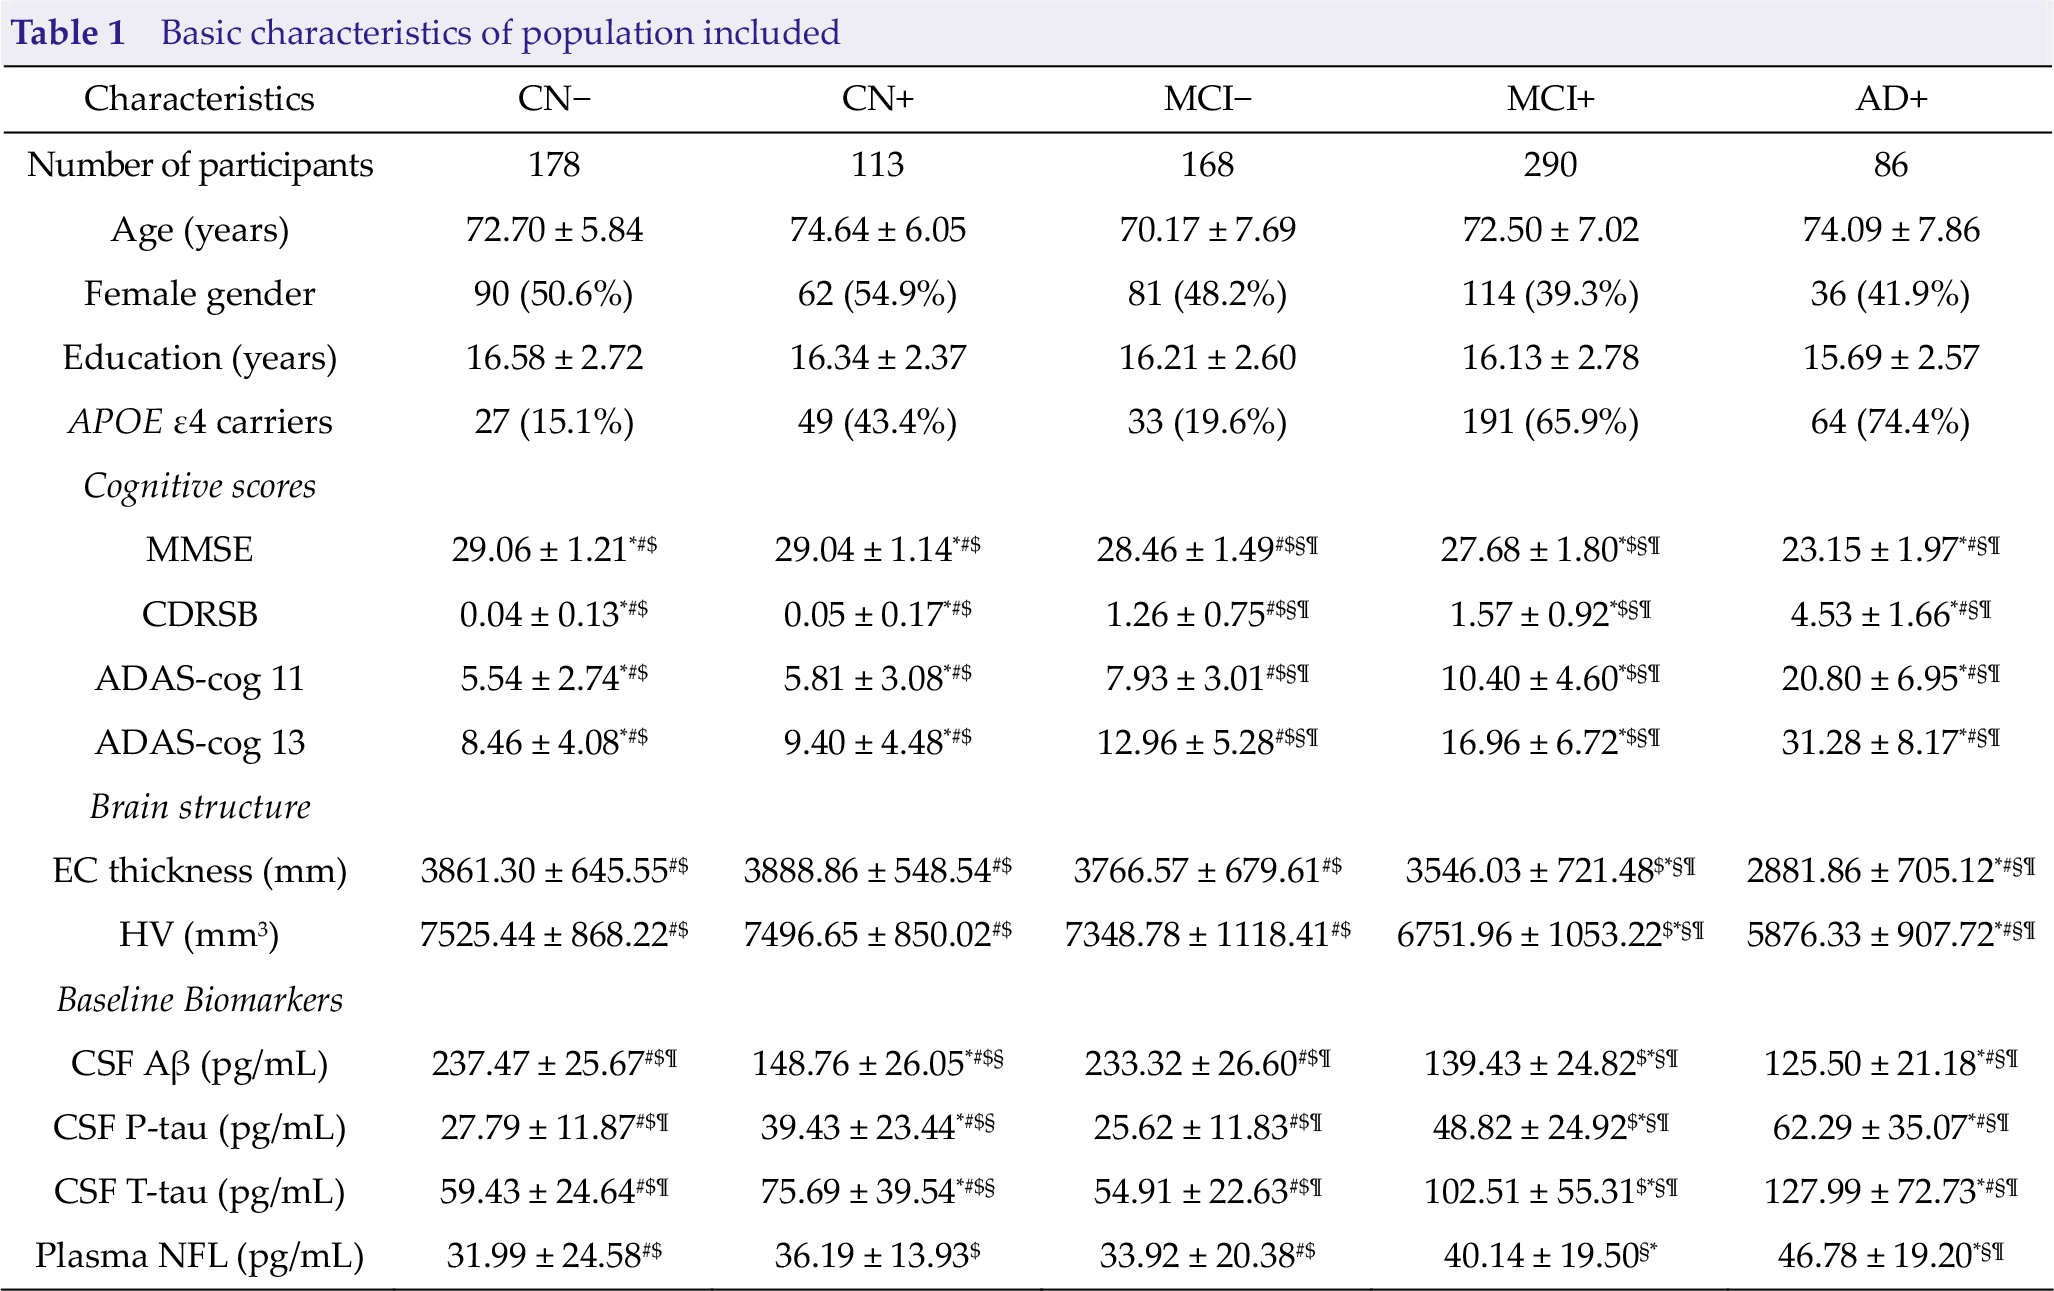
Values are n (%) or mean ± SD.
CN, cognitively normal; MCI, mild cognitive impairment; AD, Alzheimer’s disease;
*, significantly different from MCI−; #, significantly different from MCI+; $, significantly different from AD+; §, significantly different from CN−; ¶, significantly different from CN+.
3.1 Baseline concentration and annual change of plasma NFL
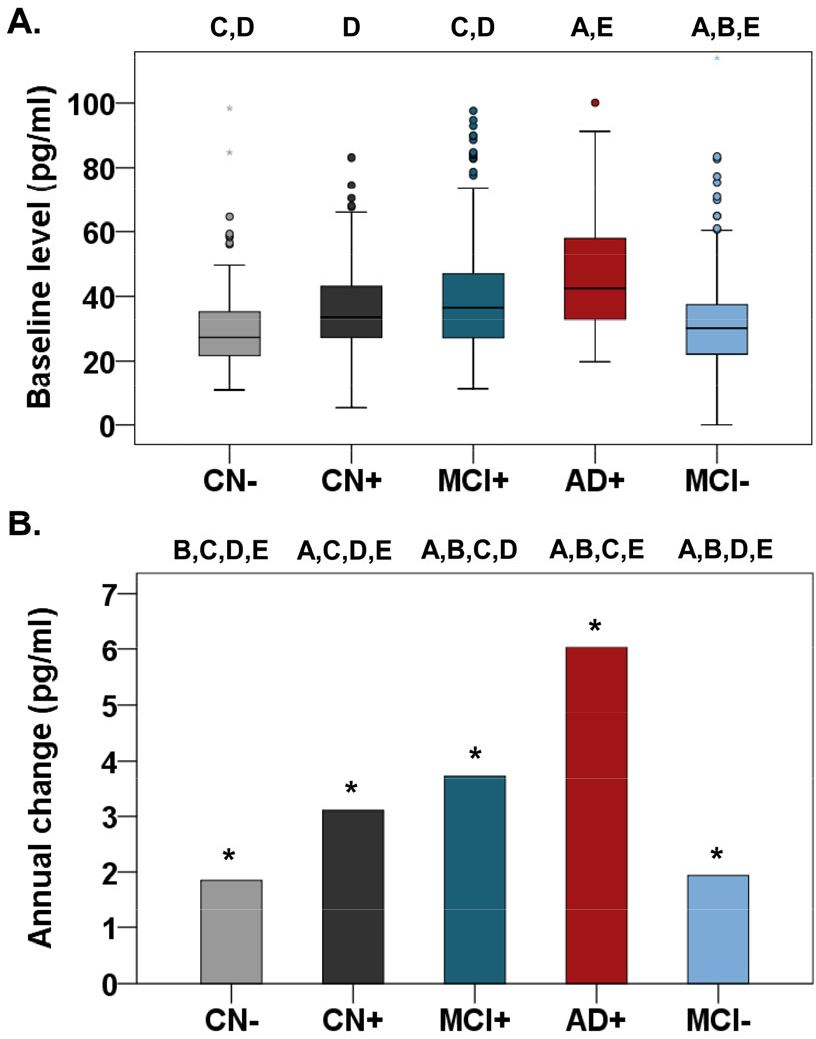
Baseline levels of plasma NFL were significantly higher in the AD+ group than in the CN− (p < 0.001), CN+ (p = 0.003), and MCI− (p < 0.001) groups, but not than in the MCI+ group (p = 0.065) (Fig. 1; Table 1). Levels were also higher in theMCI+ compared with that in the CN− (p < 0.001) and MCI− (p = 0.014) groups. Longitudinally, plasma NFL markedly increased in the five groups (all p < 0.001) with the highest change rate in the AD+ group (Fig. 1; Table 2).
Estimated with-person annual change of parameters over time
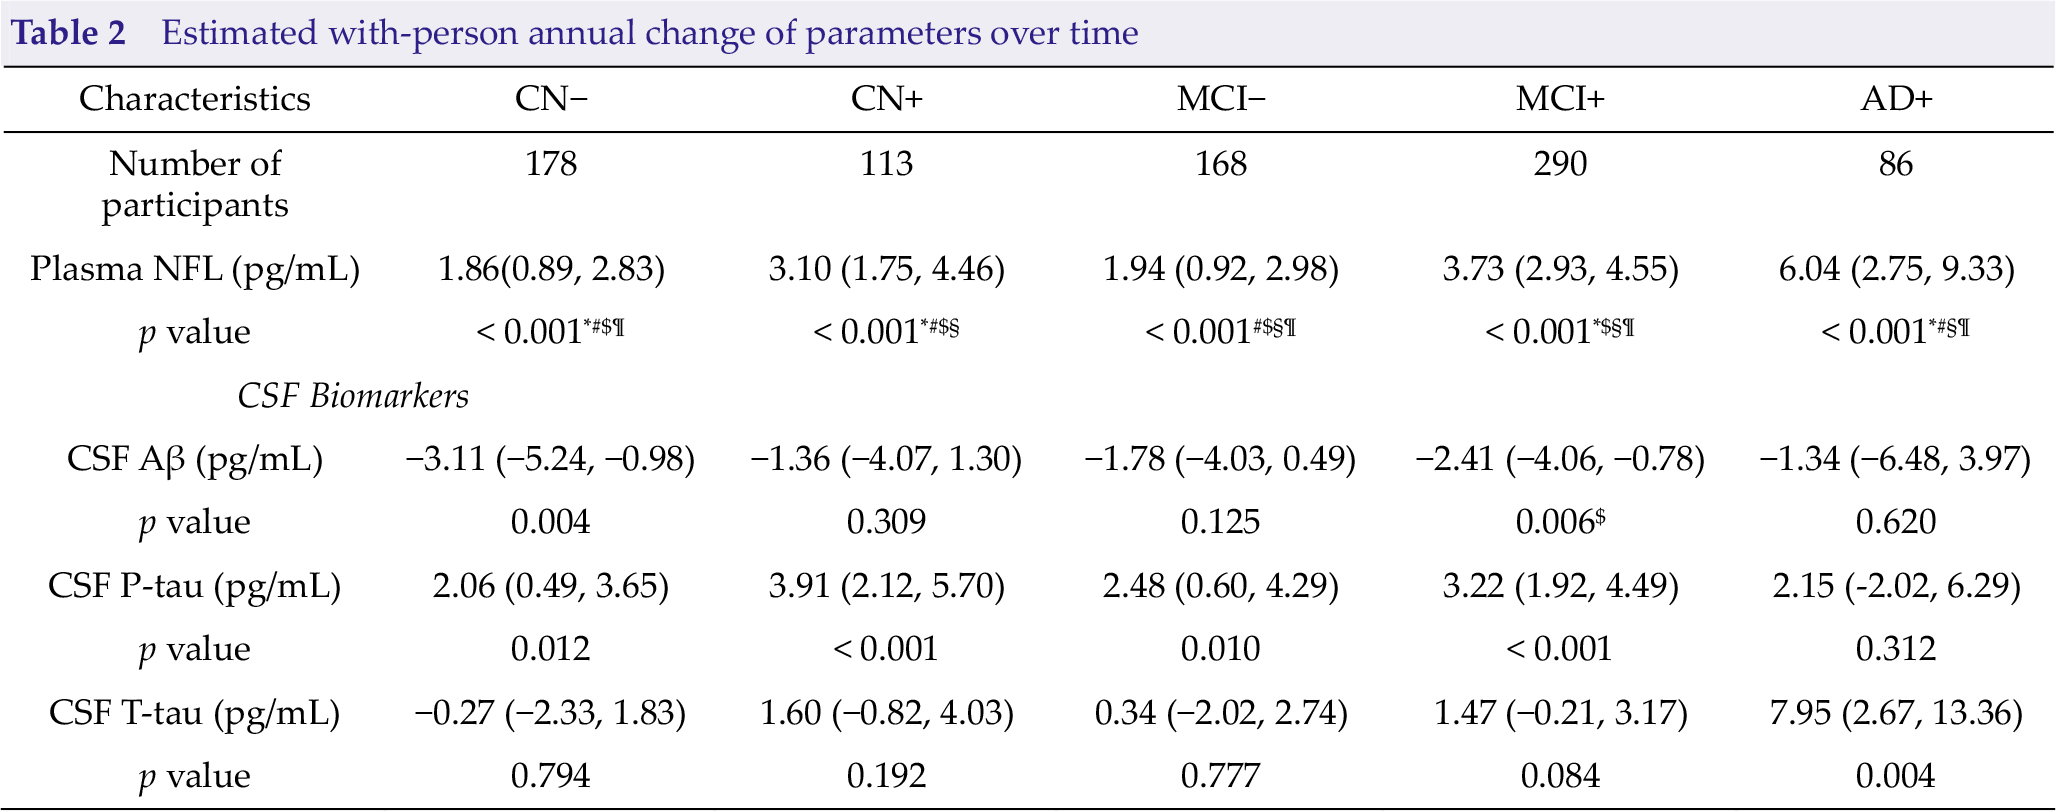
Values are mean with 95% confidence interval; Bold fonts represent statistically significant. *, significantly different from MCI
3.2 Rate of change in plasma NFL and longitudinal changes in CSF biomarkers, cognition and brain structure
Without taking diagnostic categories into consideration, rate of change in plasma NFL highly significantly correlated with all cognitive scales (estimate = −0.79, p < 0.001 for MMSE; estimate = 0.74, p < 0.001 for CDRSB; estimate = 1.75, p < 0.001 for ADAS-cog 11; and estimate = 2.01, p < 0.001 for ADAS-cog 13) and brain structure (estimate = −91.84, p = 0.003 for EC thickness and estimate = −92.22, p = 0.003 for HV) other than CSF biomarkers (Table 3). Moreover, statistically significant longitudinal correlations were found for the CN− group and MMSE (estimate = −0.40, p = 0.037), CDRSB score (estimate = 0.29, p = 0.034), ADAS-cog 11 (estimate = 1.01, p = 0.032), and EC thickness (estimate = −232.60, p = 0.003); for the MCI− group and CDRSB score (estimate = 0.71, p < 0.001), ADAS-cog 13 (estimate = 1.34, p = 0.023), and HV (estimate = −121.70, p = 0.024); for MCI+ group and MMSE (estimate = −1.32, p < 0.001), CDRSB (estimate = 1.02, p < 0.001), ADAS-cog 11 (estimate = 2.50, p < 0.001), ADAS-cog 13 (estimate = 3.03, p < 0.001), EC thickness (estimate = −118.20, p = 0.002), and HV (estimate = −138.10, p = 0.002); as well as for the AD+ group and CDRSB score (estimate = 2.74, p = 0.004) and ADAS-cog 13 (estimate = 7.03, p = 0.038; Table S1).
Correlations between log-transformed rate of change in plasma NFL and longitudinal changes in biochemical markers
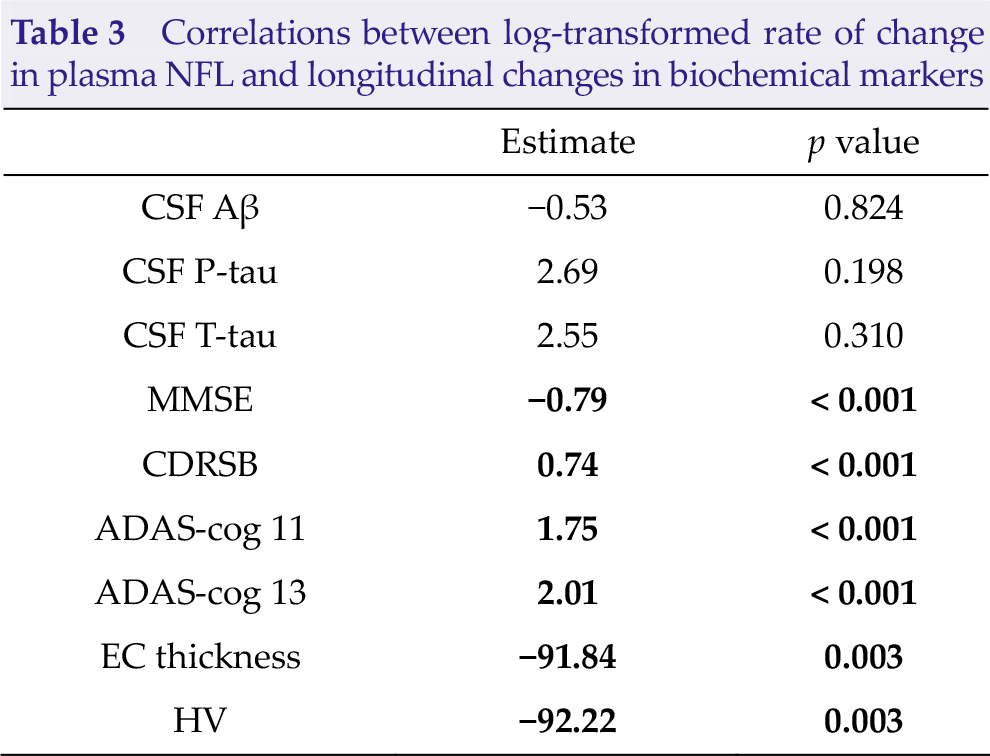
Bold fonts represent statistically significant. CSF, cerebrospinal fluid; Aβ, β-Amyloid; P-tau, phosphorylated-tau; T-tau, total tau; MMSE, Mini-Mental State Examination; CDRSB, Clinical Dementia Rating Sum of Boxes; ADAS-cog 11, Alzheimer’s Disease Assessment Scale 11; ADAS-cog 13, Alzheimer’s Disease Assessment Scale 13; EC, entorhinal cortex; HV, hippocampal volume.
3.3 Plasma NFL in quartiles and risk of CN-toprodromal AD conversion
Compared with the lowest quartile of baseline plasma NFL, the highest quartile was associated with a 4.72-fold increased risk of CN-to-prodromal AD conversion (95% confidence interval, CI = 1.55−14.41; Table S2 and Fig. S1). The risk was quite smaller after additional adjustment for APOE ε4 (hazard ratio, HR, 3.92; 95% CI = 1.29−11.87). The second and the third quartiles of plasma NFL were not associated with increased risk. However, we failed to detect any correlations between the rate of change in NFL quartiles and the risk of CN-to-prodromal AD conversion.
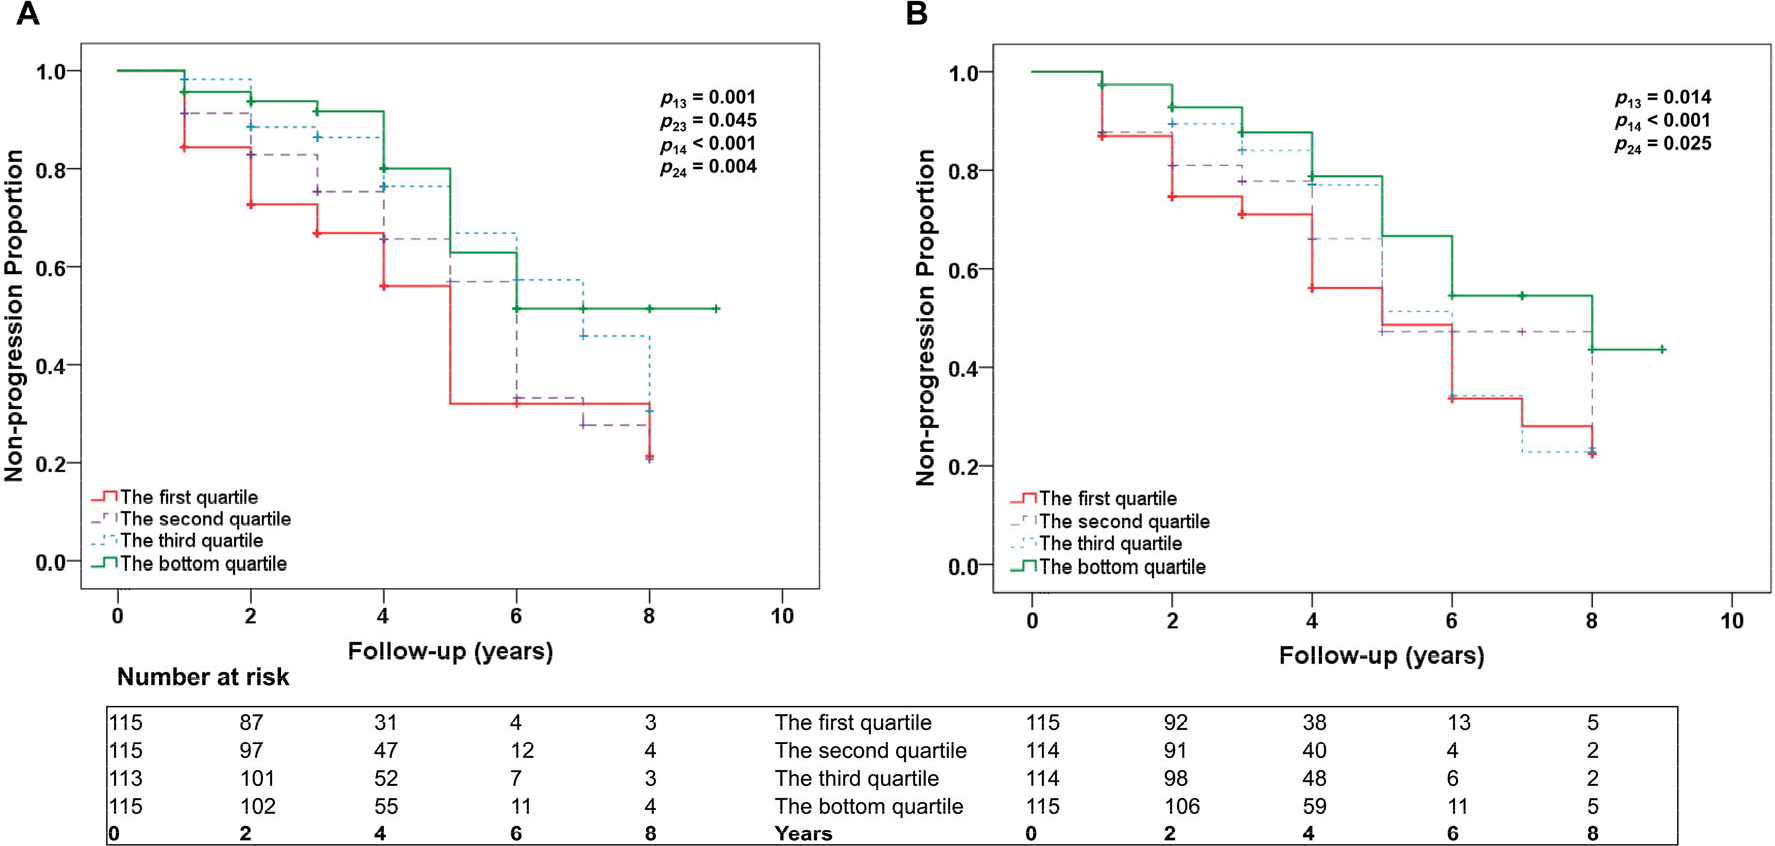
3.4 Plasma NFL in quartiles and risk of MCI-to-AD conversion
Elevated plasma NFL levels were associated with increased risk of MCI-to-AD conversion (quartile 1 vs. 4: HR, 6.64; 95% CI = 2.22–19.83; quartile 2 vs. 4: HR, 5.81; 95% CI = 1.97−17.15; Table 4 and Fig. 2). After additional adjustment for APOE ε4, this association was still significant for quartile 1 vs. 4 (HR, 6.45; 95% CI = 2.07−20.11) and quartile 2 vs. 4 (HR, 6.08; 95% CI = 2.03−18.17).
Baseline and rate of change in plasma NFL in quartiles and risk of MCI-to-AD conversion
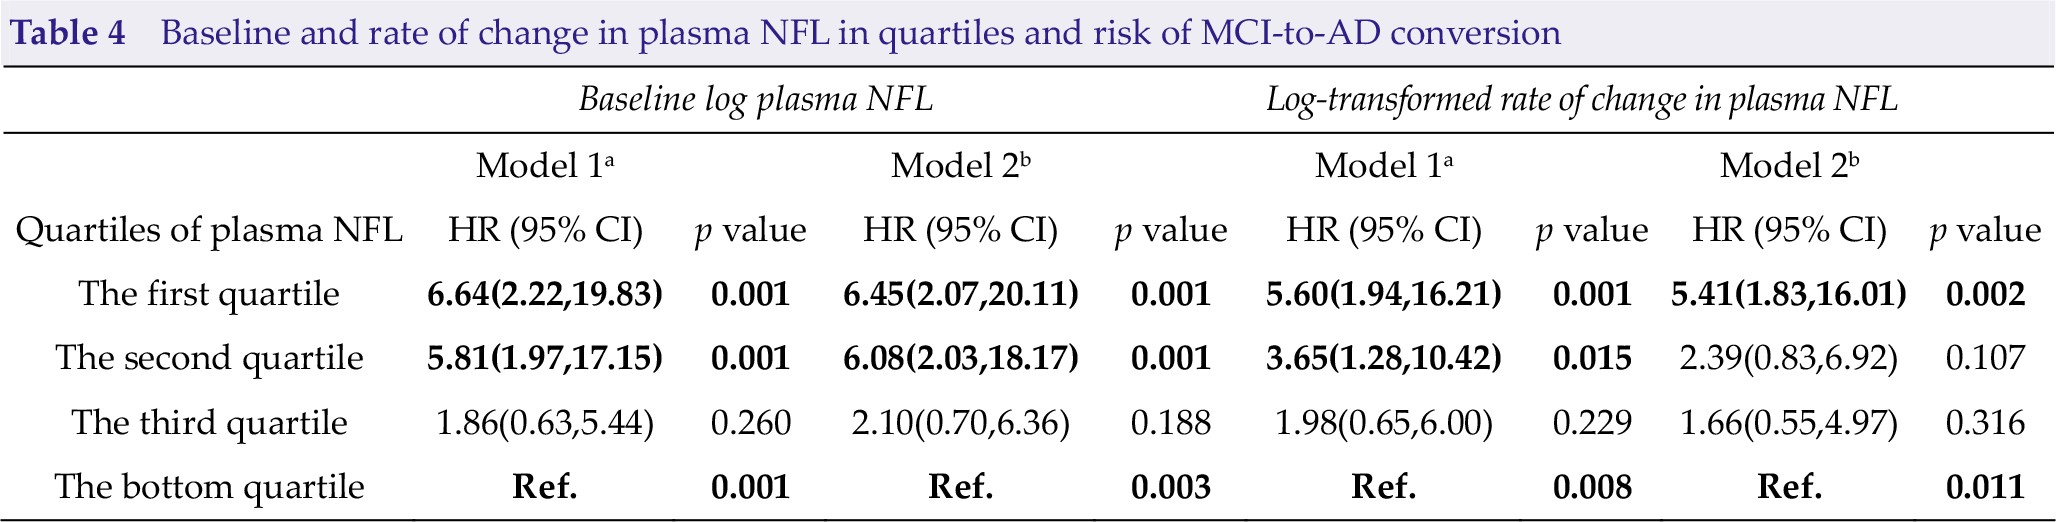
a Model 1 with age, sex and educational level as covariates.
b Model 2 with age, sex, educational level and APOE ε4 status as covariates.
Abbreviations: NFL, neurofilament light; HR, hazard ratio; CI, confidence interval.
Bold fonts represent statistically significant.
The highest quartile of rate of change in plasma NFL was associated with a 5.60-fold increased risk of AD (95% CI = 1.94−16.21) compared with the bottom quartile after adjusting for age, sex, and education (Table 4; Fig. 2). This association remained significant after additional adjustment for APOE ε4 (HR, 5.41; 95% CI = 1.83−16.01). However, after adjustment for APOE ε4, the association of the second quartile compared with the lowest quartile was not significant (before adjustment HR, 3.65; 95% CI = 1.28−10.42; after adjustment HR, 2.39; 95% CI = 0.83−6.92).
3.5 The effects of plasma NFL on diagnostic accuracy
Baseline plasma NFL was differentiated between the AD dementia group and controls, with an AUROC of 0.841 (Fig. S2). However, the rate of change in plasma NFL had an AUROC of 0.806. By comparison, the AUROCs ranged from 0.875 to 0.922 for CSF P-tau, T-tau, and Aβ. These AUROCs were corrected for age, sex, educational level, and APOE ε4 genotype.
4 Discussion
We discovered that baseline plasma NFL concentration was significantly higher in the AD Aβ+ group and it markedly increased longitudinally. We also corroborated that higher rates of change in plasma NFL (1) were correlated with cognitive deficits and neuroimaging hallmarks of AD over time, (2) were strongly associated with the risk of MCI-to-AD conversion, and (3) had diagnostic accuracy for AD dementia in the same range as established CSF biomarkers.
Plasma NFL markedly increased in all of the five groups with the highest rate of change in the AD Aβ+ group, which implied that plasma NFL increment was a cumulative effect of neurodegeneration and it occurs throughout the process. Our study also discovered that both of the baseline concentration and rate of change in plasma NFL correlated with several cognitive and imaging AD hallmarks at baseline and over time. In detail, plasma NFL was associated with general cognition (MMSE, ADAS-cog and CDRSB scores) at baseline as well as with decline over time. For imaging measures, associations of NFL were identified with EC thickness and hippocampal volume. The rate of change in NFL had more significant correlations with all the measures except hippocampal volume, compared with baseline level of NFL, suggesting that longitudinal change might be a better predictor of cognitive decline and brain atrophy related with AD. More significant correlations were detected in the MCI Aβ+ and AD Aβ+ groups, especially for the cognitive scales. This result was in line with the recently published opinion that plasma NFL correlated with cognitive decline and brain atrophy, which was independent of Aβ pathology [21]. The baseline associations with CSF biomarkers (CSF Aβ, P-tau, and T-tau levels) replicated previous findings, which showed that baseline plasma NFL correlated with lower CSF Aβ, elevated CSF P-tau and higher CSF T-tau levels in the whole cohort [16]. However, we failed to observe significant correlations of plasma NFL with CSF biomarkers for AD pathology longitudinally. No positive relationship between NFL rate of change and the rate of change in CSF core biomarkers for AD were investigated in our study. This finding probably reflects the notion that several different pathologic conditions are present in AD (e.g., Aβ, tau, and degeneration of different types of axons) and drive different biomarker responses, which will be weakly correlated overall. As we all know, the pathological processes in AD begin more than two decades before the onset of clinical symptoms. The correlations might be confounded by clinical diagnosis owing to that each single clinical stage has special pathological changes. This result may also indicate that NFL changes in the blood most closely reflect clinical phenotypes rather than pathological phenotypes of AD. Moreover, future longitudinal studies with longer follow-up duration are in command to clarify the true underlying associations.
Previous studies showed that higher CSF NFL levels were associated with higher risk of MCI among cognitively intact individuals [22] and a shorter survival among patients with AD dementia [23], suggesting that CSF NFL is a marker of clinical progression. We are the first to find that NFL in plasma could also predict disease progression by showing that both higher baseline plasma NFL level and elevated change rate are also strongly associated with risk of MCI-to-AD conversion and higher baseline plasma NFL level could also predict CN-to-prodromal AD conversion. The result showed that both CSF and peripheral NFL were predictors of disease progression. However, the predicting efficacy of the two biomarkers needs to be compared based on high-quality sample with long follow-up duration.
In agreement with recently published studies on sporadic AD [11, 16, 24] and familial AD [25] we found increased plasma NFL concentrations in AD+ patients as well as in MCI subjects compared with non-demented controls. The results of the current study confirm those reported by Mattsson et al. in terms of the NFL performance as a potential plasma diagnostic test [16]. In both studies, almost identical areas under the ROC curves, contrasting AD patients versus nondemented controls, were obtained (0.84 and 0.87, respectively). Furthermore, we also detected the potential diagnostic accuracy of the rate of change in plasma NFL, which was shown to have an AUROC of 0.806. To our knowledge, it is the first time that a peripheral, noninvasive biomarker for neurodegeneration showed diagnostic accuracy for AD dementia compared with established CSF biomarkers.
Taken together, these findings support that plasma NFL is a promising biomarker for neurodegeneration in AD, which may have potential for prognosis and monitoring of disease progression. However, increased plasma NFL concentration has also been found in several other neurodegenerative disorders, such as progressive supranuclear palsy [26], frontotemporal dementia [13], Huntington’s disease [12], Parkinson’s disease [27], and human immunodeficiency virus with brain engagement [28], implying that it lacks disease specificity for AD. Therefore, we do not envision that plasma NFL can be used as a tool to differentiate AD from other neurodegenerative diseases. Rather, it may be valuable as a general biomarker for neurodegeneration.
Our analysis is a longitudinal analysis of plasma NFL data, including the calculation of the change rate of NFL, the correlation of the rate of change in NFL with cognition and brain structure, the effect of the rate of change in NFL in the diagnosis of AD from controls, and the predictive value in disease progression, all of which makes the value of plasma NFL more comprehensive in the diagnosis and prognosis of AD. However, it still requires high-quality research with large samples to replicate the results. Perhaps the most important limitation of our study is the relatively small, age-unmatched groups, which we tried to counterbalance by controlling for age in all statistical analyses. Secondly, when divided into five groups, the small sample may limit statistical power to detect longitudinal changes, especially in the preclinical and early symptomatic AD groups. A larger age span should also be included in future work because it is possible that vascular comorbidities may change with age and alter the diagnostic accuracy of plasma NFL for patients with AD vs. controls.
5 Conclusion
Taken together, our findings suggest that plasma NFL is a valuable biomarker of neurodegeneration but not specific for AD pathobiology. We speculate that plasma NFL will not be able to replace the CSF biomarkers of neurodegeneration within a given diagnostic group, but it could perhaps be considered as a potential convenient longitudinal screening tool.
Supplemental Material
Supplemental Material, BSA0011_Supplemantary_Material - Plasma neurofilament light as a longitudinal biomarker of neurodegeneration in Alzheimer’s disease
Supplemental Material, BSA0011_Supplemantary_Material for Plasma neurofilament light as a longitudinal biomarker of neurodegeneration in Alzheimer’s disease by Ya-Nan Ou, Hao Hu, Zuo-Teng Wang, Wei Xu, Lan Tan, Jin-Tai Yu and Alzheimer’s Disease Neuroimaging Initiative in Brain Science Advances
Footnotes
Acknowledgements
Data collection and sharing for this project was funded by the Alzheimer’s Disease Neuroimaging Initiative (ADNI) (National Institutes of Health Grant U01 AG024904) and DOD ADNI (Department of Defense award number W81XWH-12-2-0012). ADNI is funded by the National Institute on Aging, the National Institute of Biomedical Imaging and Bioengineering, and through generous contributions from the following: AbbVie, Alzheimer’s Association; Alzheimer’s Drug Discovery Foundation; Araclon Biotech; BioClinica, Inc.; Biogen; Bristol-Myers Squibb Company; CereSpir, Inc.; Cogstate; Eisai Inc.; Elan Pharmaceuticals, Inc.; Eli Lilly and Company; EuroImmun; F. Hoffmann-La Roche Ltd and its affiliated company Genentech, Inc.; Fujirebio; GE Healthcare; IXICO Ltd.; Janssen Alzheimer Immunotherapy Research & Development, LLC.; Johnson & Johnson Pharmaceutical Research & Development LLC.; Lumosity; Lundbeck; Merck & Co., Inc.; Meso Scale Diagnostics, LLC.; NeuroRx Research; Neurotrack Technologies; Novartis Pharmaceuticals Corporation; Pfizer Inc.; Piramal Imaging; Servier; Takeda Pharmaceutical Company; and Transition Therapeutics. The Canadian Institutes of Health Research is providing funds to support ADNI clinical sites in Canada. Private sector contributions are facilitated by the Foundation for the National Institutes of Health (![]() ). The grantee organization is the Northern California Institute for Research and Education, and the study is coordinated by the Alzheimer’s Therapeutic Research Institute at the University of Southern California. ADNI data are disseminated by the Laboratory for Neuro Imaging at the University of Southern California.
). The grantee organization is the Northern California Institute for Research and Education, and the study is coordinated by the Alzheimer’s Therapeutic Research Institute at the University of Southern California. ADNI data are disseminated by the Laboratory for Neuro Imaging at the University of Southern California.
Author contributions
JTY conceptualized the study, analyzed and interpreted the data, and drafted and revised the manuscript. YNO, ZTW, HH analyzed and interpreted the data, drafted and revised the manuscript, did the statistical analysis, and prepared all the figures. WX and LT interpretation of the data and revision of the manuscript. All authors contributed to the writing and revision of the paper and approved the final version. Data used in preparation of this article were obtained from the Alzheimer’s Disease Neuroimaging Initiative (ADNI) database (adni.loni.usc.edu). As such, the investigators within the ADNI contributed to the design and implementation of ADNI and/or provided data but did not participate in analysis or writing of this report. A complete listing of ADNI investigators can be found at: ![]() .
.
Conflict of interests
The authors declare no potential conflicts of interest with respect to the research, authorship, and/or publication of this article.
Financial supports
This study was supported by grants from the National Natural Science Foundation of China (91849126), the National Key R&D Program of China (2018YFC1314700), Shanghai Municipal Science and Technology Major Project (No. 2018SHZDZX01) and ZHANGJIANG LAB, Tianqiao and Chrissy Chen Institute, and the State Key Laboratory of Neurobiology and Frontiers Center for Brain Science of Ministry of Education, Fudan University.
References
Supplementary Material
Please find the following supplemental material available below.
For Open Access articles published under a Creative Commons License, all supplemental material carries the same license as the article it is associated with.
For non-Open Access articles published, all supplemental material carries a non-exclusive license, and permission requests for re-use of supplemental material or any part of supplemental material shall be sent directly to the copyright owner as specified in the copyright notice associated with the article.