
Abstract
This paper proposes a “small” contextual analysis approach to big data and reports our experimental application of this approach in evaluating the effects of social distancing on focused subpopulations in U.S. society. We recognize the common and critical limitations of big data, especially the unrepresentativeness and the unpublished methodology of accessible datasets. Our proposed methodological approach is built upon recent works on data ontology, especially the recognition that big data are essentially remaining digital footprints of human life in need of additional data of contextual factors for valid and meaningful interpretation. It guides the selection and processing of big data to make big data small and structured and thus articulable with traditional social sciences data and usable to conventional social sciences methods. In our experimental case study, we apply our sampling strategy developed from traditional social science data to Google’s mobility dataset for our analysis using primarily a Difference In Difference (DID) model. The results of this case study are of timely value to policy evaluation and public decision-making in the pandemic. We call for more proactive methodological innovations that confront the critical limitations of accessible big data especially in times of urgent needs.
Keywords
Introduction
The ongoing COVID-19 pandemic has been a physical as well as intellectual challenge to all, including big data analysts and social science researchers. On the one hand, for its well-recognized volume, velocity and variety, big data has been ever more used than before for urgent needs, such as social contact tracing, public health surveillance, and public policy making. But that doesn’t mean data scientists have solved the various legal, ethical and methodological problems of big data overnight. On the other hand, social scientists have their knowledge and expertise in doing research and informing policymaking but find themselves in challenging positions: with their traditional research data mostly from before the pandemic, their on-site fieldwork method of data collection multilaterally risky during the pandemic, and their inexperience with big data or concerns with popular big data analytics methods. Facing multiple challenges as such, we propose a small contextual analysis approach to big data use by integrating traditional social science data and methods. This approach also helps to avoid unnecessarily overloading researchers’ cognitive capacity with big but often incomplete, unrepresentative and messy data.
In this paper we first reflect upon fundamental methodological questions of big data, including the often incompleteness, unrepresentativeness and unpublished methodology of accessible big datasets. We draw inspiration from recent critical data studies on data ontology, especially the recognition that big data are essentially remaining digital footprints of human life in need of additional data of contextual factors for valid and meaningful interpretation. Inspired by recent pioneering studies (e.g. Poorthuis and Zook, 2017; Rivers, 2007), we propose a small analysis approach that integrates big data and traditional social science data for analysis using conventional social sciences methods. We apply this experimental approach in our demonstrative case study that evaluates the effects of the social distancing policy on focused subpopulations in U.S. society. This case study integrates selected anonymous smartphone-based mobility big data and traditional social sciences data for our use. We use conventional social science methods, primarily a Difference In Difference (DID) model, to analyze the selected and articulated big data and traditional data. Guided by this small analysis approach, our case study thus applies temporal and geospatial foci in our selection of Google’s mobility big dataset and then interpret the selected big data with traditional data of contextual factors to evaluate the effects of social distancing in the U.S. in this pandemic.
The following section of this paper discusses methodological challenges in big data use since before the pandemic and also existing research on social distancing in the pandemic, and describes our proposed small contextual analysis approach to big data. The third section introduces the datasets as well as the data processing and analysis methods used in our case study. The fourth section presents the findings of our case study. The last section highlights the timely value of our case study findings and our proposed small contextual analysis approach.
Related works and small analysis approach
Big data has been widely mobilized to inform human responses to the COVID-19 pandemic (Coudin et al., 2021; Kraemer et al., 2020; Oliver et al., 2020; Ting et al., 2020), including mobility data on the effects of social distancing (Benzell et al., 2021; Cacciapaglia et al., 2020; Gao et al., 2020a, 2020b). However, methodologies of data generating, processing and structuring are often “black boxed” for personal privacy and tech giants’ corporate profit if not more reasons (Pasquale, 2015; Poom et al., 2020). Facing the lack of data access, data representativeness, and methodological transparency, scholars call for the tech giants’ data sharing and methodological transparency and researchers’ methodological innovation and responsible practice (Buckee, 2020; Ienca and Vayena, 2020; Lazer et al., 2021; Poom et al., 2020; Sheng et al., 2021; Zhou et al., 2020). We agree that the personal privacy of big data is of paramount importance and we acknowledge that the tech giants’ priority of corporate secrecy and profit over social good in their data publishing won’t be solved immediately. Therefore, we take a proactive position to explore a feasible methodology that would meet the urgent need of baseline knowledge for public decision-making such as in this pandemic.
Our experimental approach is built upon critical data studies (Dalton and Thatcher, 2014; Iliadis and Russo, 2016; Kitchin and Lauriault, 2014; Zhang et al., 2021), especially recent works of epistemological redefinition of big data (Lazer et al., 2021; Zhang et al., 2018) and integration or corroboration of multi-sourced datasets (Huang et al., 2021; Pokhriyal and Jacques, 2017; Rivers, 2007; Yang et al., 2021). We use Google’s dataset but don’t take it as comprehensive or conclusive (Elish and Boyd, 2018). We first return to the fundamental debates on data ontology (Kitchin and Lauriault, 2014; Kitchin and McArdle, 2016), including warnings about big data reducing people into sensors and human life into decontextualized behavior (Sieber and Tenney, 2018). On this ground, we take big data (generated by users and sensors installed in people’s everyday life) as remaining “digital footprints” or “behavioral traces” of human living that fortunately survive and become available for researchers to use (Akoumianakis et al., 2012; Lazer et al., 2021; Thatcher, 2014; Zhang et al., 2018). Such big data are thus different in nature from traditional science data generated in laboratory or fieldwork: however big they are in volume, they are often incomplete in scope, unrepresentative in meaning, and messy in structure. With similar understandings of data ontology, pioneering attempts have been made to explore more reliable and meaningful use of big data, such as using sample matching for data integration (Rivers, 2007), cross validation between mobile data, environmental data, and census data (Pokhriyal and Jacques, 2017), combination of mobility big data and customer preference surveys (Benzell et al., 2021), and contextual interpretation of big data with ethnographic data (Zhang et al., 2018).
We are inspired by these pioneers in corroborative analysis and contextual interpretation of big data and we aim to extend these efforts by integrating the “making big data small (MBDS)” strategy (Poorthuis and Zook, 2017) extensively toward what we call “small” analysis of big data. The MBDS strategy was designed and tested for researchers to more efficiently use big data, including those who are interested in big data but reluctant to build data science skills. This strategy is not just an expedient solution by “smalling” or downsizing the amount of data. It selectively extracts the only or most relevant data from big datasets for social science use within traditional methodological frameworks. We thus elaborate the MBDS strategy to make big data small, slow, simple, and structured. In our case study, small analysis is realized by using traditional census data to contextualize and interpret the selected Google community mobility data. As health behaviors are often associated with demographic and socioeconomic characteristics, collecting comprehensive public health information solely through individual users’ mobile devices would be difficult and unnecessary. It would be difficult if possible at all due to technological, legal, and ethical challenges if not more. It is unnecessary because broad demographic and socioeconomic data are already available from traditional data sources at least for community or higher level social science research if not for individual tracking. Therefore, data construction and processing for a health behavior evaluation as in our case study here will be more practical and productive through adding data from existing sources, such as census data, than using only mobility big data. The traditional census data are often “smaller” in size and “less” in the updating frequency (i.e. “slower”) than the “big” Google community mobility data. But such data can better cope with the inherent incompleteness of big data in representing the demographic characteristics and broader social-economic context of the described population and thus help to analyze selected big data in valid and meaningful ways, for example comparative analysis and contextual interpretation as demonstrated in our case study. There have been early calls for or attempts at similarly motivated methodological innovations (Pokhriyal and Jacques, 2017; Poorthuis and Zook, 2017; Rivers, 2007). Among them, Coudin et al. (2021) proposed a methodological framework of combining mobile phone data with traditional population statistics to investigate population movements and economic recovery during and after the COVID-19 pandemic. This paper takes one step further to apply our proposed methodology to timely and meaningful case study on social distancing.
There have been reports of the effects of social distancing on human mobility change and infection containment (Benzell et al., 2021). However, little has been done to empirically evaluate the effects of this policy on different subgroups of a society, except a few studies on partisan differences in the U.S. (Gollwitzer et al., 2020; Graham et al., 2020) and results of model-based simulation (e.g. Brauner et al., 2021; Chang et al., 2021). Meanwhile, unfortunately, social media and police have targeted at racial/ethnic minorities in the U.S. for suspected disproportionate noncompliance (Durkin, 2020). Early reports have warned of the vulnerability of essential workers and race/ethnic minorities in this pandemic especially in the U.S. (The, 2020; U.S. CDC, 2020). In response to such alarming developments and warnings, our case study focuses on occupation and race/ethnicity as two key socioeconomic factors in mobility behavior change under social distancing.
We hypothesize that mobility behavior change in response to social distancing varies between different subpopulations in U.S. society. More specifically, U.S. counties with high percentages of essential workers have less change in workplace-related mobility, regardless of their race/ethnicity; but counties with higher percentages of racial/ethnic minorities often have concentrations of essential workforce. To test our hypotheses, we use primarily a Difference in Difference (DID) model for data analysis. The essential idea of a DID model is to compare an outcome variable between the treatment and control groups, before and after an intervention (the social distancing policy here) is implemented. The DID model is particularly useful in evaluating the policy outcomes between test groups defined by more than one dimension of difference (occupation and race/ethnicity here). We expect to clarify the associations between the focused key socioeconomic factors and mobility behavior changes under social distancing and to produce research findings of timely value to public decision-making especially for the more vulnerable subpopulations.
Case study data and methods
Our small analysis approach guides the selection and processing of both big data and traditional data to make them articulable and thus ready for conventional social science methodology. We use a threshold-based selection of census data and apply the county selections (i.e. sampling) to Google mobility data. We then aggregate the originally individual level census data and Google mobility data both to the same geographical-administrative level, that is, county level. After such sampling and processing, the Google mobility big data becomes smaller but structured and compatible with traditional census data for our use. To clarify, the specific strategy of data selection, sampling, processing and analysis (including our DID model) described here is deployed for this particular case study. It is meant to demonstrate the potential of our proposed small analysis approach, but certainly not the only or the best strategy for implementing this approach in future research.
Mobility data
The increasing popularity of GPS-enabled smartphones has facilitated our daily life with a variety of location-based services, and also enables the analyses of individual behaviors and collective activities. In response to COVID-19, major mobile technology companies, including Google, Apple, and Foursquare, have aggregated data on human mobility to shed light on social distancing and essential services access. Here we use Google’s Community Mobility Reports at county level to show human mobility trends. Starting from March 1st, 2020, Google published daily reports to chart movement trends over time by geography, across different categories of places such as retail and recreation, groceries and pharmacies, parks, transit stations, workplaces, and residential. Each category of places is grouped together based on similar characteristics, which are defined in Google Maps (2020) This study relies on two categories of places, workplace and residence. We extract data of the days right before and right after the installation of social distancing in respective counties to build the baseline for comparison. For each reported date, mobility is calculated as a positive or negative percentage compared to the baseline day, which is the median mobility value from the 5-week period between January 3–February 6, 2020.
This dataset we use is no exception to the critical concerns discussed earlier, especially data representativeness and methodology transparency. To generate the report, individual smartphone holders’ mobility data have been aggregated and anonymized to avoid any personally identifiable information. With older adults, less educated, lower income, and minorities’ lower rates of smartphone ownership (Pew Research Center, 2019), this dataset may not properly represent these marginalized populations (McMillan Cottom, 2020; Taylor, 2020) who are particularly vulnerable to COVID-19. It is also worth noting that the original data to support the report are from users who have opted-in to the Location History setting for the Google Account in their smartphones, as Google claimed (2020). We do not seek to somehow fill such gaps, or assume the google mobility data and the census data perfectly match with each other at individual level; instead, we articulate the selected human mobility data with census data as socio-economic contextual factors at county level to help minimize the effects of suspected gaps and to produce more valid and useful results.
ACS and occupational data
One traditional dataset that we use comes from the 2018 American Community Survey ACS (Ruggles et al., 2021), which provides nationally representative data on demographic and socioeconomic characteristics of individual residents. The ACS is a nationwide survey conducted by the U.S. Census Bureau. Every year, the ACS surveys demographic and socioeconomic information of individual members in approximately 3.5 million households, which constitute a nationally representative sample. Since 2000, it has replaced the long-form census and has been conducted annually. This study uses the 2018 5-year ACS dataset which is the most recent ACS dataset available to the public and contains approximately 6 million people across the U.S. In the ACS, individuals are asked for information on basic demographic characteristics (such as age, gender, race, ethnicity, and immigration status), socioeconomic characteristics (such as employment, occupation, education, and health insurance coverage), and geographic information (state and county). For our analysis, we aggregate anonymized individual-level ACS data to county level. Specifically, we count the number of residents who are racial/ethnic minorities (African-American, Asian, native American, and Hispanic) and calculate the proportion of minorities in the county population. Thanks to ACS’s sampling method and large sample size, there are sufficient observations in each county in our aggregated data.
The 2018 ACS dataset is merged with the list of Labor Market Institute’s essential job categories which are summarized based on the Bureau of Labor Statistics’ Standard Occupational Classification codes (U.S. CDC, 2021). We count the number of workers who are in essential occupations based on the U.S. Bureau of Labor Statistics’ Standard Occupational Classification (SOC) codes, and then calculate the proportion of essential workers in the county’s workforce. The classification of essential workers is based on The Essential Critical Infrastructure Workers Guidance published by the Cybersecurity and Infrastructure Security Agency, a standalone federal agency under the oversight of the Department of Homeland Security in the U.S. This guidance defines which types of occupations are considered essential. This guidance is confirmed by the U.S. Center for Disease Control and Prevention for research purposes (U.S. CDC, 2021), and the list of occupations that are considered essential can be downloaded from the CDC website: https://www.cdc.gov/niosh/topics/coding/essentialworkers/default.html.
We then calculate racial/ethnic composition and essential workforce proportion in each county’s population. Hence, we are able to classify counties as those with relatively higher or lower proportions of essential workers.
Using these aggregated county-level statistics, we determine the distributions of the proportion of minorities and the proportion of essential workers among U.S. counties, based on which we identify the treatment group (i.e. counties with a minority group that consists of at least 25% of the county population, and in the top 10 percentile in the distribution of proportions of the essential workforce). Controlling for geographic locations, all four minority groups (African, Hispanic, Asian and native Americans) are significantly more likely to be essential workers. Specifically, African Americans are 6.14% (95% CI: 5.64%–6.65%), Hispanics are 6.27% (95% CI: 4.99%–7.54%), Asians are 1.24% (95% CI: 0.30%–2.18%), and native Americans are 1.85% (95% CI: 0.79%–2.91%) more likely to be employed in the essential workforce compared to white Americans. Moreover, minority essential workers are less likely to receive employee benefits. Within the essential workforce, with the exception of Asians, African Americans are 4.72% (95% CI: 4.07%–5.38%), Hispanics are 15.14% (95% CI: 13.68%–16.59%), and native Americans are 8.86% (95% CI: 6.28%–11.44%) less likely to have health insurance coverage.
Data analysis methods
Guided by the proposed small contextual analysis approach, this case study uses conventional analysis methods. Specifically, we use descriptive statistics, regression analysis, and most importantly, the Difference-in-difference (DID) method. DID is a classical social science method for estimating the effect of a particular policy intervention, or “treatment” (here, social distancing) on an outcome (here, human mobility change) between two groups for comparison. This is accomplished by comparing the average change over time in outcomes for the treatment group compared to outcomes for the control group. In this study, the two groups for comparison are the group of counties with relatively higher or lower proportions of essential workers, and the focused treatment or intervention is the social distancing policy, the timing of which varied by county or state in the U.S. More specifically, a county is included in the treatment group (43 counties) if it (i) has a minority group (African-American, Hispanic, native, or Asian) that consists of at least 25% of the county population, and (ii) is in the top 10 percentile in the distribution of proportions of the essential workforce. We restrict control group counties (53 counties) to those in the bottom 10 percentile in the distribution of proportions of the essential workforce. Hence, in our DID model, the first two dimensions of difference are: racial/ethnic composition; and the proportion of the essential workforce. With the timing of the policy as another dimension of difference, the DID model compares workplace-related and residence-related mobility changes after the beginning of social distancing between the treatment and control counties. We conduct robustness tests to evaluate if our DID model is robust to changes to sampling, that is, the thresholds used to select treatment and control counties, do not drive the results.
Formally, in our analysis, the DID model is defined based on the following regression:
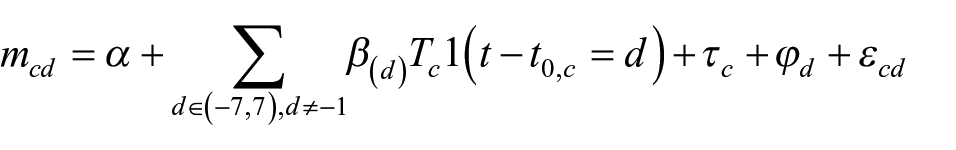
Where c indexes county, and d indexes the day before and after the implementation of social distancing policies.
The key assumption behind the DID analysis is that the treatment and control groups should be comparable and follow parallel trends in the outcome in the absence of the treatment. In other words, we need to assume that treatment counties and control counties would have similar trends in mobility changes without the implementation of social distancing policies. Assuming that two groups of counties are comparable, one can then argue that the observed effects on mobility changes are mainly due to social distancing policies. An indirect way to assess this assumption is to observe day-wise estimates of coefficients in the pre-policy period (i.e.
Case study findings
We start with simple but revealing statistical evidence from New York City (NYC) to inform our DID and regression analyses. NYC’s different counties and different subpopulations suffered from, and responded to, the pandemic in different ways, as shown in Table 1. Note that the third column shows only the difference in workplace-related mobility change after the implementation of social distancing by county. For this time period, its observations include all consecutive seven-day average mobility changes (averages from day 1 to day 7, day 2 to day 8, etc.), and the standard deviation is calculated based on the variation in these consecutive observations of 7-day mobility changes. Among NYC’s five counties, the Bronx has the highest proportion of minorities and unfortunately also the highest COVID-19 infection rates. Mobility data shows that the Bronx has the second lowest workplace-related mobility change, second to Staten Island. Staten Island, which has the highest proportion of non-Hispanic white Americans among the five counties, has also had very high infection rates. A critical factor shared by these two counties is the high percentage of essential workers compared to other counties. In contrast, Manhattan, with its high proportion of non-Hispanic whites but smallest proportion of essential workers, has had the highest workplace-related mobility change and the lowest infection rates among the five counties. The comparison between these counties disproves the racist accusation of social distancing incompliance and highlights essential workers’ need to travel more to their work despite the social distancing policies.
Mobility change and demography in NYC by county in the pandemic.
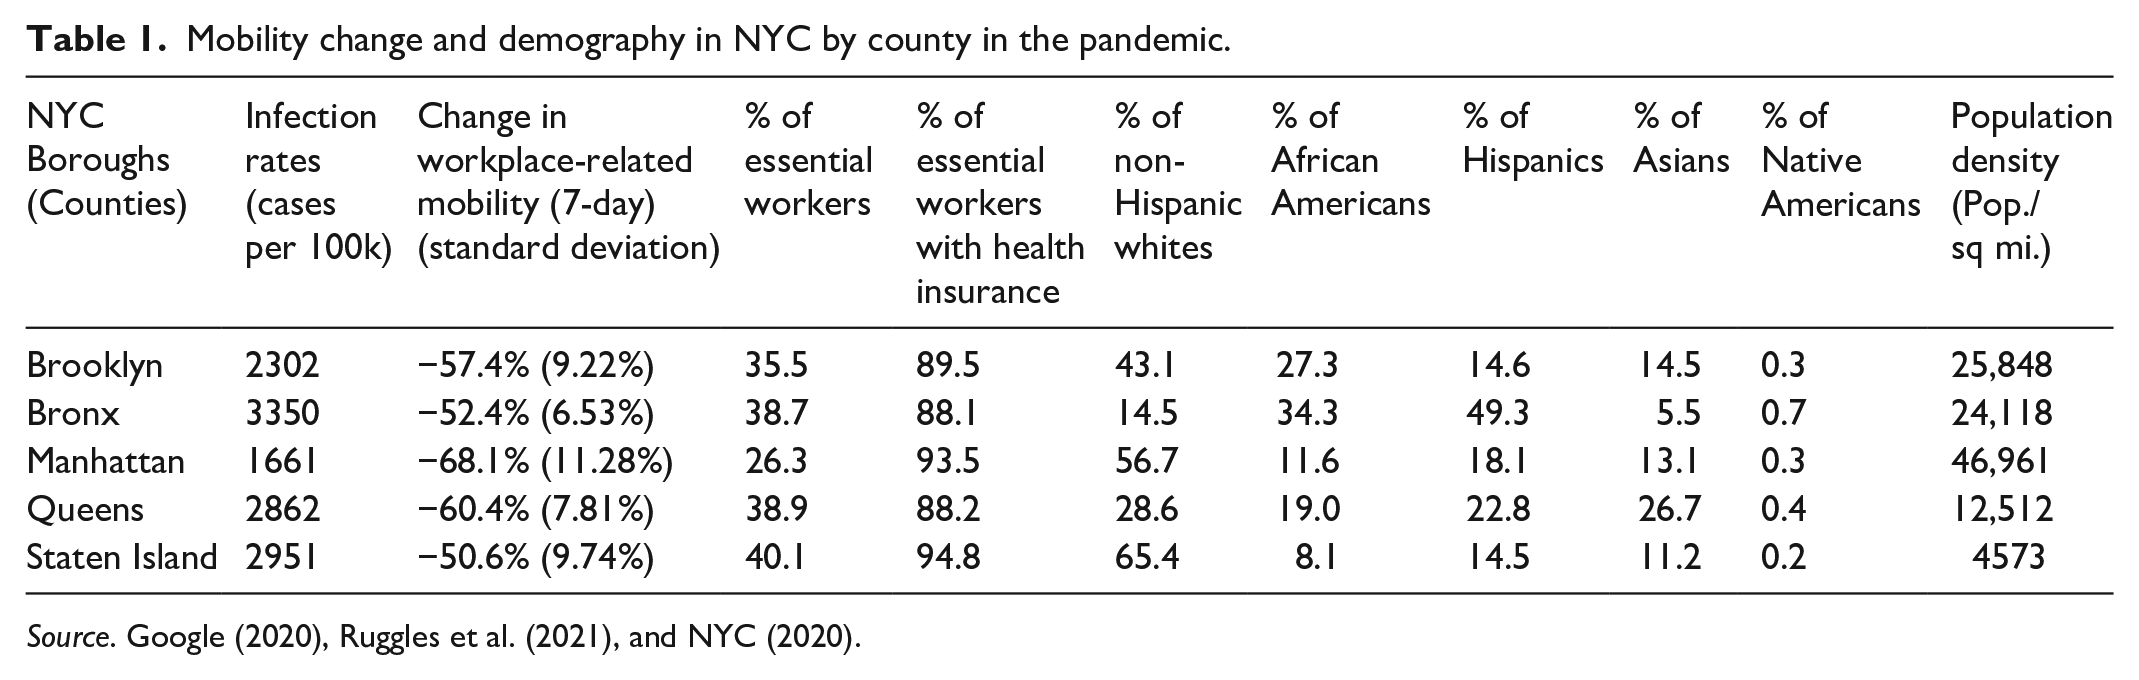
Source. Google (2020), Ruggles et al. (2021), and NYC (2020).
Much beyond that, Figure 1(a) presents our DID estimates of the effects of social distancing on workplace-related and residence-related mobility. Coefficients in the pre-policy period appear to be statistically insignificant, suggesting that counties with high proportions of minority populations and essential workforce follow similar trends in the relative change in the two types of mobility. After social distancing started, counties with high proportions of minorities and essential workforce appear to have higher workplace-related mobility and lower residence-related mobility, suggesting that social distancing has weaker effects in the treatment counties. This finding highlights the public health concern that counties with greater proportions of minorities would experience greater difficulty in social distancing and containing COVID-19 (Millett et al., 2020).
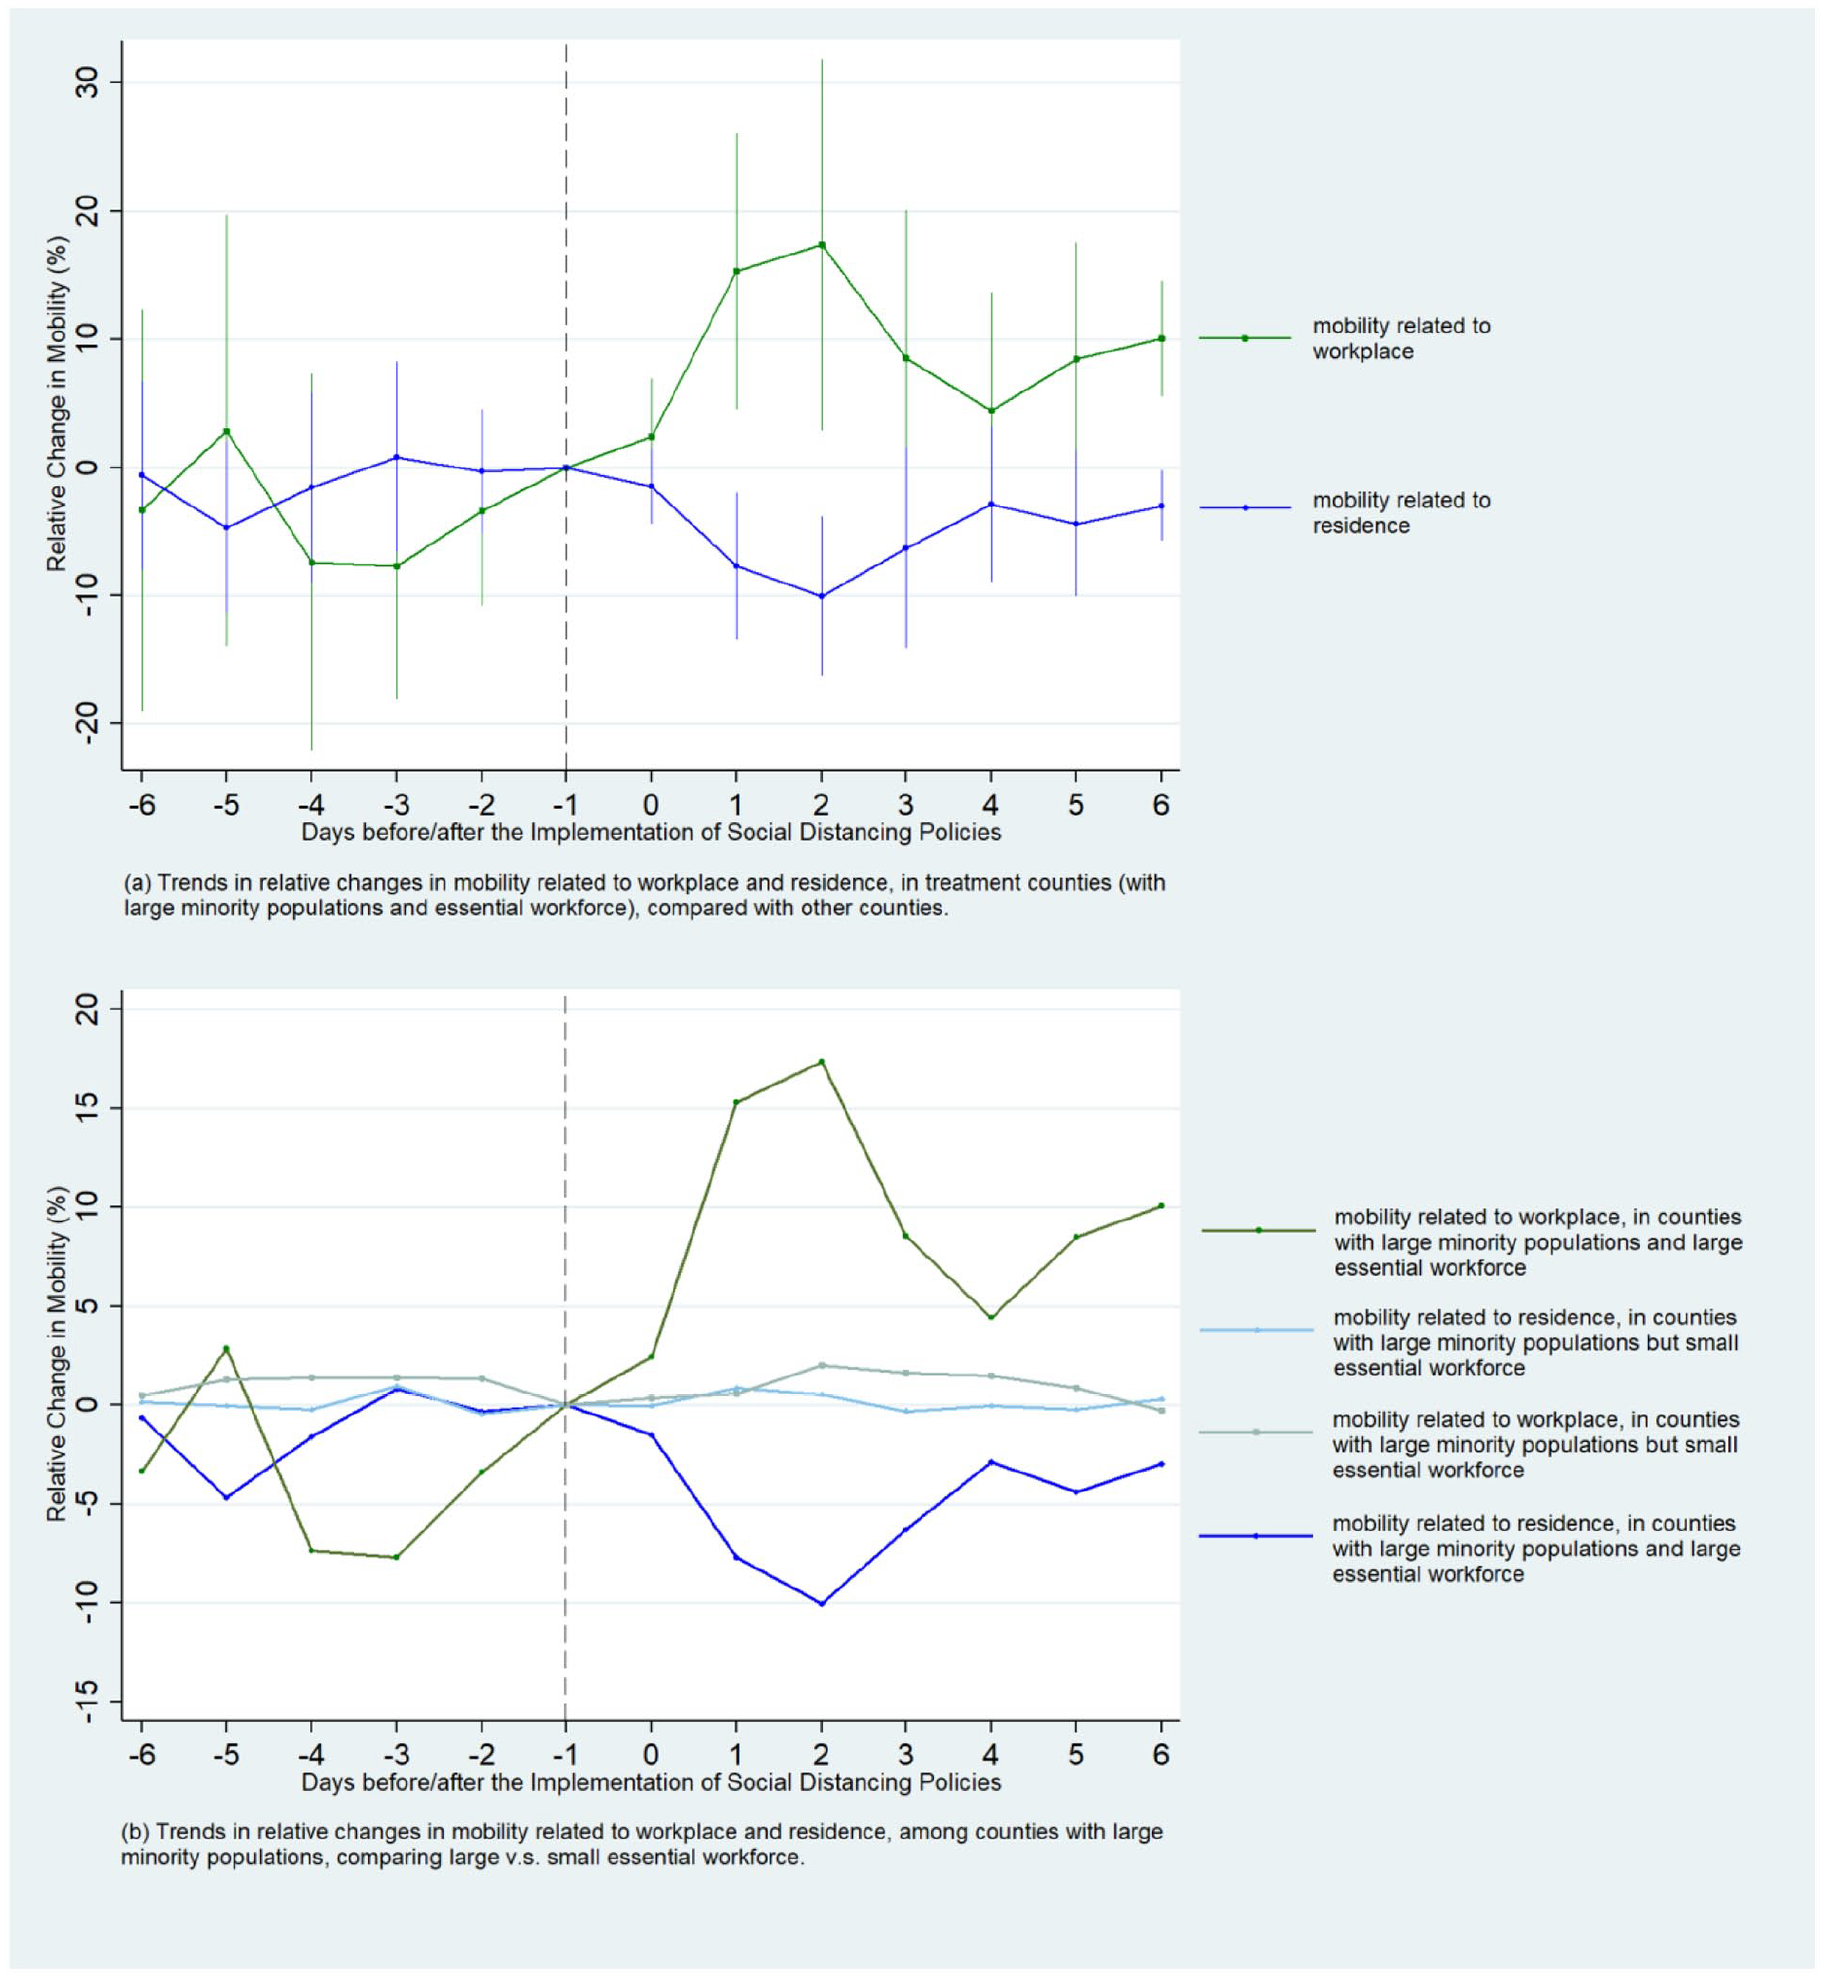
The effects of social distancing policies on physical mobility. (a). Trends in relative changes in mobility related to workplace and residence, in treatment counties (with large minority populations and essential workforce), compared with other counties. (b). Trends in relative changes in mobility related to workplace and residence, among counties with large minority populations, comparing large vs. small essential workforce.
But is this inefficacy of social distancing caused by race/ethnicity? In Figure 1b, we keep the two trend lines from Figure 1a (95% confidence intervals) and present another two trend lines that reflect the estimates of social distancing in counties with large minority populations but small proportions of essential workers. Technically, in the regression analysis, we exclude treatment counties and run two DID regressions of workplace-related and residence-related mobility, in which the two dimensions of difference are racial/ethnic composition and the timing of social distancing. The contrasts between the trend lines in Figure 1b show that the effects of social distancing on workplace-related mobility in counties with a high proportion of minorities are very weak and statistically insignificant, but strong on their residence-related mobility. This result suggests that it is mainly the labor market patterns, but not the racial/ethnic composition, that contributed to the observed inefficacy of social distancing in these counties with a high proportion of minorities.
It is worth noting that the results of our analysis are robust to changes to sampling as shown in our robustness tests using adjusted thresholds. We use different thresholds to form treatment and control groups for comparison. For example, Figure 2 shows the trendlines of mobility changes when we adjust all the three thresholds to 20%. More specifically, in this test, a county is included in the treatment group (90 counties) if (i) it has a minority group (African-American, Hispanic, native, or Asian) that consists of at least 20% of the county population, and (ii) it is in the top 20 percentile in the distribution of proportions of the essential workforce. We further restrict control group counties (94 counties) to those in the bottom 20 percentile in the distribution of proportions of the essential workforce. As shown in Figure 2, the main results of our analysis using adjusted thresholds are robust.
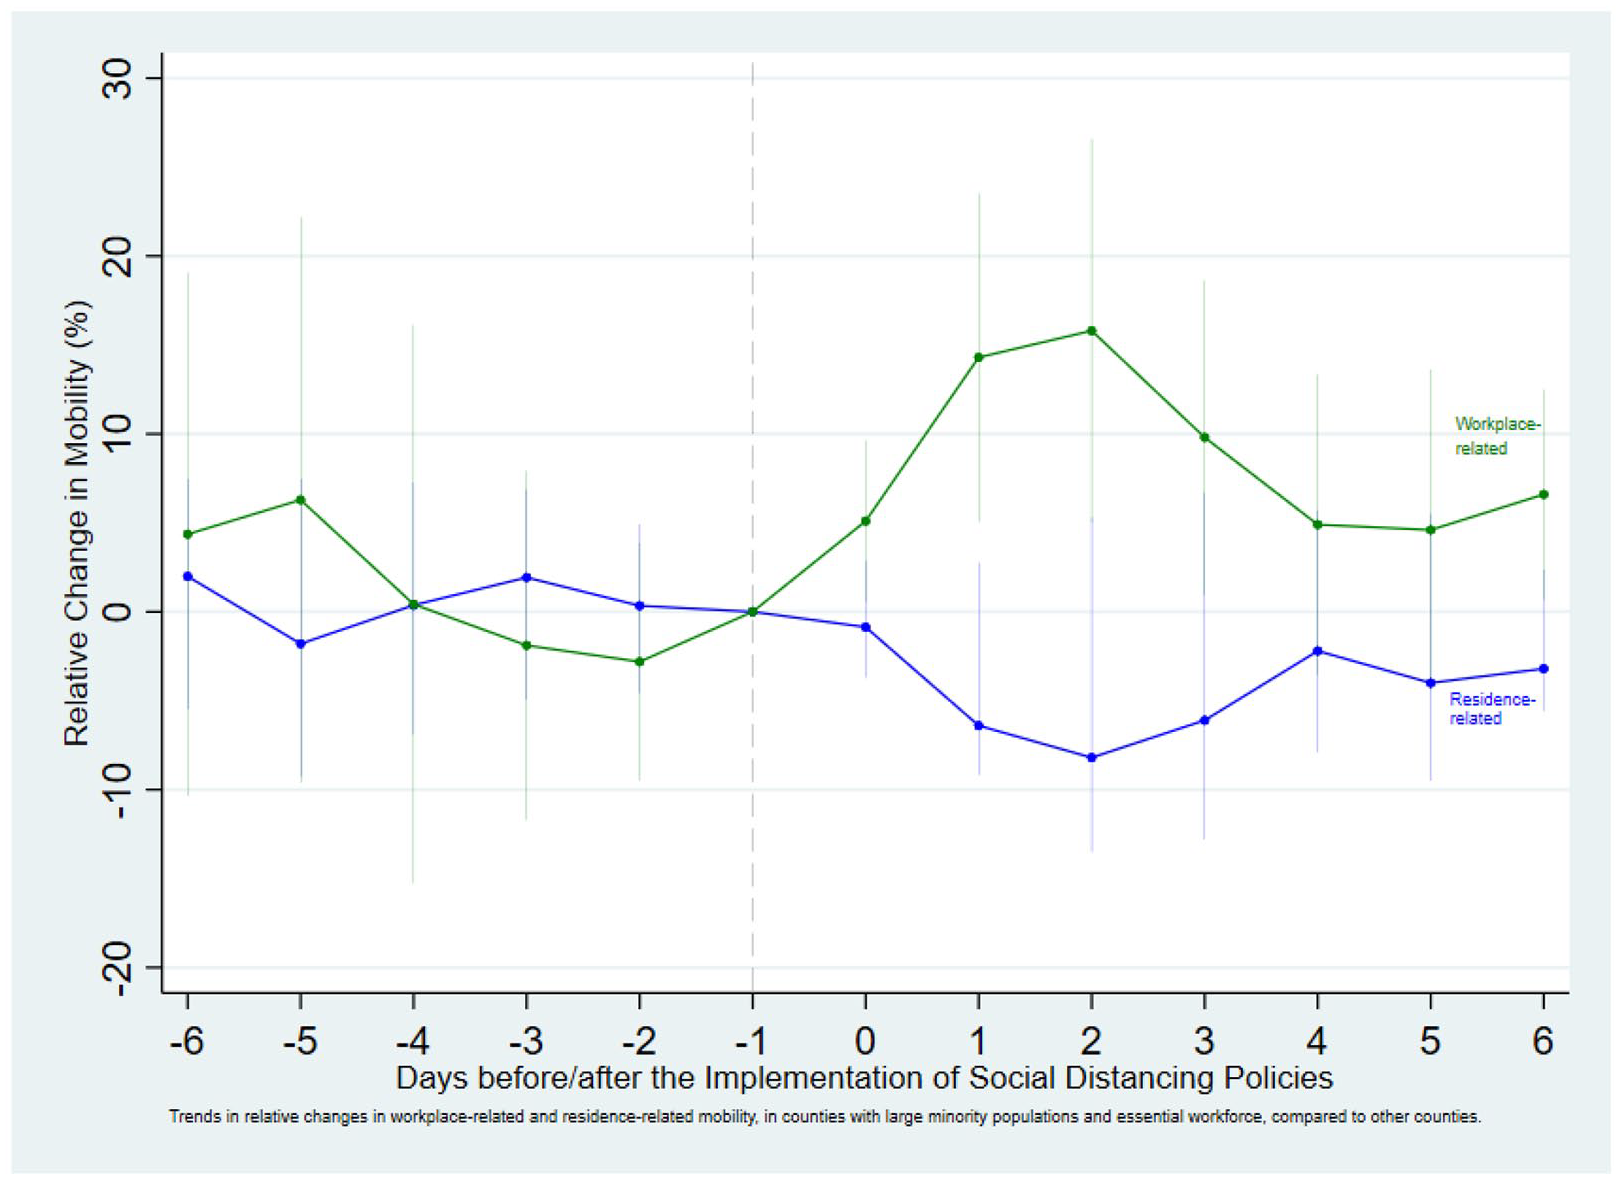
The effects of social distancing policies on physical mobility in a robustness test.
In addition, we conducted regression analyses on intersectionality to further corroborate our key research findings. The two regressions shown in Table 2, using 2018 ACS data on counties in the entire U.S. and NYT COVID-19 data, reveal the relationship between confirmed COVID-19 infection/death cases and the intersectionality between race/ethnicity and essential work. These regressions also concern demographic intersectionality by focusing on minority workers in the essential workforce, instead of treating the single sub-populations separately and independently. The first regression shows that, controlling for the county population, one racial/ethnic minority essential worker sampled in the ACS reflects 19 more confirmed cases in the entire U.S. population; as the ACS is sampled by 1:100, this indicates that one minority essential worker in a county approximately leads to 0.19 more confirmed infection cases. The minority population itself, however, is not significantly related to the number of confirmed infection cases. This reflects the importance of considering intersectionality in COVID-19 related research: a higher infection rate among the minority population is closely related to the fact that minorities are disproportionately more likely to be essential workers, which has important policy implications from perspectives of racial inequality. The second regression shows that only the population of essential workers is significantly related to the number of COVID-19 deaths, controlling for the county population. This shows again that the size of the minority population alone cannot explain COVID-19 deaths.
Regressions between infection/death cases, racial/ethnic minority, and essential work.
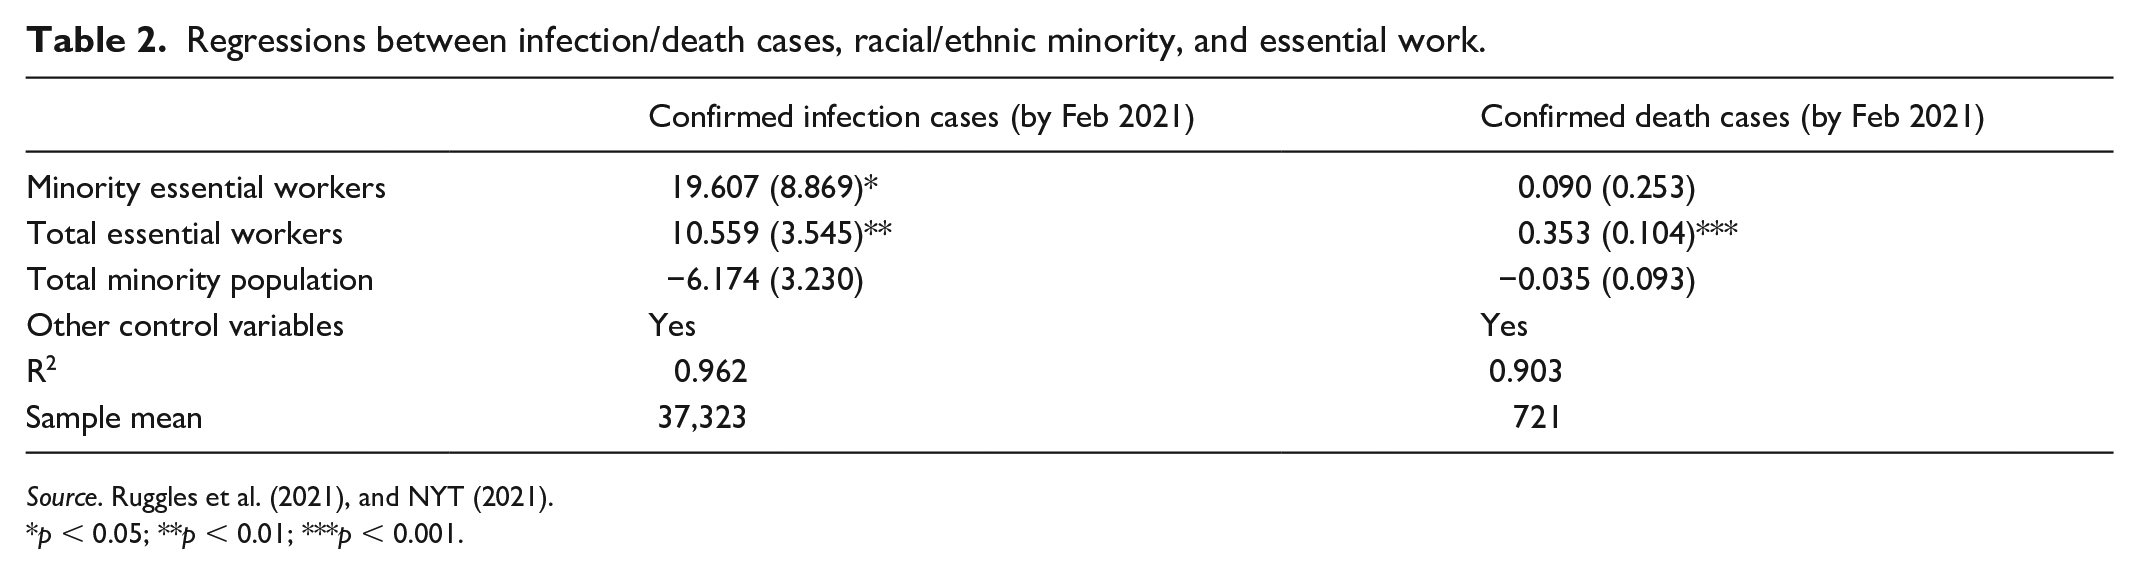
Source. Ruggles et al. (2021), and NYT (2021).
p < 0.05; **p < 0.01; ***p < 0.001.
Discussion and conclusion
Our case study findings reveal (i) that mobility behavior change under social distancing was significantly differentiated between subpopulations; more specifically, (ii) essential workers, regardless their race/ethnicity, had significantly less change in their workplace-related mobility; and (iii) racial/ethnic minorities are more likely in the essential workforce and thus have less change in their workplace-related mobility. We thus argue that universalistic policy as social distancing is not universally effective. Structural and socioeconomic inequalities can significantly compromise the effectiveness of supposedly universally applicable policies. Due to workplace-related mobility, subpopulations with higher concentration of essential workers and racial/ethnic minorities are more exposed in public and work spaces and thus in need of extended protection measures due to their socioeconomic status and work needs, especially considering the risks of reinfection from vulnerable subpopulations to the general population (Alsan et al., 2011; Farmer, 1996). Our research findings are of timely value to public decision-making in response to the ongoing pandemic crisis and future epidemics.
This case study demonstrates the value and potentials of our proposed small contextual analysis approach to big data. Our new approach doesn’t aim to solve the problems of incompleteness and unrepresentativeness of entire big datasets; instead it guides the selective use of relatively small subsets of original big datasets by applying the sampling strategy developed from traditional data to the potentially useful big datasets as in this case study. By doing so, it makes big data small and structured and thus articulable with traditional data and usable to conventional social science methods. We acknowledge that our case study is only an experiment with its own limitations. Firstly, the ACS data, though a statistically significant sample of the U.S. population, may not accurately reflect the conditions of certain marginalized or vulnerable people in the U.S. not covered in the ACS (Wardrop et al., 2018). Moreover, while this study simply follows the categorization of essential workers developed by U.S. federal agencies (U.S. CDC, 2021), the conception and categorization of essential workers and workplace travel could be more critically examined for better calibrated application of the mobility and employment datasets (Dingel and Neiman, 2020; Lakoff, 2020) and further contribution to works on data ontology and sociopolitical forces (Kitchin and Lauriault, 2014; Kitchin and McArdle, 2016; Zhang et al., 2021). This study could also be extended to generate results about relational spatiality, socioeconomic inequality and pandemic expansion between counties by further integrating inter-county mobility data such as LODES data (Bergmann and O’Sullivan, 2018).
Therefore, we call for more proactive methodological innovations that recognize and confront the critical limitations of accessible big data especially in times of urgent needs (Coudin et al., 2021; Lazer et al., 2021). As demonstrated in this study, a promising strategy for social scientists with or without data science skills is to integrate and articulate more diverse data sources and methods for more contextualized and corroborated data analysis as called for or experimented since before COVID-19 (O’Halloran et al., 2018; Pokhriyal and Jacques, 2017; Zhang et al., 2018). For example, the corroboration of smartphone-based mobility data from multiple sources (Huang et al., 2021) could be further extended to using public transportation data (e.g. train and bus card transaction, and publicly available Uber data). We can also integrate more detailed socioeconomic and demographic data from traditional surveys or census as exemplified by Zhao et al. (2020) using data from U.S. Washington State Department of Employment Security. We should also consider integrating ethnographic methods and qualitative data for more localized baseline knowledge and more targeted decision-making in pandemic responses (Palinkas et al., 2020; Vindrola-Padros et al., 2020).
Footnotes
Declaration of conflicting interests
The author(s) declared no potential conflicts of interest with respect to the research, authorship, and/or publication of this article.
Funding
The author(s) disclosed receipt of the following financial support for the research, authorship, and/or publication of this article: The research and publication of this article is partly supported by the first author’s Professional Development Fund from Oregon State University.