
Abstract
Examining the manner in which learning is organized for educators is an important aspect of educational research. However, one main overarching methodological concern with previous studies was the consistent treatment of Likert scales as an interval type data, that may have resulted in slight inaccuracies in the results. This study thus aims to introduce an alternative method using a Rasch model that may be more suitable to understand the learning profiles of educators. Participants were 352 students (106 male, 246 female) enrolled in a postgraduate program in education. The theoretical framework was based on deep and surface learning approaches and was measured using the instrument RASI. The measurement tool was first validated using the Rasch Rating Scale model and the ability measures of deep learning and surface learning for each student were computed. Analysis indicated that the data was an excellent fit for the Rasch model and that the categories for all items were clearly ordered. Both of the subscales captured most of the spread of person measures. Subsequently, a person-orientated approach was used on the ability measures to categorize the pre-service teachers. The cluster analysis on these ability measures indicated that four groups of students differing in their levels of deep and surface approach to learning were obtained, namely D+/S−, D+/S+, D/S−, and D−/S. Comparisons across clusters for age and gender showed that students with a high deep and low surface approach were significantly older than others. In summary, the present study has demonstrated an alternative method of cluster analysis to identify different learning profiles, by transforming ordinal survey data to an interval level data.
Keywords
Introduction
Examining the manner in which learning is organized for educators is an important aspect of educational research. As teachers venture out to teach in schools across the country, it is imperative that the way they conceive learning is desirable because they are charged with the responsibility of imparting these methods to their students, be it explicitly through discourse or implicitly through modeling. Researchers are justifiably interested with the manner in which pre-service teachers approach learning, irrespective of whether it is a short-term goal of changing maladaptive behaviors or a long-term goal of cascading beneficial and effective approaches to future learners. Studies investigating this aspect have tended to cluster groups of data based on empirical data that use a Likert scale structure (e.g. Vanthournout et al., 2013). However, whilst these studies have conducted their analysis rigorously, the notion that a Likert scale structure may be ordinal in nature could have resulted in slight inaccuracies in the results obtained. This article thus aims to introduce an alternative method using a Rasch model that may be more suitable for these analysis.
Deep and surface approaches to learning
One theory that has emerged over the past decades relates to the notions of deep and surface approaches to learning. These approaches were initially conceptualized by Marton and Saljo as levels of processing whereby individuals with a deep level of processing actively sought understanding from their readings and individuals with a surface level of processing were more focused on memorizing their readings (Marton and Säljö, 1976). These ideas were later expanded to include motivational elements and re-styled as “approaches to learning” (Entwistle, 1977, 2000). Using this framework, a deep approach to learning is characterized by an intention to seek the underlying meaning of concepts, to connect existing ideas within and across subjects as well as to evaluate evidence for critical processing. On the other hand, a surface approach to learning is based on motives that are extrinsic in nature, such as fear of failure or keeping out of trouble. Students who adopt a surface approach to learning have the intention to memorize content in lieu of understanding and are prone to accept ideas and concepts without question (Biggs, 1987; Entwistle, 2000).
A third approach was originally proposed that took into account the pervasive effects of assessment procedures. This approach, defined as a strategic or achieving approach, typically involves the study behavior of students as they focus on fulfilling assessment demands (Biggs, 1987; Entwistle, 2000). However, a literature review conducted by Richardson (1994) across various cultures and instruments led to the conclusion that there was scant evidence for the existence of the strategic approach. Rather, the evidence was overwhelming in favor of two distinct factors, that is, deep and surface approach (Richardson, 1994). These results were further reinforced by succeeding empirical studies across both eastern and western contexts (Kapinga-Mutatayi et al., 2018; Leung et al., 2008). Hence, this study does not focus on the strategic approach, and will only distinguish between deep and surface approaches.
In the context of learning approaches, a learning profile is defined as the degree in which students use aspects of deep and surface approaches in their learning process (Vanthournout et al., 2013). The underlying notion of a learning profile lies in the belief that a student engages in learning by combining aspects of different learning approaches, depending on their perception of the learning environment (Meyer, 1991). Using a person-orientated research perspective, four learning profiles of students have been theorized and identified (Cano, 2005; Lindblom-Ylänne and Lonka, 1998; Meyer, 2000; Vanthournout et al., 2013): scores in deep and surface approaches that are (i) high-low, (ii) low-high, (iii) high-high, and (iv) low-low. These profiles were initially termed as study orchestrations with the first two profiles classified as consonant approaches and the latter two profiles as dissonant approaches (Meyer, 1991).
Earlier studies examining study orchestrations and academic achievement had indicated that students with dissonant approaches, that is, high-high or low-low in deep and surface approach, tend to perform worse than students with consonant approaches (Cano, 2005; Lindblom-Ylänne and Lonka, 1998). Dissonant approaches were attributed to attempts to adapt to a learning context and were regarded as temporal and unstable (Lindblom-Ylänne, 2003). However, whilst these results may occur in their specific western context, Kember (2016) has suggested that Asian students outperform western students academically in international comparisons because they combine seeking understanding and memorization in their learning (Kember, 2000, 2016). Furthermore, in a study conducted on pre-tertiary students in Singapore, the level of intrinsic motivation between the learning profiles of high-high and high-low in deep and surface approach was not significantly different (Chue and Nie, 2017). It would appear that the interactions between both learning approaches may be more complex than was originally conceived (Beattie et al., 1997).
These findings have led to the conjecture that learning approaches should be viewed as a continuum with intermediary points, rather than a dichotomy (Kember, 2016). This point was observed, but not highlighted, in a study conducted by Vanthournout et al. (2013) that analyzed the differential developments of learning approaches in students’ initial learning profiles over time. The researchers noted that students with below average scores for both deep and surface approach were characterized as “at risk” students, yet the absolute scores for these students could not be classified as low. A closer examination of the results revealed that some of these below average scores could be relatively close to the mean score, that is, less than 0.5 standard deviations, whereas other scores could be relatively far from the mean score, that is, more than 1 standard deviation. Whilst it is logical that students can vary in their learning behaviors in terms of frequency and complexity, it may appear unsound that students at the threshold of the mean score would be classified as “at risk.” Certainly, it makes sense to include an additional category of “average” when analyzing learning profiles.
Methodological concerns
One main overarching methodological concern with the above studies was the consistent treatment of Likert scales as an interval type data. In categorizing learning profiles, a cluster analysis is usually employed whereby clusters are formed by examining the Euclidean distance between two data points. The characteristics of the various clusters are subsequently examined through their means and standard deviations. However, strictly speaking, a Likert scale is an ordinal data type whereby intervals between values cannot be presumed to be equal. According to this definition, computation of means or standard deviations are deemed to be unsuitable for analysis (Wu and Leung, 2017). Additionally, comparing distances between data points may be inappropriate. For example, in a 1-dimensional ordinal level scale, it is unclear whether behaviors are more similar when the data values are 4 and 4.5 (Euclidean distance of 0.5) or whether behaviors are more similar when the data values are 4 and 3.9 (Euclidean distance of 0.1).
A second methodological concern was the incompleteness of scale validation in the studies. The primary current measurement instruments for deep and surface approach are the Two Factor Learning Process Questionnaire (Biggs et al., 2001) and the Revised Approaches to Studying Inventory (RASI) (Tait et al., 1998). Whilst the factor structure of both instruments have been validated, analysis at the item level may still need to be conducted. The suitability of the items to the target population as well as their fit quality would need to be established. For instance, the validation studies were conducted on undergraduate students and demonstrated reasonably good values for both deep and surface approach. However, floor or ceiling effects may exist when the items are administered to mature students who may tend to employ a more efficacious way of learning. Furthermore, in their systematic review of empirical literature, Dinsmore and Alexander (2012) suggest that validity evidence should be provided by authors as it is the interpretation of the resulting data that is validated.
Rasch Rating Scale model
In operationalizing the deep and surface approach constructs, the shortened version of the RASI was used for this study. The Rasch Rating Scale model (Andrich, 1978; Bond and Fox, 2015) will be used to assess the appropriateness and quality of the items. Interval level estimates of each student’s level of deep and surface approaches were also derived from the data before performing further statistical analysis.
The Rasch Rating Scale model specifies the probability that a person n will choose a given category k on an item i is given by the following mathematical expression:
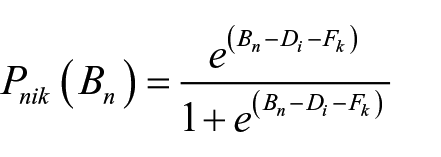
where Bn refers to the person ability, Di is the difficulty of the entire item and Fk is the difficulty estimate of the kth threshold. For example, in this study, Bn is represented by students’ level of deep or surface approach, Di indicates how likely the entire item would be endorsed and Fk is the estimate at which a person has an equal chance of scoring category k and category k –1.
The Rating Scale model creates interval-level data from ordinal-level data, for example, survey scores. The model places item difficulty and person ability on a single interval-level scale, known as a Wright map, where the units of the parameters are given in log-odds units or logits. A higher logit value indicates greater item difficulty or higher person ability. The Rating Scale model makes use of Rasch-Andrich thresholds which are points on the latent variable where adjacent categories of the item are equally probable (Bond and Fox, 2015). For example, if the item difficulty at the threshold of 4 is 1 logit, a person at an ability level of 1 logit would have a 50% chance of scoring 4 and a 50% chance of scoring 5. Examining the threshold estimates of the scale provides an insight into the category functions of the scale. For optimal functioning, the threshold estimates should advance by a certain value so that it has the same mathematical properties as a set of dichotomies (Linacre, 2006).
Fit statistics also play an important role in Rasch analysis in determining the quality of measurements. Items that are misfitting do not meet the Rasch model requirements and may need to be re-examined for revision or deletion. Commonly used fit statistics are the mean-square and z-standardized values of OUTFIT and INFIT. Mean square values are based on chi-square statistics and indicate whether the data fits the model whereas z-standardized values are z-scores that whether the data fit is significant. These fit statistics are further divided into OUTFIT and INFIT values. OUTFIT refers to outlier-sensitive fit and places equal weightage onto all responses. INFIT refers to inlier-sensitive fit and places more weightage on items targeted on the person or group (Linacre, 2002; Smith, 1996). Mean square values closer to 1.0 indicate a good fit. Values greater than 1.0 indicate that the data is more unpredictable, whereas values smaller than 1.0 indicate that the data is more predictable than expected (Linacre, 2002).
Research aims
In summary, to achieve the aim of understanding the learning profiles of pre-service teachers according to their learning approaches, the Rasch Rating Scale model was used to examine the quality of items in the measurement instrument RASI and to transform each individual’s score to an interval-level estimate. Next, a person-orientated method was applied to categorize the pre-service teachers into various learning profiles. Finally, differences in age and gender across the profiles were examined.
Method
Sample and procedure
The sample in this study were 352 students enrolled in a Post-Graduate Diploma in Education. Individuals who aspire to teach in government schools are required to complete the program. Students in the program would have completed their undergraduate degree in any discipline and have successfully passed through an interview process. The sample comprised of 352 students (106 male, 246 female). The mean age was 26.8 years, SD = 4.58.
The study took place in the Educational Psychology course. This was a compulsory course that spanned 13 weeks. English was the medium of instruction. The questionnaire was administered in the middle of the semester and students took approximately 10 minutes to complete the questionnaire. They were informed that their responses would be kept confidential and that they had the option to withdraw at any point in time. Approval for data collection was also sought and given by the institution ethics board.
Instruments
Students’ approach to learning were measured by the short version of the Revised Approaches to Studying Inventory (RASI) (Tait et al., 1998). The short version of the inventory contains three subscales of deep approach (DEEP—6 items), surface approach (SURF—6 items) and strategic approach (six items). However, only the subscales of the deep and surface approach will be used in this study. Each item was measured on a 5-point scale, ranging from 1 = strongly disagree to 5 = strongly agree. The subscales demonstrated adequate internal consistency (αDEEP = .76, αSURF = .73).
Data analysis
Raw data was entered into WINSTEPS ver 3.92 for Rasch analysis. As the deep learning approach and surface learning approach are two distinct constructs, the Rasch analysis was conducted separately for the two subscales. Model-data fit was assessed by computing the mean-square and z-standardized values of OUTFIT and INFIT. Ideally, mean square fit statistics should lie between 0.6 and 1.4 whilst z-standardized statistics should lie between −1.96 and 1.96 (Linacre, 2003). However, as z-standardized statistics can be overly sensitive when there are more than 300 observations, these values are only taken into consideration when the mean square values indicate a misfit (Linacre, 2003). The suitability of the items was assessed by calculating the Rasch-Andrich threshold estimates. Using the threshold estimates, the Wright map was generated to provide an illustration on whether the items are appropriately targeted at the sample. Preferably, the span of items would cover the spread of person ability measures. In addition, the category probability curves and the category structures were generated to determine whether the scale categories are functioning well. The inter-threshold distance between succeeding categories should not be negative and should advance by at least 0.81 logits for a five category scale (Linacre, 2006). Finally, the ability measures of deep learning and surface learning for each student were computed prior to performing a cluster analysis.
Cluster analysis was subsequently conducted on these ability measures using a procedure detailed in Hair et al. (2014). The procedure was carried out using SPSS ver 24. First, these measures were standardized. Second, a hierarchical cluster analysis was conducted using Ward’s method and the squared Euclidean distance as the measure. The coefficients from the agglomeration schedule were used to determine the optimum number of clusters. A large percentage drop in the coefficient values would indicate the stage where significant clusters occur. Students were then allocated into these temporary clusters. Third, to complete the analysis, a k-means cluster analysis was conducted with the means of the temporary clusters being used as the initial cluster centers. Students were then regrouped into the final clusters (Hair et al., 2014).
Lastly, the characteristics of each cluster are compared. A one-way ANOVA was carried out to examine for differences in learning approaches and age across the clusters. A chi-square test was also conducted to examine whether there was a relationship between gender and the different clusters.
Results
Psychometric properties of RASI
Table 1 shows the item measure and fit statistics for all the items. The item measures range from −0.96 to 0.93, indicating a wide spread of item difficulty. The Outfit mean square values range from 0.73 to 1.28 and the Infit mean square values range from 0.71 to 1.20. Although there were several items in which the absolute z-standardized values were greater than 1.96, there were more than 300 observations and these values were not taken into consideration.
Item measure and fit statistics for all items.
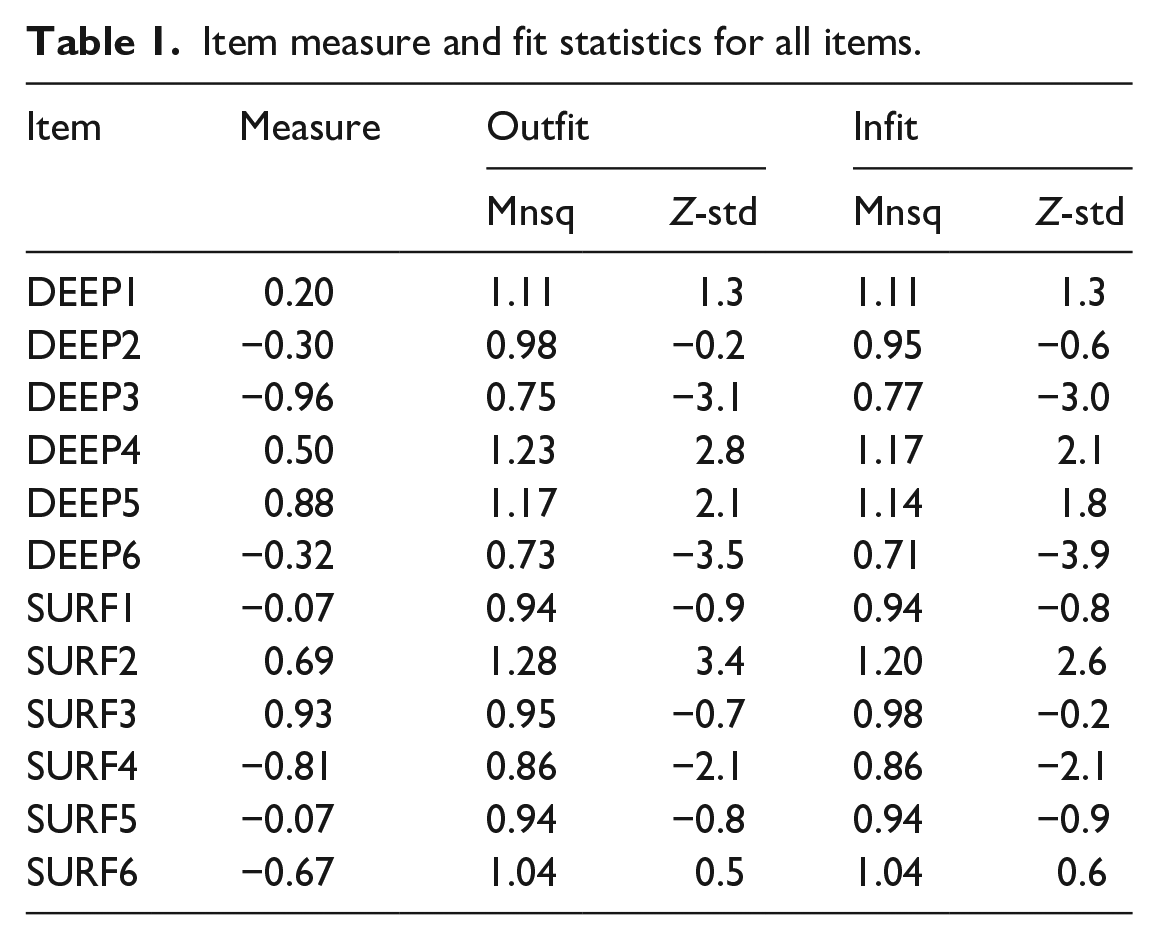
Figure 1 shows the Wright map for the deep approach subscale. There was a reasonably good targeting of the items as the threshold estimates cover most of the spread in student ability. The threshold estimates range from −4.86 to 5.55 whereas person ability (excluding extreme data) ranged from −3.15 to 6.41. The mean person ability was 1.70 logits with a standard deviation of 1.65 logits, suggesting that the sample comprised of individuals who are more inclined to use deep approach in learning. The scale did not suitably target four persons whose ability measure was at a maximum extreme score of 7.77 logits. The four persons constituted 0.01% of the overall sample.
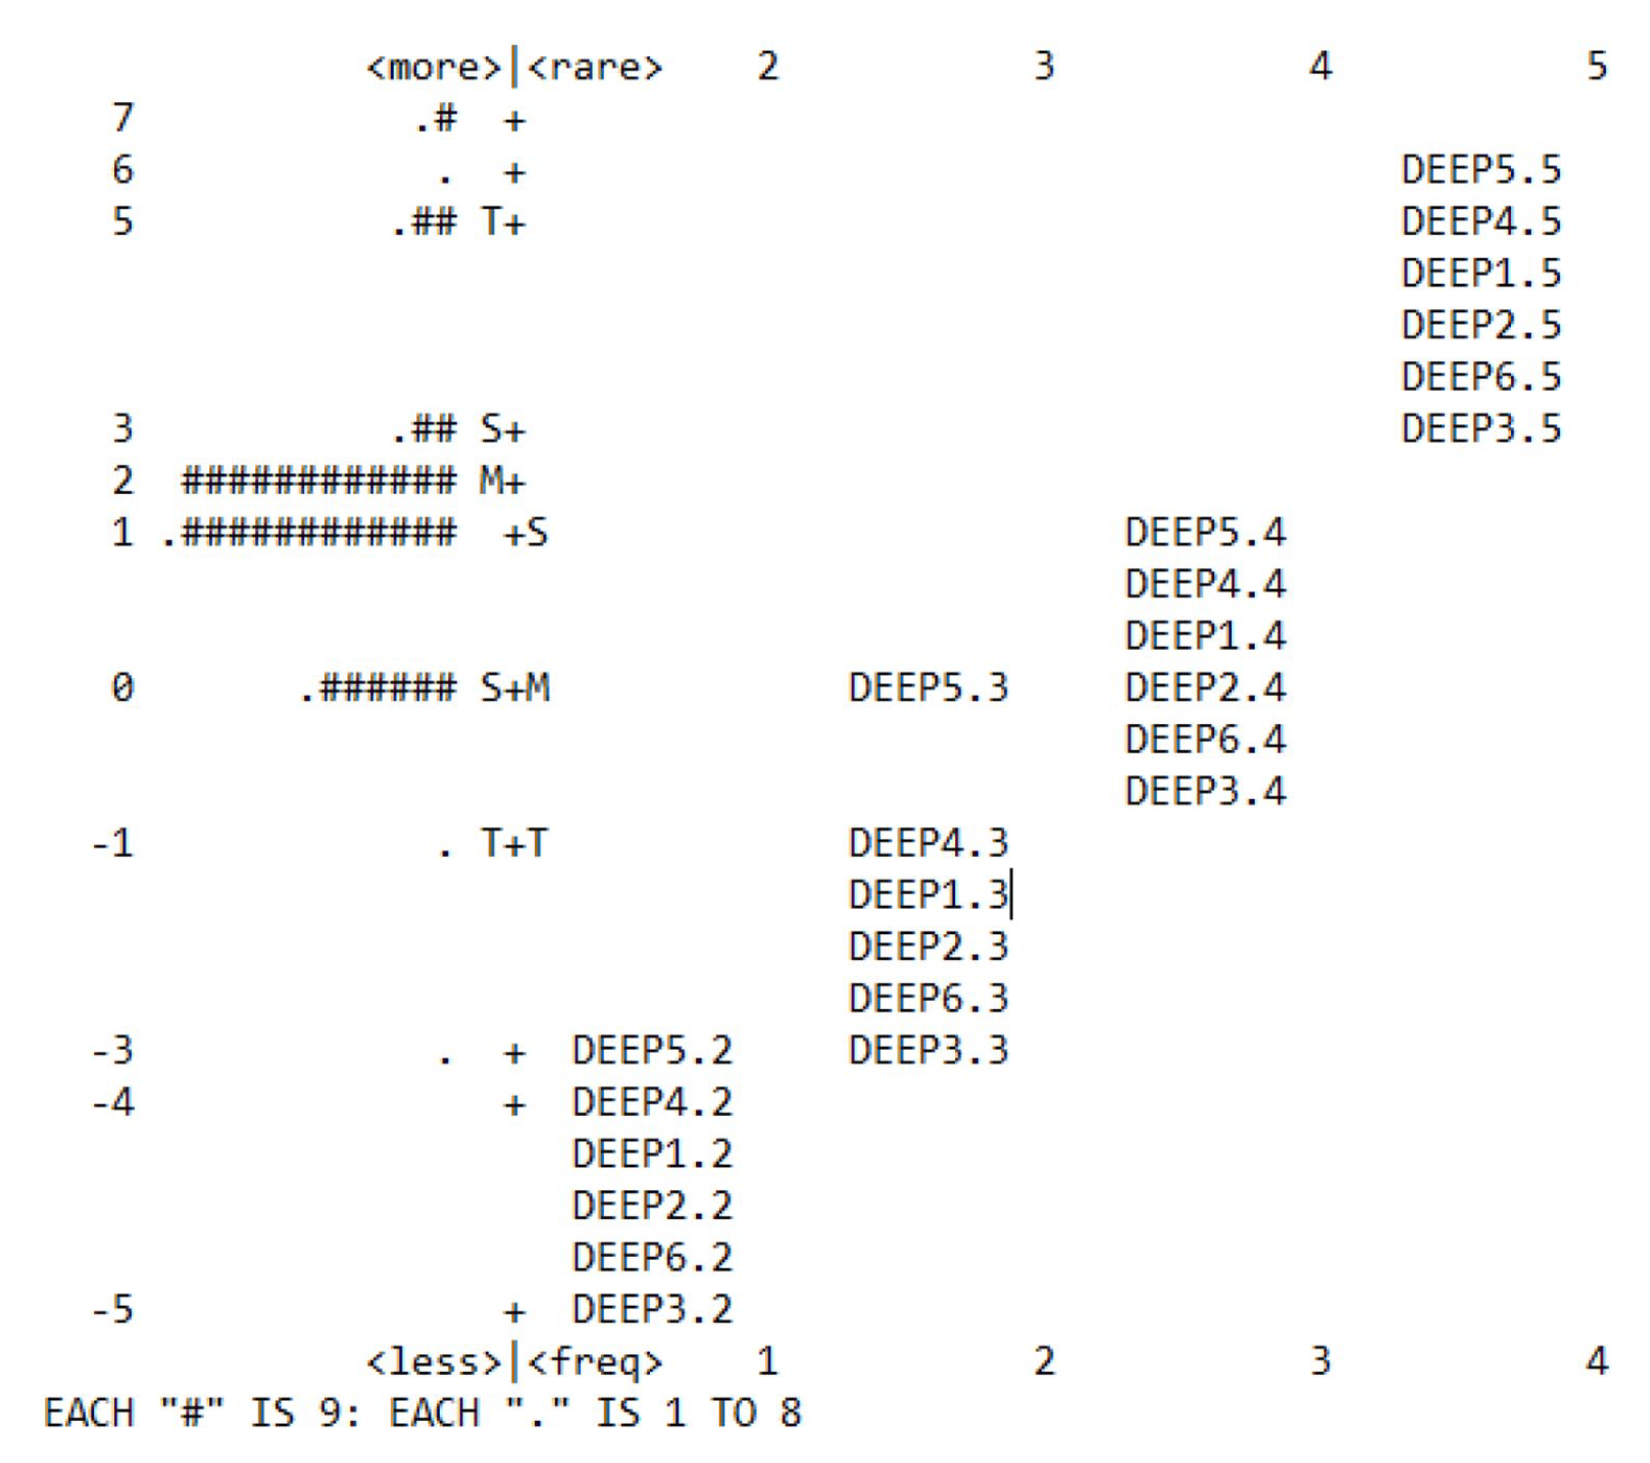
Wright map for the deep approach subscale.
Figure 2 shows the Wright map for the surface approach subscale. Similar to the deep approach subscale, there was a reasonably good targeting of the items as the threshold estimates cover most of the spread in student ability. The threshold estimates range from −3.44 to 3.28 whereas person ability (excluding extreme data) ranged from −4.42 to 4.19. The mean person ability was −.03 logits with a standard deviation of 1.19 logits. The scale did not suitably target 2 persons whose ability measure was at a maximum extreme score of 5.50 logits. The 2 persons constituted 0.005% of the overall sample.
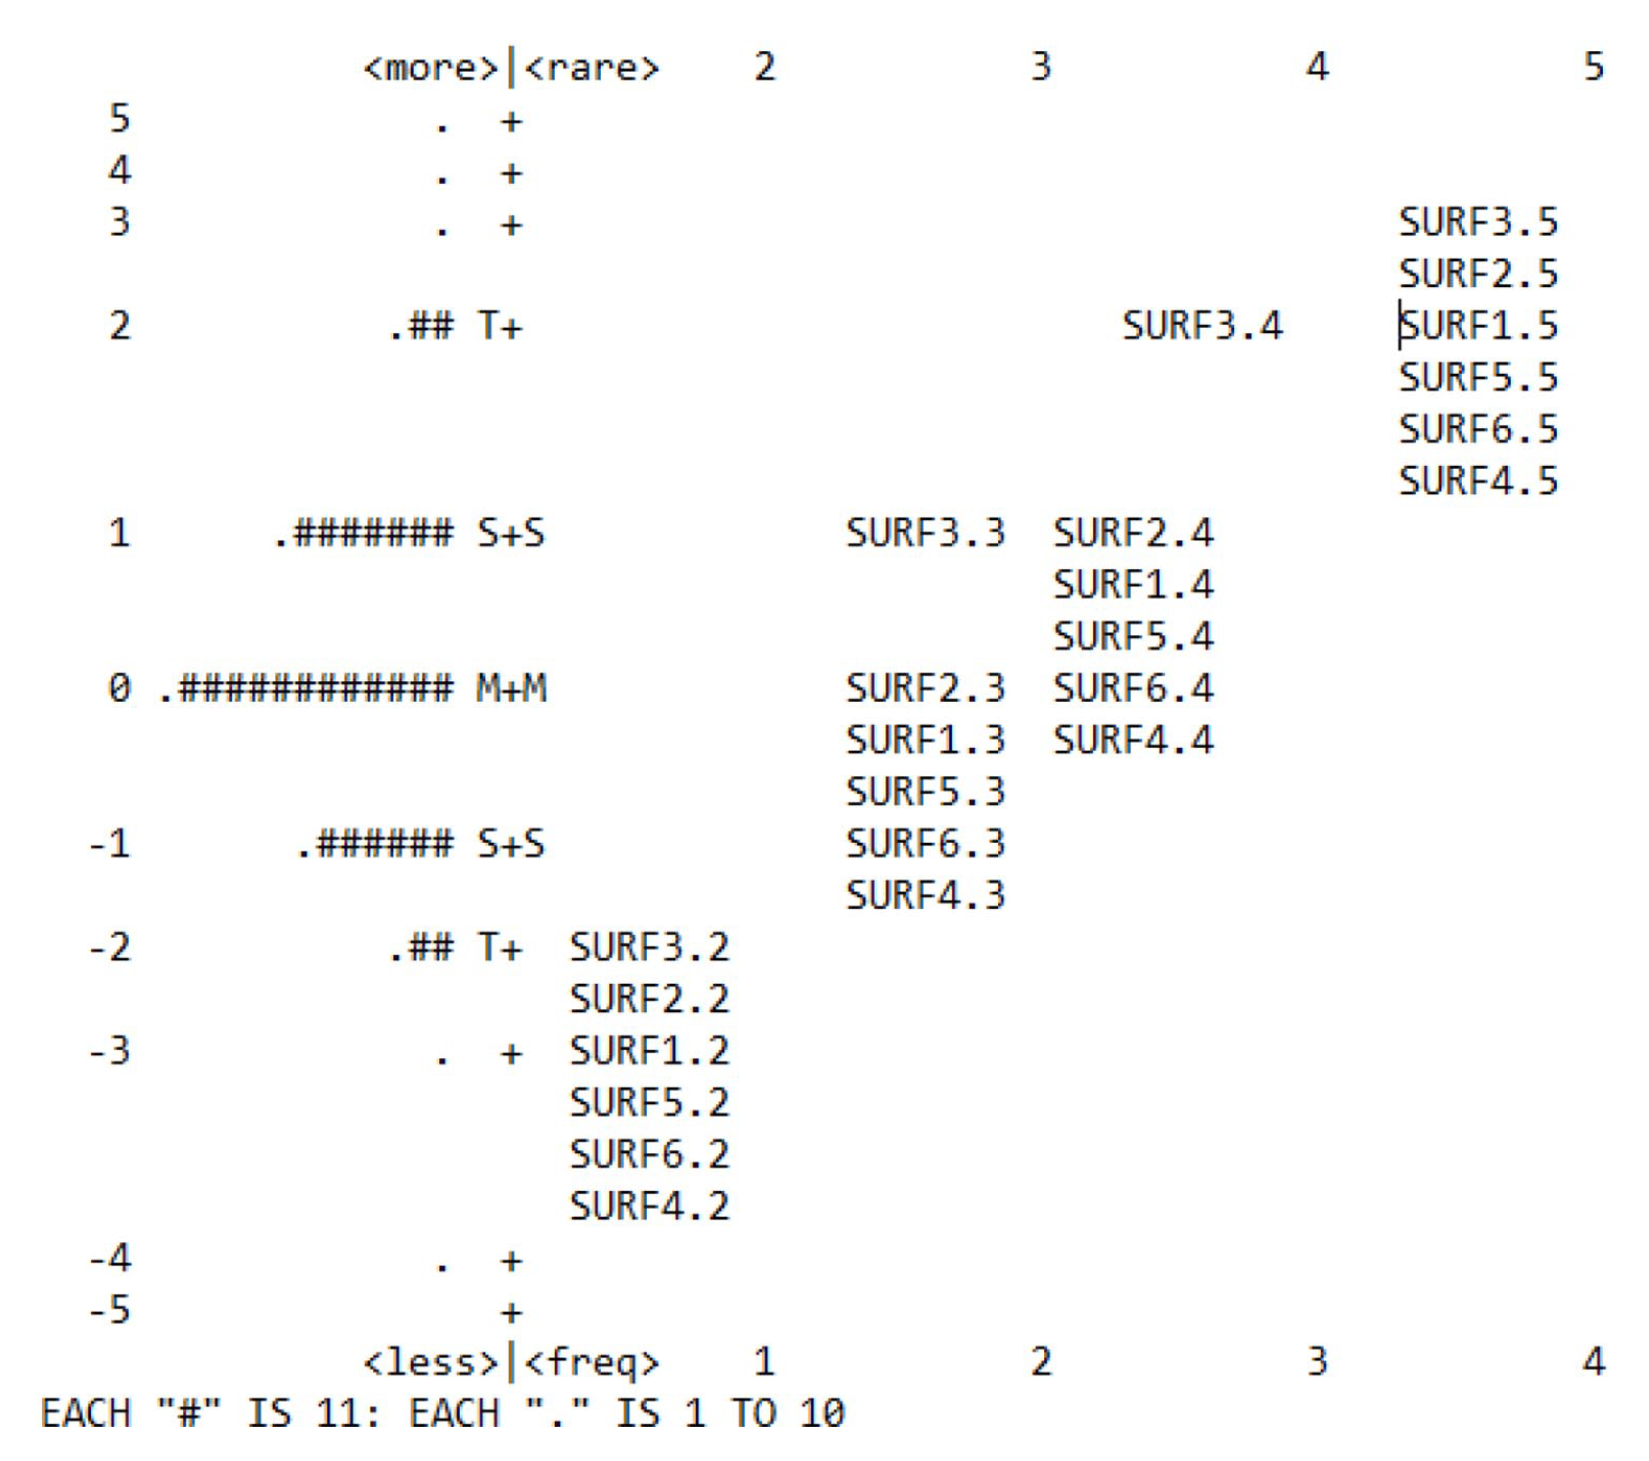
Wright map for the surface approach subscale.
Table 2 summarizes the threshold estimates for the various category in both subscales. From the table, it can be seen that the inter-threshold distances between succeeding categories increase monotonically. Furthermore, all of the consecutive threshold estimates increase by at least 0.81 logits. Figure 3 illustrates these results with the category probability curves for both subscales. The y-axis denotes the probability of endorsement of any given category whilst the x-axis denotes the person ability with respect to the item difficulty. The findings from the tables and the curves indicate that students with a higher ability measure, be it deep or surface approach, are likely to endorse agreement on the items.
Threshold estimates for all items.
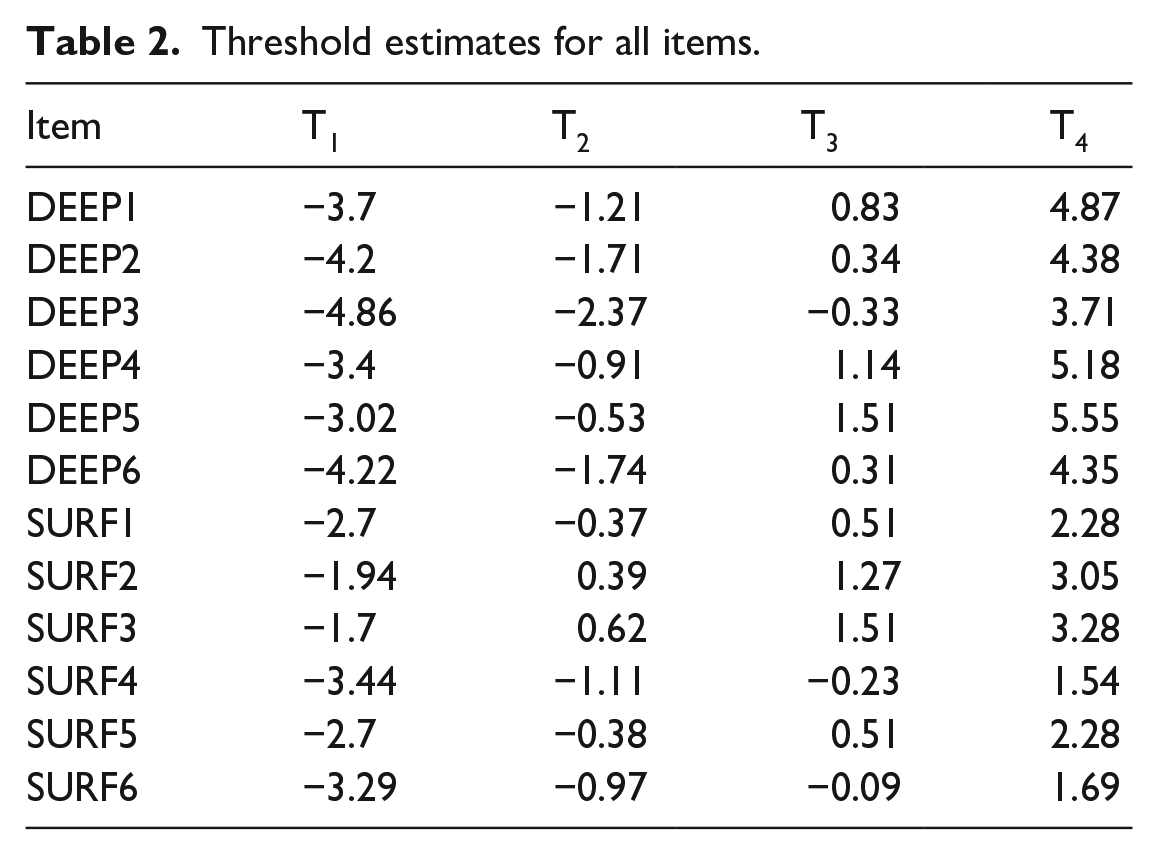
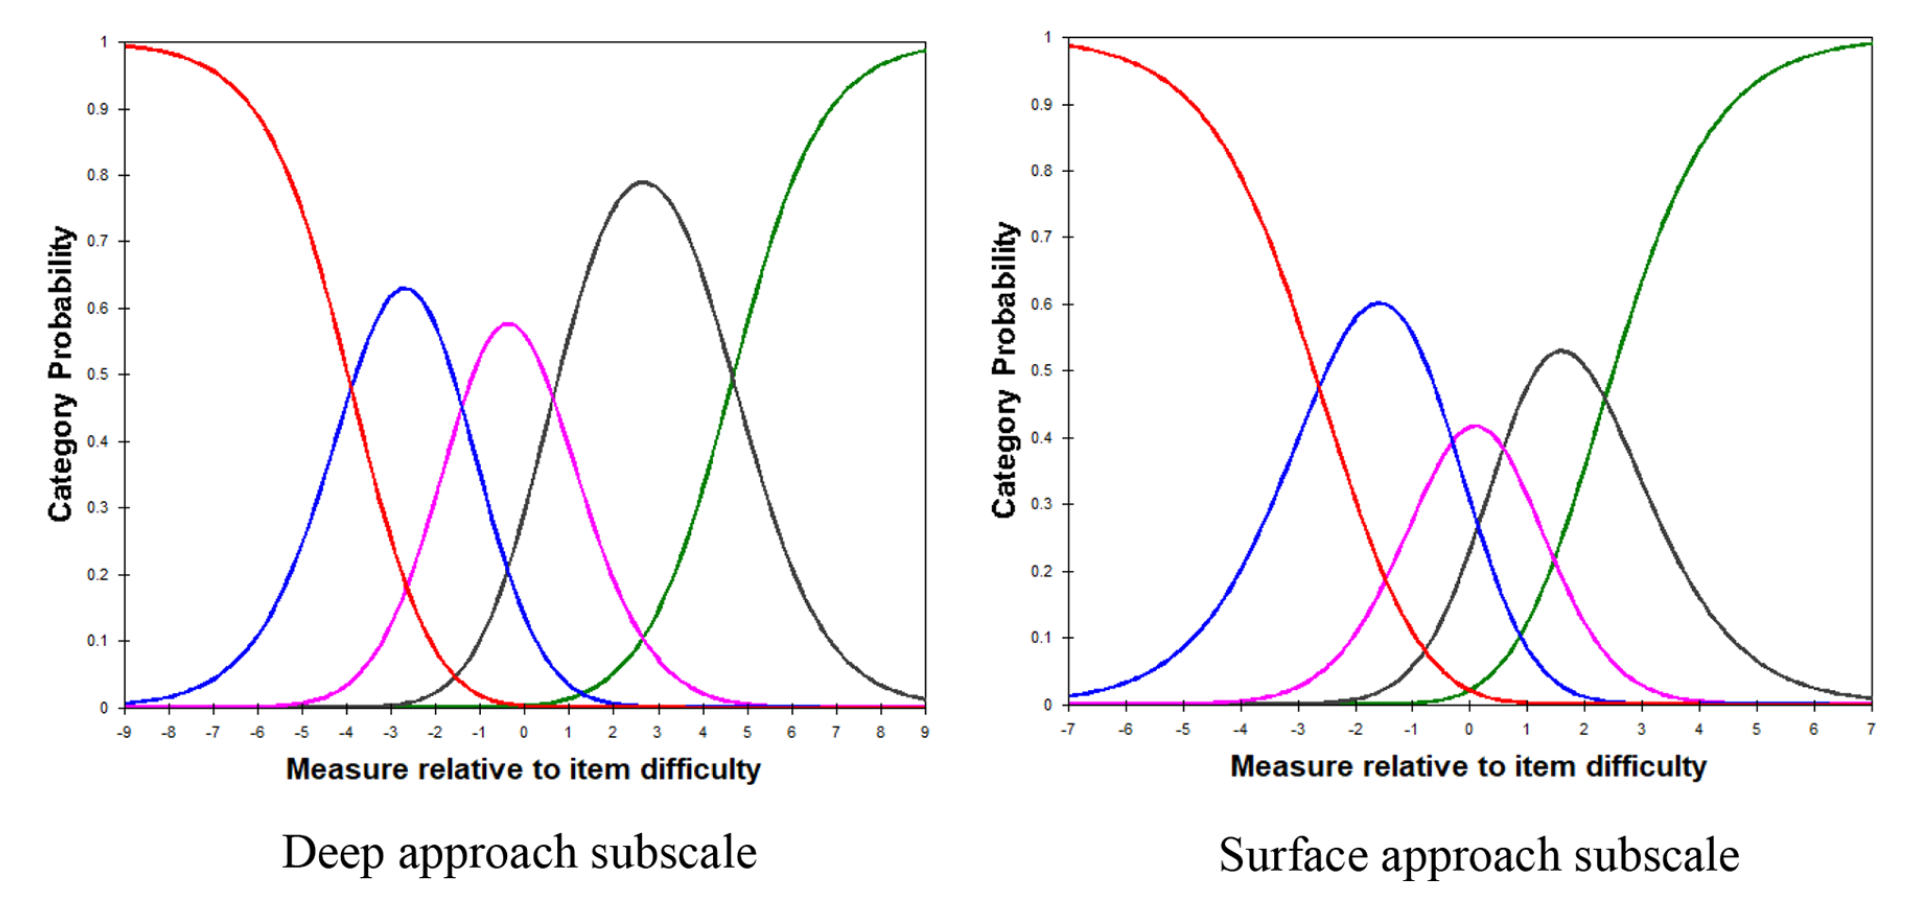
Category probability curves for deep and surface approach subscales.
Cluster analysis
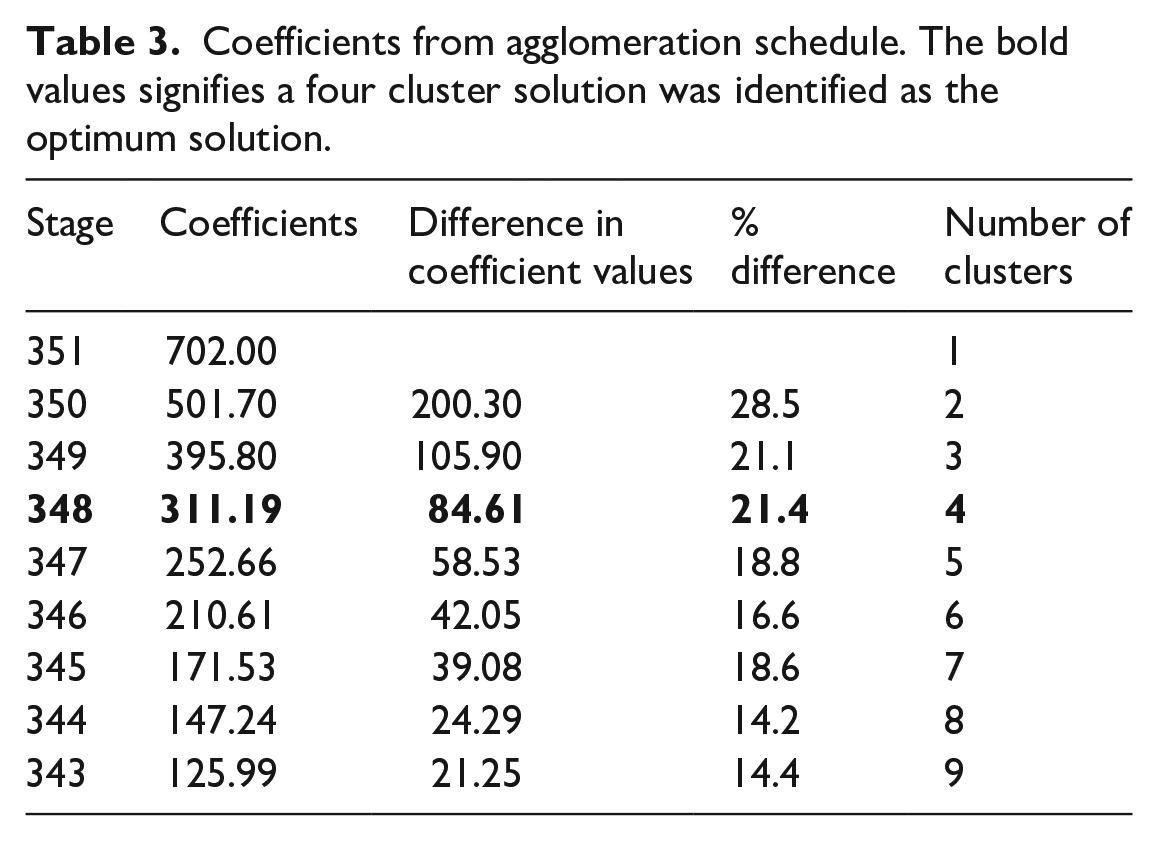
Table 3 presents the coefficients from the agglomeration schedule. A decision was made to use the average percentage of nine clusters (three levels of deep approach × 3 levels of surface approach) as a criterion for determining the optimal number of clusters. The average percentage was 19.2%. Using that number as a cutoff value, a four-cluster solution was indicated as the optimum solution.
Coefficients from agglomeration schedule. The bold values signifies a four cluster solution was identified as the optimum solution.
The profiles for the final four-cluster solution are displayed in Figure 4. Scores that deviate from the mean by half a standard deviation are deemed to be above or below average whilst scores within half a standard deviation from the mean are deemed to be average. Cluster 1 (D+/S−) was characterized by above average scores for deep approach, below average scores for surface approach, and comprised of 27 students. Cluster 2 (D+/S+) was characterized by above average scores for deep approach, above average scores for surface approach, and comprised of 71 students. Cluster 3 (D/S−) was characterized by average scores for deep approach, below average scores for surface approach, and comprised of 114 students. Cluster 4 (D−/S) was characterized by below average scores for deep approach, average scores for surface approach, and comprised of 140 students. Clearly, the D+/S− cluster had the least number of students whilst the D−/S cluster had the most number of students.
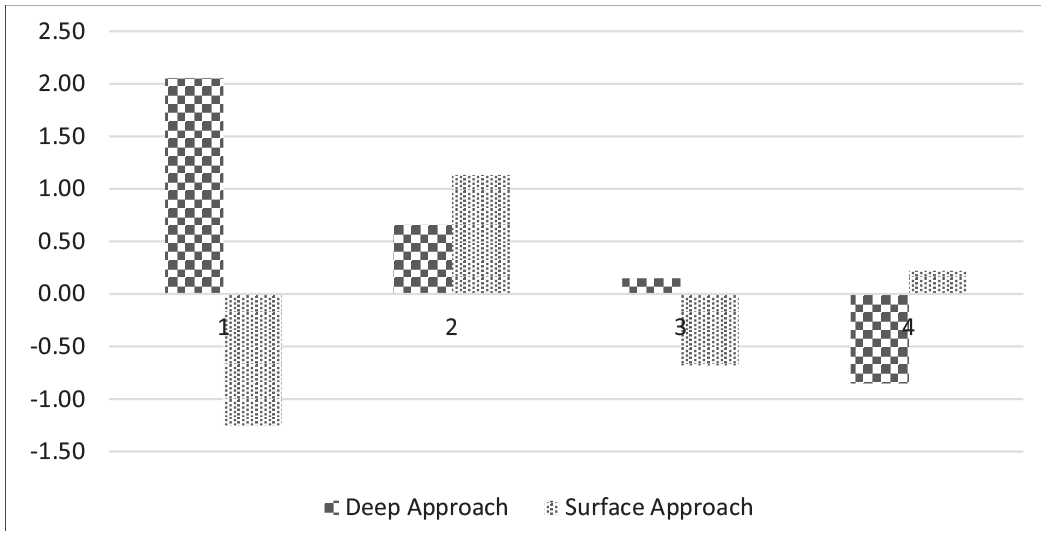
Learning profile for the four clusters.
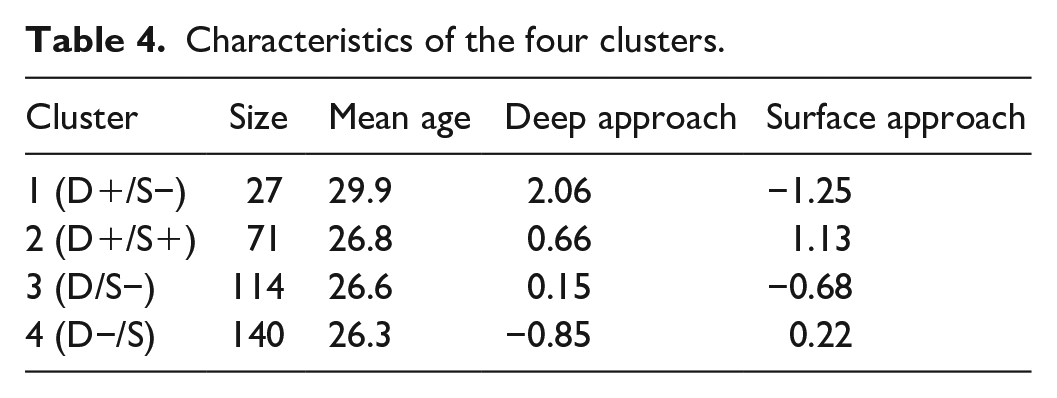
The characteristics of each cluster are presented in Table 4. An one-way ANOVA on learning approaches showed that there were significant differences across the clusters in both deep approach (F(3, 348) = 282.97, p < 0.001) and surface approach (F(3, 348) = 141.52, p < 0.001). A Bonferroni post-hoc test indicated that comparisons across the different clusters were all significant (p < 0.001). In addition, another one-way ANOVA showed that there were significant differences in age across the clusters (F(3, 348) = 4.83, p = .003). A Bonferroni post hoc test showed that only the mean age in the D+/S− cluster (M = 29.9 years) was significantly different from the other clusters (M = 26.8, 26.6, 26.3 years).
Characteristics of the four clusters.
The results of the chi-square tests are presented in Table 5. There was a significant relationship between gender and cluster (c2(3) = 10.26, p = 0.016). To determine which clusters are responsible for this relationship, a further z-test was conducted to compare the proportion of gender in each cluster. The results indicated that (a) there was a significant higher proportion of males than females in the D+/S− cluster (p = .034) and (b) there was a significant higher proportion of females than males in the D−/S cluster (p = .008).
Relation between clusters with gender.
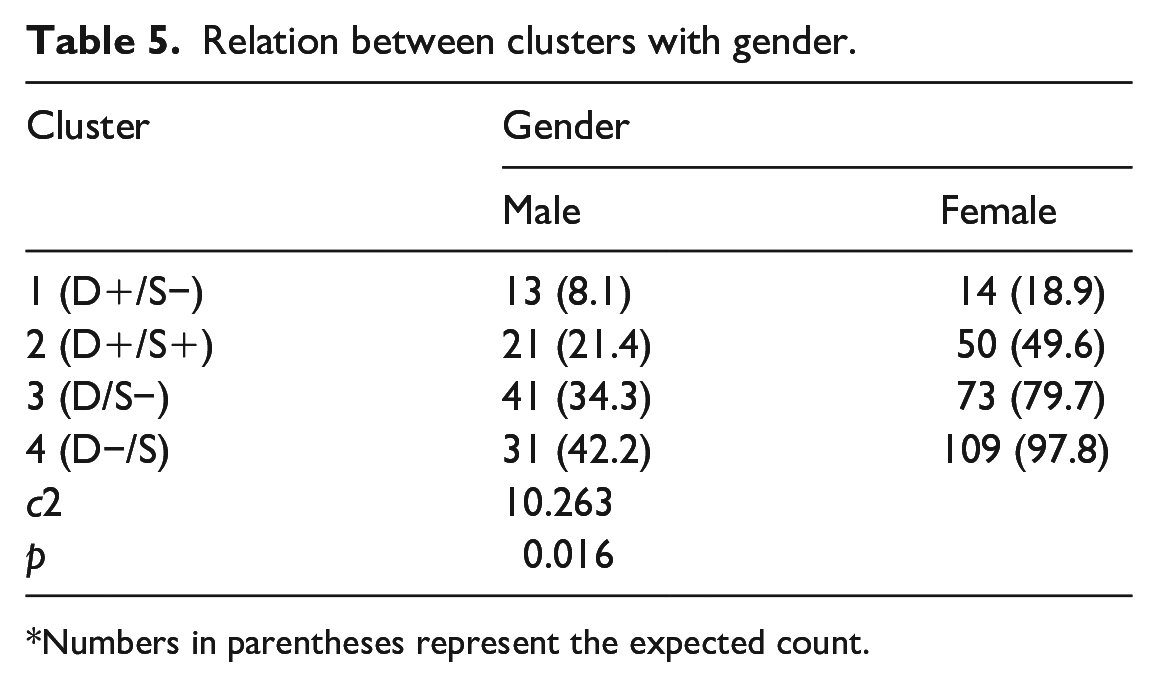
Numbers in parentheses represent the expected count.
Discussion
The current study aims to use a Rasch model to examine the psychometric properties of the RASI scale. At the same time, it introduces an alternative method for cluster analysis by transforming ordinal level estimates to interval level estimates, so that a better understanding of the learning profiles of students in a teacher education program could be obtained. As the factor structure of the RASI subscales had been validated from past literature, the current study complemented the validation studies by examining the quality of items using the Rasch Rating Scale model. The analysis suggested that data for both subscales are an excellent fit for the Rasch Rating Scale model and that items do not distort the measurements. In other words, there are no major deviations between the observed responses and expected responses (which was estimated by the rating scale model). This is crucial as it allows for a valid computation of a person’s ability measure in deep and surface approach. At the same time. the Wright maps showed that both subscales were able to capture most of the spread of person measures. In addition, the categories for all items are clearly ordered with each threshold estimate increasing monotonically by a substantial amount. These indicated that the instrument had a high level of measurement precision and that students are able to distinguish between any two consecutive categories for all items. Students with a higher level of deep approach or surface approach are also more likely to endorse agreement on the individual items. Taken together, these results provide additional support to the validity and reliability of RASI.
Each individual score was then transformed to an interval-level estimate of their ability in deep and surface approach. This transformation appears to serve two purpose in this instance. First, the differences in data values can be considered equal for equal intervals, thus the notion of an Euclidean distance between two points makes better sense. Consequently, the results of a subsequent cluster analysis may be more convincing as the analysis mainly utilizes Euclidean distances to group individuals together. Second, in computing the outcome measures, the weightage of items to the final score are also taken into account. For example, the item DEEP5 with measure 0.88 (“Ideas in course books or articles often set me off on long chains of thought of my own”) appears to be harder to endorse than the item DEEP3 with measure −0.96 (“When I’m working on a new topic, I try to see in my own mind how all the ideas fit together”). This indicates that agreement on the item DEEP5 would have a greater contribution to the final score of deep approach as compared to agreement on the item DEEP3.
Learning profiles
Cluster analysis was used to identify the different learning profiles of the students. In line with previous studies (Chue and Nie 2017; Cano, 2005; Lindblom-Ylänne and Lonka, 1998; Vanthournout et al., 2013), four subgroups were identified. The first cluster, D+/S− may be construed the traditional archetype of “model” students. Students in this cluster often try to relate connections to other areas. They are able to understand key points in lessons and do not need to resort to rote memorization to do well. The second cluster, D+/S+, may reflect students who use a flexible combination of deep and surface approaches in their learning. This dissonance in their learning approach may be due to a number of factors. For example, they may be inclined toward a deep approach but contextual demands such as time constraint or sheer workload may only permit this to a certain extent (Meyer and Shanahan, 2003). A second alternative may be due to individual differences that are present within the students. In particular, students may use memorization as a pre-requisite for subsequent topics or they may require a combination of repetition and making sense to progress in learning (Kember, 2016). A third alternative may be that the students are in a flux of change, as they are progressing from their just completed undergraduate course to a pre-service teacher education type of education (Vermetten et al., 1999).
There were slight differences from past studies pertaining to the remaining clusters. Whilst previous researchers had classified scores that were above/below the mean as high/low respectively (Vanthournout et al., 2013), the current study characterizes scores that were within half a standard deviation away from the mean as average. The third cluster, D/S−, comprises students who have an average level of deep approach and a low level of surface approach. These are students who do not rely on unrelated memorization, is not syllabus bounded and may have no issues making sense of new concepts and ideas. What then does it mean to have an “average” deep learning approach as compared to a high deep approach? This cluster may differ from the D+/S− cluster in terms of the frequency and complexity of the deep approach (Kember, 2016). For example, a person who is in the D+/S− cluster may attempt to make connections throughout the course. He/she may be able to comprehend key concepts to a higher level of abstraction and connect these ideas to a network of topics that lend themselves to a better understanding. On the other hand, a person who is in the D/S− cluster may only occasionally attempt to make connections throughout the course. He/she may have an adequate understanding of the concepts as a whole but may not be able to generalize to other areas.
The fourth cluster D−/S comprises students who have a low level of deep approach and an average level of surface approach. This cluster may be construed as the inverse image of the D/S− cluster whereby students seldom attempt to understand and relate to the main concepts, yet do not approach learning with a pure memorization approach. Two aspects of this cluster are worth mentioning. First, whilst the score of deep approach was below average, an examination of the raw scores revealed that these scores could not be characterized as low, but rather middling. Second, conceptual and empirical grounds dictate that there should be a cluster with a low level of deep approach paired with a high level of surface approach (Meyer, 1991). Yet, in this study, this category was not specified, signifying that there are very few students who adopt a low deep-high surface approach. It can be hypothesized from these two observations that for various reasons, students in this cluster chose to invest minimal effort in their learning. At the same time, these students may also be aware of the deficiencies of a pure surface approach in meeting assessment demands. The possibility of student awareness may have been reinforced by the shifts in the local education landscape toward a greater emphasis on assessing higher order and critical thinking skills over the past decade (Ministry of Education, 2016).
These disparities in learning profiles with previous studies may be partly due to the methodology of the study. However, it is certainly logical that many students will adopt a neutral stance toward learning rather than a fully skewed deep or surface approach. Moreover, with interval level data, it is theoretically possible to place each learning approach on a continuum. A conceivable next step could be to conduct observations of different behaviors associated with the two learning approaches and ascribe them to certain points on the continuum.
Age and gender differences
To broaden our understanding of the clusters, statistical analysis was conducted to determine differences in age and gender across clusters. Results indicated that students in the D+/S− cluster are significantly older than students in the other clusters. This is in line with previous reports that age was positively related to a deep approach and negatively related to a surface approach (Lake and Boyd, 2015; Richardson, 2013). Two possible reasons, namely motivation and life experience, have been suggested as the most likely cause for this (Biggs, 1987; Lake and Boyd, 2015). The current study seems to support these reasons as the age gaps that occur may be because of individuals who had enrolled into teaching as a second career. These individuals are more likely to be intrinsically interested in teaching as a career, as compared to recent graduates who have not experienced any form of work. In addition, some of these students may be married with young children, thus, they are able to link their personal experiences with the course.
The results suggest that there is a relation between gender and the learning profiles of students. Specifically, there were proportionately more males in the D+/S− cluster and more females in the D−/S cluster. Of greater interest is the comparison with the other clusters that had an expected proportion of males and females. For example, if males have a greater preference for the deep approach, then we might expect to see proportionately more males in the D+/S+ cluster as well. On the other hand, if females have a greater preference for the surface approach, we might also expect proportionately more females in the D/S- cluster. However, this was not the case. The current results may provide an indication of why previous research on the relation between gender and specific learning approaches has been inconclusive (Baeten et al., 2010). More studies would need to be conducted before any conclusions can be drawn.
Conclusion
In summary, the present study has achieved the following: an alternative method to carry out a cluster analysis using a transformation of ordinal survey data to an interval level data was used to identify four different learning profiles centered on the conceptual definitions of deep and surface approach. There were differences in age and gender across these learning profiles. Additionally, using the Rasch Rating Scale model, items in the deep and surface approach subscales of RASI has been examined and found to be appropriate in the Singapore context. Nevertheless, some limitations were present that could not be addressed.
The study suffers from a lack of achievement indicators in the research as well as a lack of lack of generalizability in terms of its conceptual framework and sample selection. There were no indicators on academic performance in the study. This was partly due to the assessment format in which a substantial component was on group work and might not reflect individual achievement accurately, and also partly because a student’s approach to learning can be considered an ends to itself. Bearing in mind that the learning profile of students has an influence on their accomplishments, an achievement indicator would serve as an additional validity check on the accuracy of the alternative methods used. It would be worthwhile for future research to include some indicators to this end.
In addition, the framework adopted in this study incorporated cognitive processes, motivation, and affect as part of approach to learning. Other conceptualizations have included different aspects, such as personality traits (Biggs, 1987) or self regulation (Vermunt and Vermetten, 2004). Although the inclusion or exclusion of other aspects would have no impact on the methods, it is unclear whether the inclusion or exclusion of other aspects would lead to similar learning profiles. Lastly, the sample selection was specifically targeted at pre-service teachers at the post-graduate level and cannot be generalized to a wider population. Future research could perhaps use a similar method described in the study to examine various population groups.
To conclude, although there has been much discussion on ways to examine group differences in learning, there has been little focus in examining the rigorousness of the data analysis involved. Hopefully, the present study has contributed a small step toward this conversation.
Footnotes
Declaration of conflicting interests
The author declared no potential conflicts of interest with respect to the research, authorship, and/or publication of this article.
Funding
The author received no financial support for the research, authorship, and/or publication of this article.
Author biography
Chue Kah Loong received his Doctorate in Education with a focus on motivation and learning from the National Institute of Education, Nanyang Technological University, Singapore. In 2016, he was awarded the Tan Poey Quee book prize award for best dissertation. He is presently a lecturer at the same university where he teaches educational assessment, motivation and research methodologies. His current research interests include various aspects of educational assessment and measurement, as well as student well-being.