
Abstract
Our objective was to model process variation of Emergency Medical Service teams responding to simulated pediatric emergencies and determine if sequence alignment distinguishes performance quality. We performed a retrospective process analysis by watching and coding activities in videos from standardized simulations of 42 Emergency Medical Service teams. Teams were classified into high- or low-performing groups based on the Clinical Teamwork Scale™. Activities were coded according to resuscitation tasks, performer, and times. We used ClustalG to align task sequences within and between groups, and measured similarity. Teams within and between performance levels had an average sequence similarity of 52 ± 7% and 50 ± 7%. Teams performed clinically appropriate tasks that varied in prioritization, for example, performing compressions or connecting the EKG monitor early. There was no statistical difference in gross similarity between groups but specific differences in prioritization may have had clinically meaningful implications. Alignment could improve by accounting for task duration and concurrency.
Keywords
Introduction
Effective teamwork is considered important for managing and preventing adverse events that could harm patients (Manser, 2009; Schmutz and Manser, 2013). An important prerequisite for improving teamwork is being able to define and measure it. Teamwork is a multifaceted concept that includes technical performance and non-technical behaviors (Salas et al., 2005; Xyrichis and Ream, 2008). Technical performance refers to the physical task work that is performed to achieve a shared goal, such as cardiopulmonary resuscitation/chest compressions (CPR) and ventilation in responding to cardiac arrest. Non-technical behaviors include social interactions, such as leadership, closed-loop communication, performance monitoring, and orientation. The standard for evaluating teamwork has been to rate a combination of technical and non-technical behaviors with respect to performance (Dietz et al., 2014; Mishra et al., 2009; Undre et al., 2007). This approach allows experts to assign numerical values to observed behaviors for comparison. The drawback, however, is that it does not provide insight into how teams’ interactive processes lead to particular outcomes (Hickey, 2012).
Sequence alignment (SA) has been recommended as a method for studying team dynamics (Herndon and Lewis, 2015). SA is a visual analytical technique that lines up matching symbols across ordered lists to assess regions of similarity. It has predominantly been used in the biological sciences to measure the similarity between nucleic acid and amino acid sequences, identify functional conservation, and infer evolutionary relationships between species (Edgar, 2004; Felsenstein, 1988; Notredame et al., 2000; Sankoff and Kruskal, 1983; Thompson et al., 1994). Researchers in the social sciences have adapted this technique to describe similarity of activity performed by individuals, such as the sequence of chores performed in daily routine (Wilson et al., 1999; Wongchavalidkul and Piantanakulchai, 2015), order of locations visited by tourists (Shoval and Isaacson, 2007), and tasks in business processes (Bose and van der Aalst, 2010). SA could be applied in a similar manner to explore patterns of team activity that are associated with performance.
The goal of this study was to explore the suitability of using SA to model process variation and distinguish performance levels in EMS teams responding to simulations of pediatric trauma patients. Ambulance and Fire & Rescue teams are trained to follow highly structured, practice-based protocols (Ralston, 2006). While these protocols provide guidance on treating patients with different signs and symptoms, they leave task management to the discretion of the EMS providers. The motivation for using SA is that it would provide an objective framework for describing similarities and dissimilarities in activity sequences between teams for a given situation.
Materials
We analyzed 42 videos of EMS providers responding to a pediatric simulation. Teams had members from public fire departments and private transport agencies in a major metropolitan city. They reflected typical response teams, where there is a non-tiered response of Advanced Life Support from both public and private agencies. Fire crews had 3–4 members and transport crews had 2 members on average. These professionals had training that ranged from Emergency Medical Technicians (EMT) to paramedics, and all teams had at least one paramedic.
Simulations were conducted in situ using high-fidelity patient simulators, scene design, and professional actors playing parents and bystanders. All crews responded to the same simulated clinical case, in which a 6-month-old was unconscious and unresponsive after “falling” from a couch. Vital signs were set to indicate elevated intracranial pressure (ICP), consistent with “shaken baby syndrome.”
Clinical experts rated performance using the Clinical Teamwork Scale (CTS™). The CTS is a validated instrument that evaluates team skills along five dimensions: communication, situational awareness, decision-making, role responsibility, and patient friendliness (Guise et al., 2008). Clinical experts who use this instrument do not explicitly evaluate task sequence; they rate team behaviors along the five dimensions and assign an overall score, ranging from 0 (unacceptable) to 10 (perfect). Team behaviors are distinct from, but may contribute to, process variation.
Methods
We used ClustalG (Wilson et al., 1999) to align multiple activity sequences between groups of EMS teams. Ten (10) teams were labeled as high-performing (CTS ⩾8) and another 10 as low performing (CTS ⩽4). These groupings were established to evaluate if alignment techniques could distinguish teams based on technical performance. Activity sequences were created by coding patient-centric tasks that reflected EMS teamwork.
Coding teamwork
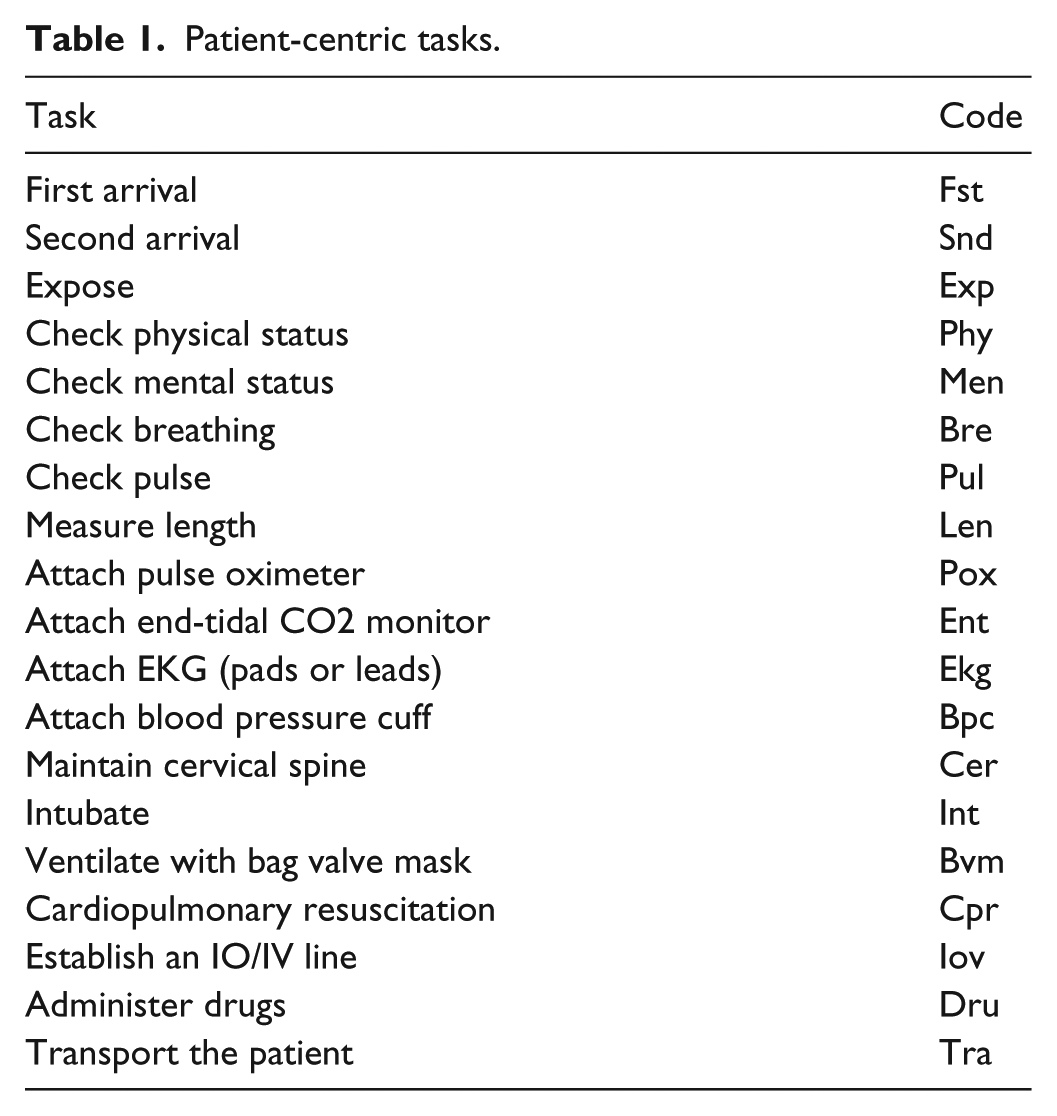
SA involves lining up matching symbols across ordered lists. In our analysis of simulation profiles, symbols correspond to resuscitation tasks performed and the lists contained the set of tasks performed by EMS teams. The coding framework, in Table 1 is based on tasks from pediatric resuscitation guidelines (Ralston, 2006) and feedback from clinical experts.
Patient-centric tasks.
One researcher coded tasks, performers, and times. A second researcher independently reviewed a sample to coding reliability. Agreement was defined as two codes specifying the same task, performer, and times (±2 seconds). The Jaccard coefficient was used to measure raw agreement as the intersection of agreed codes divided by the union of codes. Physicians board certified in pediatric emergency medicine provided the gold standard of expected tasks and times (mm: ss): check responsiveness at 0:00, check breathing at 0:10, check pulse at 0:15, start ventilation at 0:40, attach monitors at 1:30, and obtain intraosseous or intravenous (IO/IV) access at 2:30.
SA
The alignment, in Figure 1, illustrates how care processes can vary and be similar between teams. The matching symbols for checking pulse and breaths (Pul-Pul and Bre-Bre) suggest that teams perform these tasks in the same order. The mismatching symbols performing CPR or ventilation with bag valve mask (BVM) [Cpr-Bvm] represent a substitution and suggest that the teams performed different but comparable tasks. The symbol for establishing an intraosseous (IO) or intravenous (IV) route (Iov) is matched to a gap. This alignment is an indel, or insertion/deletion. It suggests that either team 2 inserted an Iov task or team 1 deleted an Iov task in their respective process.
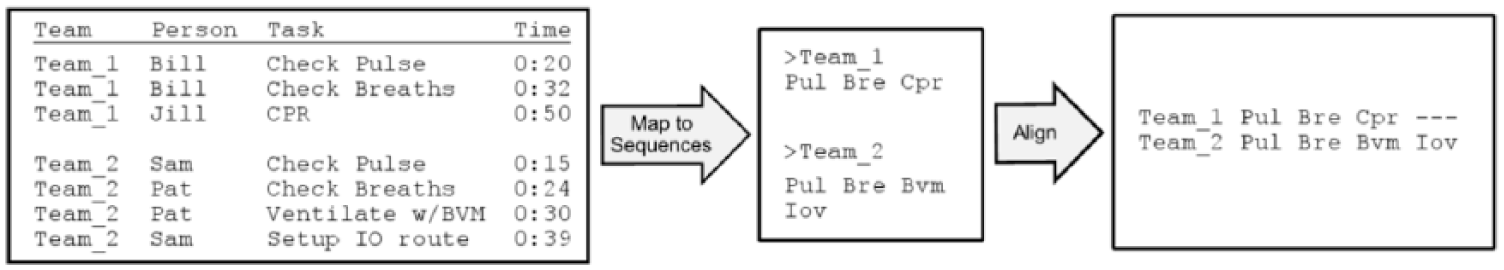
The process of aligning EMS tasks from observation.
We used ClustalG to perform multiple alignments on the activity sequences. Multiple alignments occur in three steps: (1) compute distance matrix for similarity between all sequences pairs, (2) construct guide tree from the distance matrix, a hierarchical data structure that groups sequences by similarity, and (3) progressively align sequences according to the guide tree. Wilson et al. (2005) created ClustalG to align generic activity sequences in the social sciences. It works on user-defined symbols in addition to symbols that represent nucleic and amino acids. In the literature, guide trees have been used to classify types of tourists (Shoval and Isaacson, 2007) and the multiple alignments to highlight conserved and missing activities (Bose and van der Aalst, 2010).
We analyzed the guide tree clusters to see if they could classify different care delivery strategies. This involved visually inspecting the guide trees and using internal validation metrics from clValid (Brock et al., 2011) to identify teams with similar patterns of activity. After aligning the sequences within and between performance levels, we extracted and compared conserved tasks, or tasks that are aligned across ⩾50% of the teams. These tasks describe the general protocol teams followed and differences based on levels of teamwork.
Results
Coding teamwork
Inter-observer raw coding agreement was 66% (62/94 codes) across a sample of simulations. Of the 32 disagreements, 11 corresponded to minor timing differences that had no effect on the order of tasks or subsequent alignment. Of the 32 disagreements, 5 occurred due to differences in granularity, primarily for CPR compressions and BVM ventilations. For example, a paramedic may stabilize the cervical spine between BVM ventilations. This activity could be interpreted as one contiguous application of BVM or two applications of BVM, interrupted. In all, 16 disagreements occurred due to insertions and deletions. Some tasks, such as pulse and breath checks, were difficult to detect because they were occluded from view or occurred implicitly through visual observation. Considering only those disagreements that could affect the sequence alignment, the raw agreement is 78% (73/94 codes). We considered this an acceptable level of agreement for subsequent analysis.
The 42 simulations had a median of 29 ± 3 activities, with a minimum of 16 and a maximum of 51. Low-performing teams had a median of 28 ± 5 activities and the high-performing teams had a median of 27 ± 3 activities. The activities were not normally distributed and there was no significant difference between performance levels according to the Mann–Whitney U test.
Table 2 shows the frequency of activities in all teams, and the low-performing and high-performing groups. Teams performed the same tasks with the same frequency, with slight differences. Low-performing teams made more attempts, attaching the end-tidal CO2 monitor and applying CPR. High-performing teams exposed the child for physical assessment and maintained cervical spine more frequently. These differences were within one deviation of the other across performance groups. In other words, performance could not be attributed to task frequencies alone.
The median ± median average deviation of task frequencies for all teams, low-performing (LP) teams, and high-performing (HP) teams.
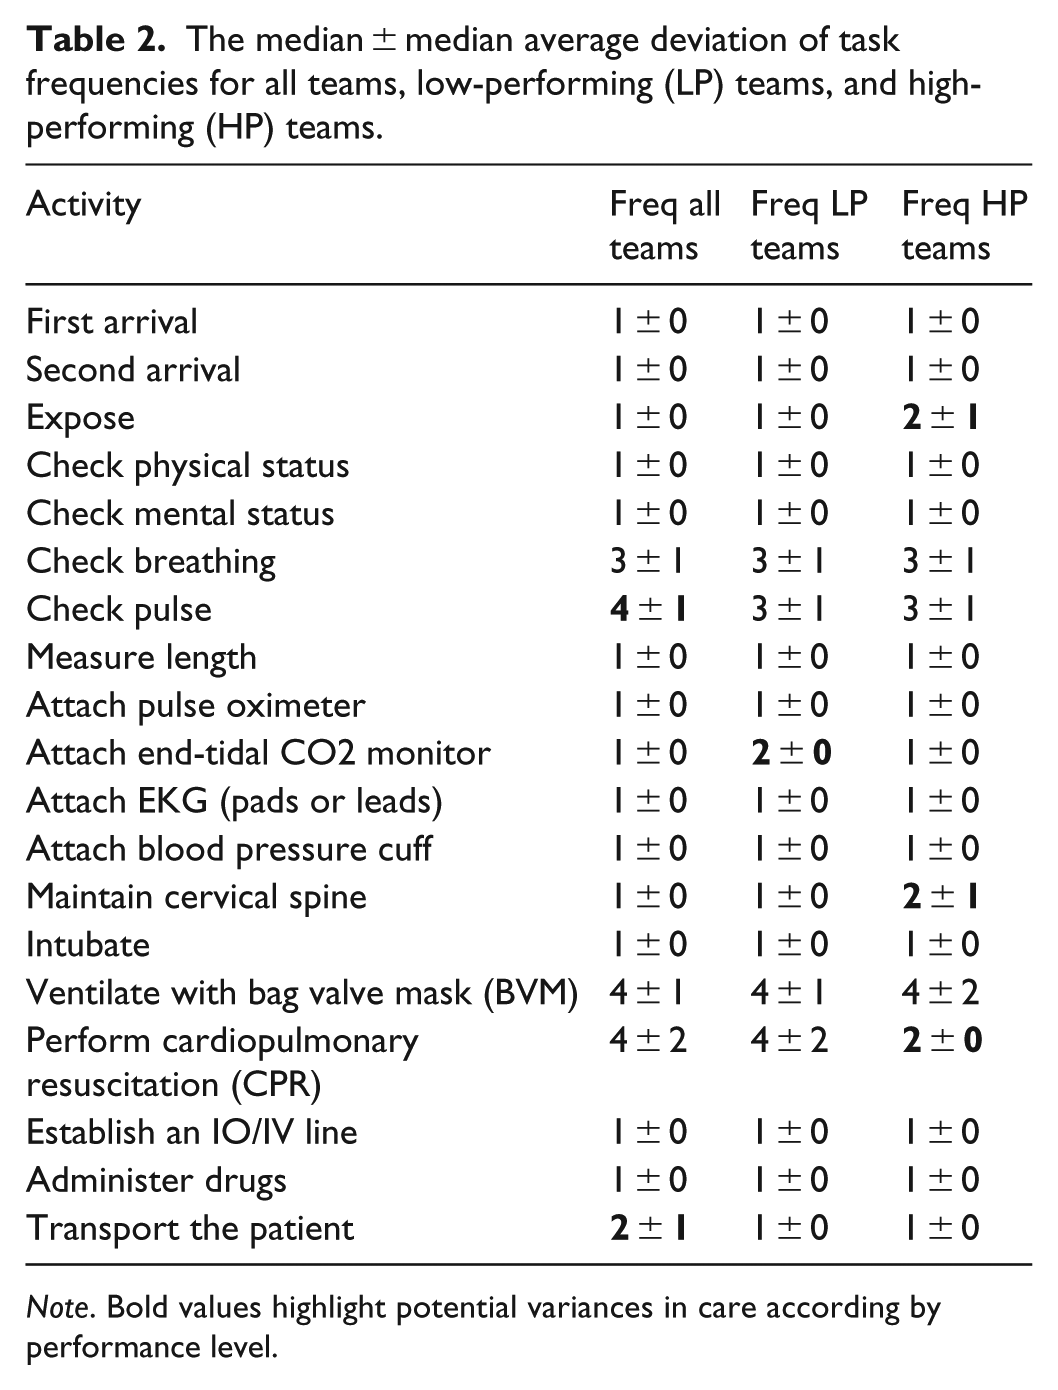
Note. Bold values highlight potential variances in care according by performance level.
SA
Task sequences were highly varied. Intragroup similarity for 10 high- and 10 low-performing teams were 52 ± 7%. Intergroup similarity scores was 50 ± 7%. There were no meaningful clusters within performance level according to the internal validation metrics: connectivity, Dunn Index, and silhouette widths. This means that the teams were not performing a distinguishable set of strategies in treating the simulated pediatric patient. These results suggest that team processes varied regardless of performance and that major differences could be attributed to a few key tasks.
Figure 2 presents a three-part excerpt of the multiple alignments between low- and high-performing teams. Panel 1 shows the raw alignment between task sequences. Panel 2 shows that many tasks, highlighted in orange, varied across teams. Panel 3 shows that some tasks, highlighted in green, are aligned across ⩾50% of the teams. These aligned tasks appear to have a conserved order and represent an underlying protocol that teams try to follow. We used these conserved tasks as the basis for comparing processes in the high- and low-performing teams.
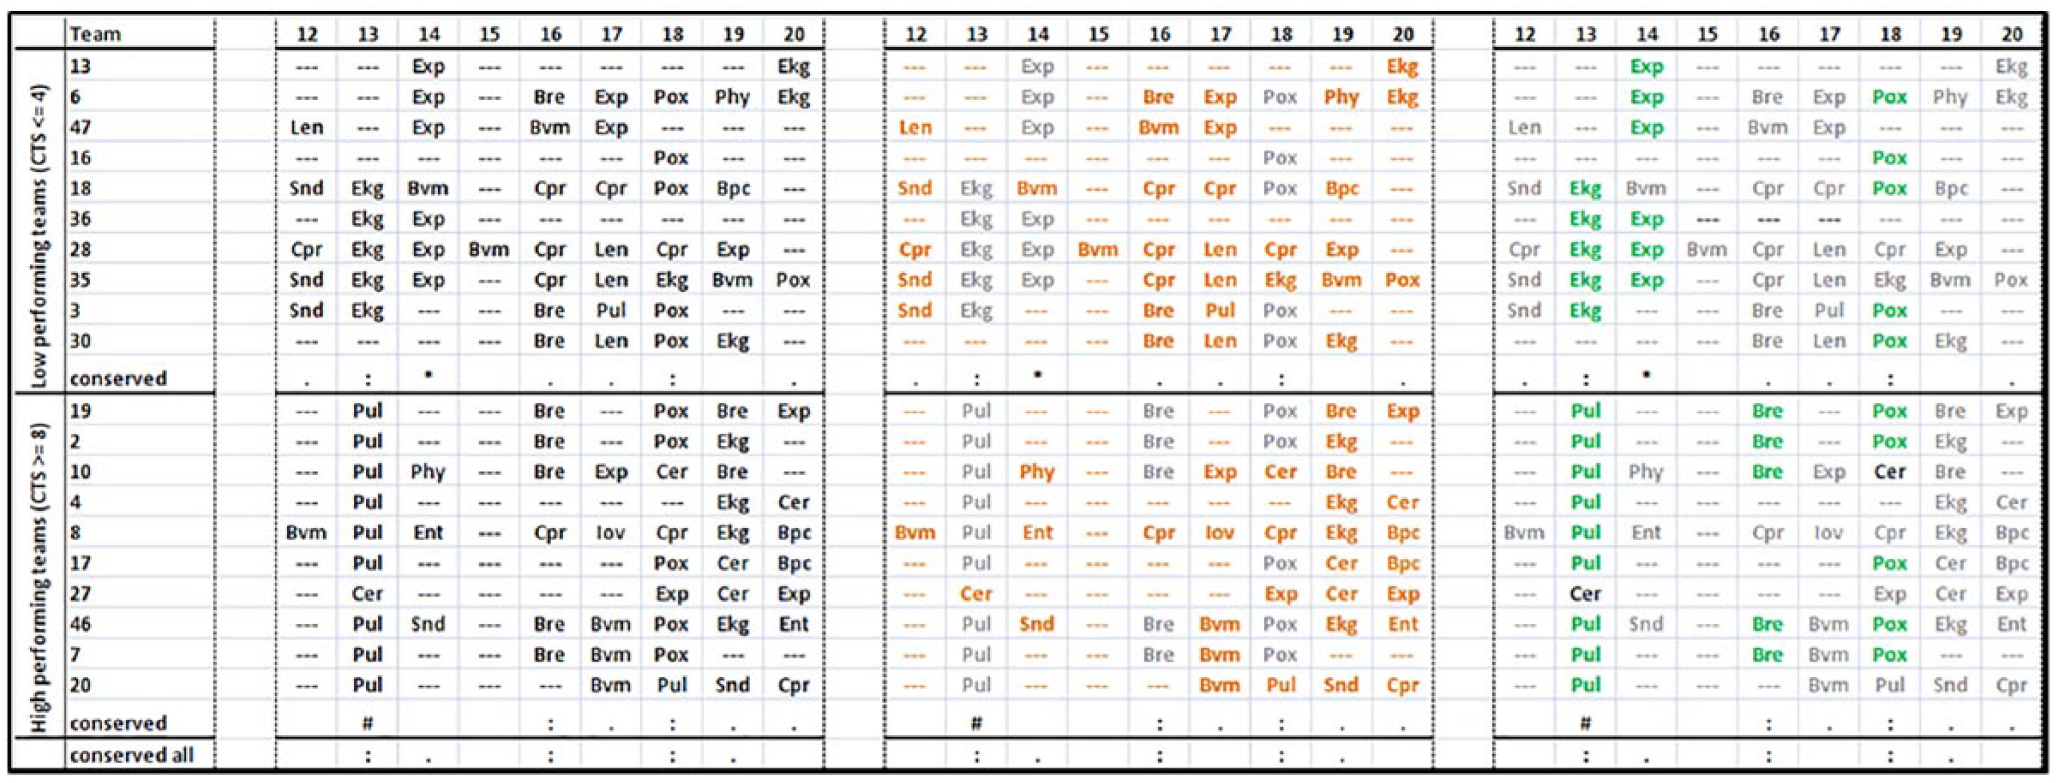
A three-panel excerpt showing (left) the raw alignment, (middle) varied tasks, and (right) conserved tasks across low- and high-performing teams.
Figure 3 describes tasks conserved in ⩾50% of teams, times they were performed and occurrence with respect to the gold standard. Low-performing teams set up the EKG monitor, exposed the patient, and checked breathing earlier than high-performing teams. On average, low-performing teams started CPR before BVM, with BVM starting much later in some cases. These tasks occurred in opposite order according to the recommended pediatric care guidelines. High-performing teams applied BVM before CPR, established an IO/IV line, and transported the patient, once stabilized. Half of the low-performing teams, in contrast, transported the patient early in the simulation. They had more conserved tasks and most tasks were performed earlier than the low-performing teams.
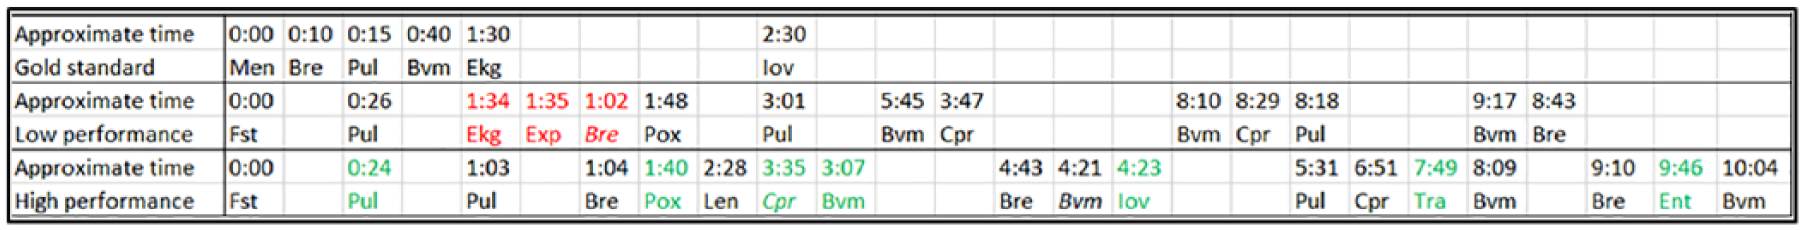
Simplified version of multiple alignment showing conserved activities and average time at which they occurred.
Discussion
We explored the suitability of using alignment techniques to distinguish the levels of performance between EMS teams responding to pediatric trauma simulations. We did so by (1) observing and coding the treatment they provide, (2) mapping the codes onto a sequence, and (3) aligning the sequences across teams. The teams perform approximately the same number of tasks and teamwork scores were not associated with the observed process variation. Gross differences were not apparent, but SA helped identify the prioritization of particular tasks that were clinically meaningful.
For example, chest compressions are emphasized in resuscitation for adults, but ventilation is given priority over compressions in children. The multiple alignments highlighted tasks that appeared to be conserved across teams in terms of task sequence order. Both high- and low-performing teams checked pulse and breathing before performing cycles of CPR and BVM ventilation. However, high-performing teams performed BVM earlier, perhaps due to correctly recognizing and treating the underlying cause of increased ICP due to trauma or understanding that ventilation is the first response to pediatric arrests. The low-performing teams focused on other tasks such as setting up the EKG monitor for preliminary assessment and delayed BVM ventilation. This suggests that the low-performing teams may have been following adult guidelines instead of pediatric guidelines.
We identified several limitations in using SA to operationalize teamwork and to associate it with performance. First, we observed substantial process variation, which added noise to the alignments. This could be attributed to the degrees-of-freedom by which teams can observe symptoms, diagnose problems, and treat underlying causes. For example, any combination of team members can check pulse, breathing, physical status, mental status, or attach equipment to track vitals. Once an anomalous reading is observed, they can then choose to treat, medicate, or transport. These systems of activity have a certain tolerance for variation in behavior, but can be sensitive to isolated events. For example, pulse checks occur frequently and dominate the alignment, but delayed ventilation can cause the patient to deteriorate and require more care to stabilize. SA was not developed to analyze complex in which tasks can be performed concurrently over time.
A second limitation is that not all aspects of teamwork are encoded in the task sequence. We identified pairs of teams that performed a similar sequence of tasks but had different levels of performance on the CTS. In one case, Teams A and B had a similarity of 71% but CTS of 1 (poor) and 5 (fair), respectively. Team A, rated as having poor teamwork displayed little communication, whispered, and had BVM errors. Team B, rated as having fair teamwork had adequate communication, but administered a 10-fold overdose of epinephrine. In another example, Teams C and D had 53% similarity with CTS scores of 8 (good) and 4 (fair) respectively. Team C started BVM and ETCO2 early, while team D used an oxygen mask instead of BVM and intubated without attaching the pulse oximeter, which is used to monitor oxygen intake. In these cases, indicators of performance depended on communication and task quality, which were not encoded in the task symbols. Future research in comparing team processes could benefit by encoding errors and quality of performance.
In healthcare, there is an underlying theory that compliance with practice-based guidelines limits process variation and risk of patient safety events (Sutton et al., 2014). Compliance can be difficult to evaluate as the diversity of teams allows for work to be carried out in many different ways. SA is a promising method that can be used explicitly and systematically compare clinical processes. However, there are some limitations as the underlying algorithms are not calibrated for human or systems-based activity. More work is needed to adapt it to the analysis of healthcare activities.
Conclusion
SA is a promising tool for describing variation in team behavior. The alignment revealed distinct patterns of activity that could be used to explain the difference in performance levels across teams. We find that it can be used to identify conserved tasks and points of deviation that could explain the difference in performance across teams. Furthermore, it can be used to develop more accurate process models based on actual data. However, SA requires improvements to account for the temporality, concurrency, and quality of team activities. Once refined, the SA method could provide a more objective approach toward studying complex activity in clinical systems.
Footnotes
Declaration of conflicting interests
The author(s) declared no potential conflicts of interest with respect to the research, authorship, and/or publication of this article.
Funding
The author(s) disclosed receipt of the following financial support for the research, authorship, and/or publication of this article: This work was supported by the National Institutes of Health (R01 HD062478) and the National Library of Medicine (T15M007088).