
Abstract
Recently, the idea of ‘data fusion’, that is, of combining different types of data, became quite popular because of the advances of new technologies. In particular, several studies started investigating the possibility of combining survey data with other data types in order to get a more complete or accurate picture of the reality and/or to reduce survey burden. One key element, then, is the willingness of people to share different types of data, beyond survey answers. In this article, we investigate to what extent members from an opt-in online panel in Spain are willing to share different types of information that have in general not been studied before in the literature: records of their surrounding sound (audiotracking), information from their email inbox (in different ways, sharing the email credentials, using an email plug-in or redirecting emails, partially or totally), sensorial reactions measured by a wearable device (neuroscience) and public information about them available online. We use a choice-based conjoint analysis in order to study the level of willingness depending on the incentives offered in exchange, and we present the level of willingness by gender and age groups. Overall, we find huge differences in the level of willingness across data types. Increasing the incentives, on the contrary, does not improve the willingness so much, even if there is a positive trend. Some differences are observed across gender and age groups but most of them are not statistically significant.
Keywords
Introduction
According to the AAPOR Standards Committee (2010), the majority of online research is based nowadays on non-probability (also called ‘opt-in’) panels. Opt-in online panels were built mainly to migrate offline survey-based research to the Internet; cost reduction and increased speed were the main drivers of such migration. But recently, in particular because of the advances of new technologies, a discussion started about the possibility of using members from these panels to ask them to complete other tasks than surveys or share, actively or passively, other types of information, for instance, GPS records or pictures of the products they bought.
This is attractive because it could both provide more complete and/or accurate data (avoiding problems of human memory limitations) and reduce the efforts needed and cognitive burden of the panellists (e.g. by reducing the number of survey questions asked). In addition, all this could be done at a relatively low cost.
Therefore, there is a growing body of literature comparing the results obtained in different research areas when using survey data or alternative data types. For instance, Kooreman and Scherpenzeel (2014) do this for measures of body mass, while Greenfield et al. (2014) do it for alcohol consumption, and Lathia et al. (2017) to link physical activity and happiness.
In addition to the accuracy of the results, another key aspect is the willingness of people in sharing data beyond surveys. This literature contains both studies based on the stated willingness and studies based on the actual/observed willingness. In the first case (stated willingness), people have been asked, usually within a survey, about their (hypothetical) willingness of participating in different kinds of projects besides answering surveys (e.g. willingness in testing products and reporting later about their experience, or willingness in participating in focus groups online or offline), and/or their willingness of sharing different kinds of data (e.g. willingness to share GPS data or accelerometer data). Then, researchers study generally the proportions of respondents who have stated that they would indeed accept to participate in such a project. In the second case (actual/observed willingness), people have been asked to really participate in such projects. Thus, the researchers observe the actual participation rates.
Most of this research focus on the following data types:
Biomarker measures (see, for example, Avendano et al., 2011; Crawford et al., 2013; Etter and Bullen, 2011; Gatny et al., 2013)
GPS data (see, for example, Armoogum et al., 2013; Biler et al., 2013; Toepoel and Lugtig, 2014)
Accelerometer data (see, for example, Scherpenzeel, 2017; Schlosser and Höhne, 2018)
Visual data, for example, images, photos, shopping receipts (see, for example, Bosch et al., 2018; Jäckle et al., 2017; Revilla et al., 2016; Wenz et al., 2017)
Passive/behavioural data coming from a tracking software or ‘meter’ installed on the PCs, tablets or smartphones of the participants (see, for example, De Reuver and Bouwman, 2015; Kissau and Fischer, 2016; Revilla et al., 2017; Van Duivenvoorde and Dillon, 2015)
Few studies considered other data types: for instance, Harari et al. (2016) studied the willingness within a group of college students of sharing their Web-browsing history or information from their social media account.
In addition to the levels of acceptance of sharing different types of data, some studies examine differences between those who are or are not willing (Armoogum et al., 2013; Jäckle et al., 2017; Keusch et al., 2017; Revilla et al., 2016; Wenz et al., 2017) and some also consider the reasons behind the decision of accepting or not to share different data types (Pinter, 2015; Revilla et al., 2018).
This literature reveals considerable variations in willingness depending on the types of data (see, for example, Wenz et al., 2017), if these data are self-reported or passively reported to the researchers (see, for example, Revilla et al., 2018) and the level of privacy concerns (see, for example, Jäckle et al., 2017). It also suggests that characteristics of the studies, in particular, the sponsor (university vs market research) and if the studies include incentives, could play a role in the level of acceptance (see, for example, Keusch et al., 2017). However, very little is known about the impact of varying the incentives levels.
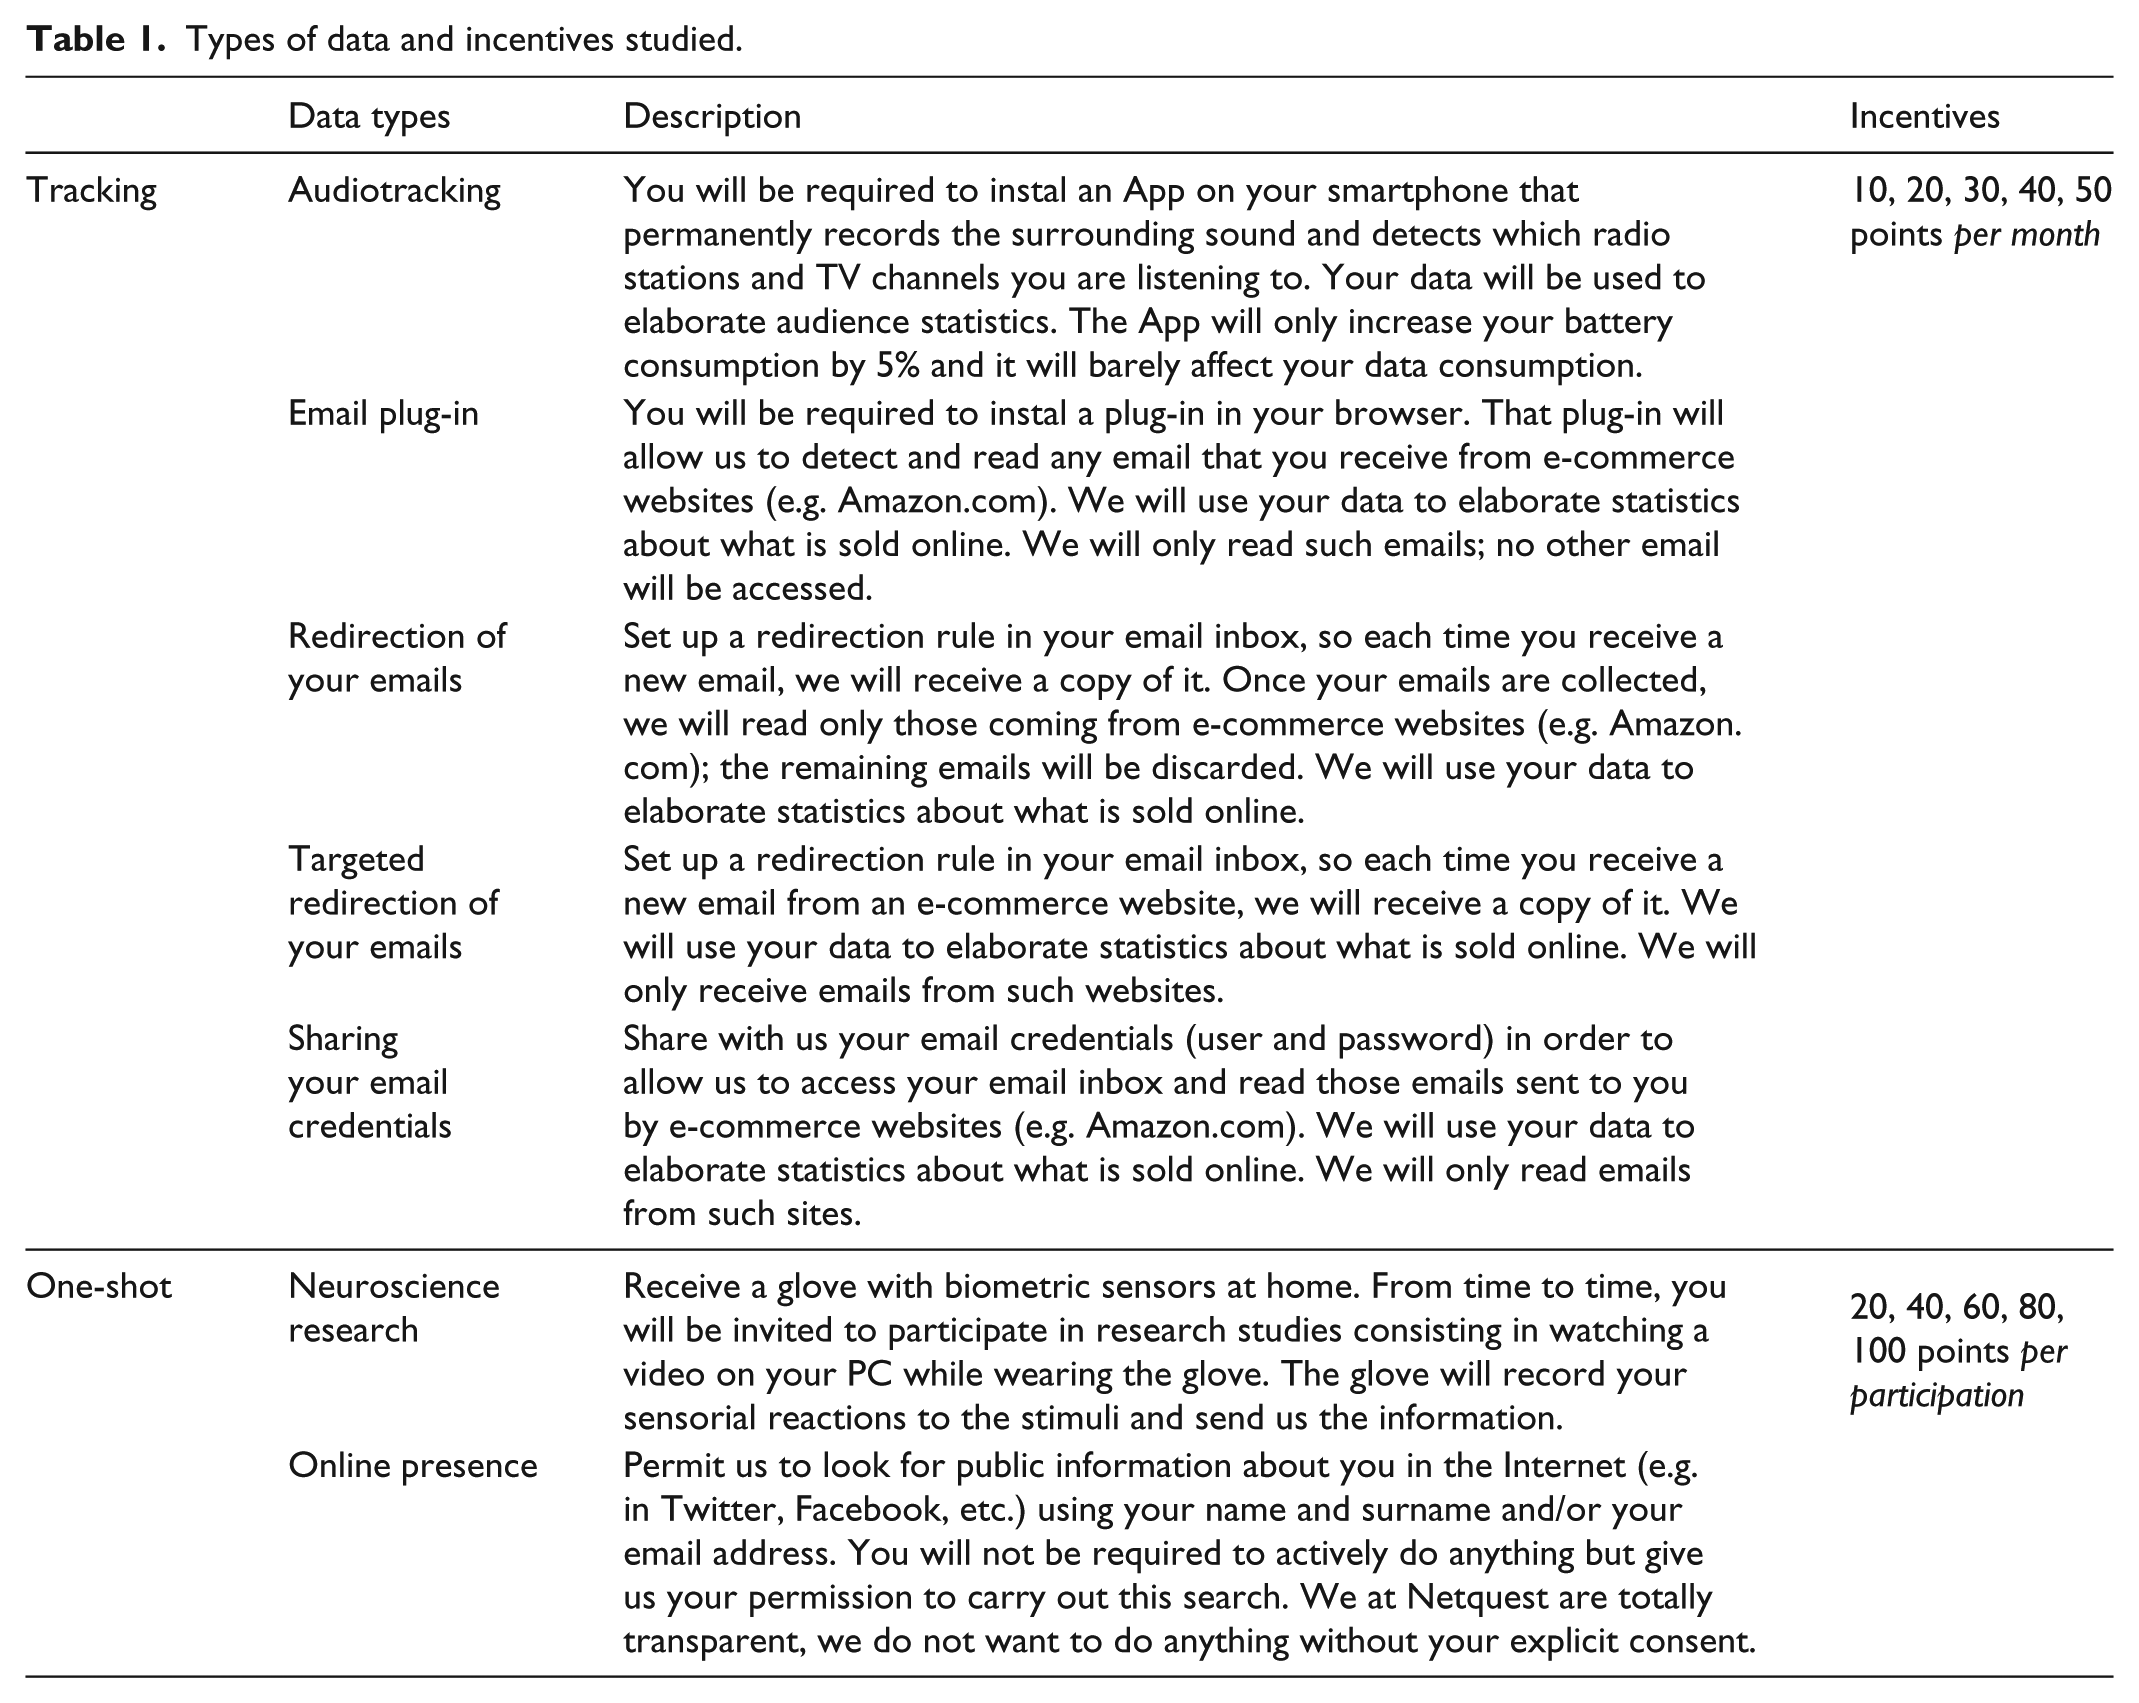
This article adds to this literature at several levels. First, it focuses on types of data to which little attention has been paid in previous literature, if any: audiotracking, different ways to share email inboxes, biometric data for neuroscience experiments and tracking online public information (see Table 1 for a detailed explanation of each one). Second, it explicitly tests the impact of varying the incentives. Third, it investigates differences across gender and age groups. Finally, we use a different technique to study the willingness: indeed, the results come from a choice-based conjoint experiment, where respondents are asked several times in a row in which of two options (data types shared in exchange of a given incentive) they would be most willing to participate. A ‘I would not participate in any of these two projects’ category was also proposed. This approach presents several advantages (discussed in the section ‘Method: a choice-based conjoint’).
Types of data and incentives studied.
Our focus is on stated willingness, rather than actual compliance with the request. As a consequence, the levels of willingness obtained might be higher than the actual compliance. However, research has shown that stated willingness is a useful measure in its own right (see, for example, Couper et al., 2010; Couper and Singer, 2013).
Overall, our main goal is to measure the level of willingness to participate in seven new types (i.e. non-survey) of data collection projects and study how much incentives should be offered to panellists in exchange of different data types. This study is a first step to evaluate how feasible other data collection methods are (in terms of levels of participation expected and costs that the projects would have) and how worth it can be for online fieldwork companies to invest in them.
Methodology
Method: a choice-based conjoint
Conjoint analysis is a survey-based technique originally developed in the early 1960s (Luce, 1959) to investigate how buyers make trade-offs among competing products and services and to measure customer preferences. In particular, conjoint analysis helps to determine which characteristics of products or services are important to consumers (Green and Srinivasan, 1978). To do so, products or services are broken down into a limited number of relevant attributes, each with a limited number of levels. An attribute corresponds to a feature or characteristic that makes up an individual product or service, whereas a level corresponds to the possible values an attribute can take.
Nowadays, most current conjoint analyses use a choice-based method, also known as discrete choice conjoint analysis (Louviere and Woodworth, 1983). This conjoint analysis aims to measure the relative effect that each attribute-level has in the preference of consumers by asking about complete products (combinations of attribute-levels) instead of separate attribute-levels. In choice-based conjoint, the questionnaire shows a set of different product profiles, each made up by selecting levels from the attributes according to an experimental design plan. The respondents are asked to select the preferred profile, instead of rating each product profile separately. The task is repeated with different profiles. Those attribute-levels that occur more frequently in products that are preferred must be the most relevant ones for the decision-making process.
To determine to what extent each level drives the choices, the set of responses across the set of respondents can be regressed against the attributes and levels (Luce, 1964). In choice-based conjoint, a discrete choice model (a mathematical relationship between attribute-levels’ worth and choice decisions) is used.
In this article, we use a Mixed Logit Model to analyse the results, because it allows for individual attribute-level’s utilities per respondent. We define the respondent utility as the net benefit (a numeric positive or negative value) that each attribute-level provides to the respondent. The sum of the utilities of the attribute-levels that form the product provides its overall utility. We assume that each respondent chooses the product that offers him or her the highest utility. For a more extensive review of these concepts, we refer to Green and Srinivasan (1990) or Louviere (1988).
In this study, products are defined as a combination of two attributes: the type of data to be shared and the incentive offered in exchange. Thus, while a typical conjoint questionnaire asks respondents whether they would buy a product at a certain price, in our experiment, we ask respondents whether they would accept to share a given type of data at a given incentive level.
Willingness to participate is usually measured by direct questions (e.g. ‘would you be willing to share your GPS data?’ or ‘on a scale from 0 to 10, to what extent would you be willing to share your GPS data?’). To study the willingness associated with different incentive levels, then, a direct question for each incentive level and data type should be asked (e.g. ‘would you be willing to share your GPS data in exchange for X points?’). This quickly produces an explosion of the number of required questions, leading to repetitive and long surveys, and potentially high abandon rates and/or low data quality. Furthermore, if several options get the same response (e.g. a respondent says ‘5’ to sharing his or her GPS data in exchange for 20 points and ‘5’ to sharing his or her email credentials in exchange of 30 points), nothing can be said about which option is the respondent’s preferred one.
By using a choice-based conjoint analysis, we try to overcome these limitations. First, these kinds of models presumably have an advantage in predicting choice behaviour (Elrod et al., 1992). Second, utilities for each data type and incentive level can be combined to predict willingness to participate for different scenarios, both at individual and aggregated levels, including scenarios that were not in the questionnaire. Finally, we may benefit from other known advantages provided by this technique: for instance, accounting for the trade-off process that individuals make when evaluating several attributes together, or uncovering of real or hidden drivers which may not be apparent to the respondents themselves (Agarwal et al., 2015; Huber, 2005; Orme, 2010).
Some limitations of this technique have been identified as well (Bradlow, 2005). For instance, the number of levels that make up an attribute used in a conjoint design influences the inferred attribute importance, known as the ‘number of levels effect’ (Johnson, 1992). However, these limitations have only an impact if there are many attributes and levels (De Wilde et al., 2008; Miller, 1956; Von Wright et al., 1975), which is not the case in this study.
Two attributes of interest: Types of data and incentives
Our main goal is to evaluate the level of willingness to share new types of data (that are not survey answers), depending on the level of incentives provided in exchange.
We classify the new types of data studied into two groups: tracking (the data are shared over time, and the participants are rewarded monthly) and one-shot data sharing (the data are shared occasionally, and the participants are rewarded immediately after the data were shared). In the first group, we consider five types of data: audiotracking, email plug-in, redirection of your emails, targeted redirection of your emails and sharing your email credentials. In the second group, we consider two types of data: neuroscience research and online presence. We expect participants to be more willing to share one-shot data types than tracking data types, which require a continuous collaboration. Besides, we expect the data types with lower privacy concerns to be more accepted (e.g. targeted redirection of emails is expected to be more accepted than total redirection).
In terms of incentives, the panel used for this research (Netquest) usually offers to participants points for participating in surveys, that can be redeemed to get gifts (e.g. panellists could get a cinema ticket with 155 points in March 2018). The number of points offered for survey participation depends on the estimated length of the survey. It varied from 4 to 58 with a median of 12 across 186 surveys administered to Netquest panellists in Spain in 2016 (Revilla, 2017).
We tested five incentive levels in this study. However, due to the different nature of both groups (tracking vs one-shot), incentive levels were defined separately: 10, 20, 30, 40 and 50 points per month for tracking, and 20, 40, 60, 80 and 100 points per participation for one-shot data sharing. These levels were defined to meet panellists expectations in terms of what their data and efforts are worth (using the usual survey incentives as baseline), while keeping the costs of data collection acceptable/realistic. For different panels/countries, where the usual incentives are lower/higher, the levels would need to be adjusted. We expect that higher incentives will lead to higher levels of willingness.
Table 1 presents the seven types of data studied and the description shown to participants in each case, as well as the incentive levels tested.
Experimental design and questionnaire
Separate conjoint experiments were run for tracking and one-shot data sharing. The main reason is that the incentive levels are not directly comparable (monthly incentive vs incentive per participation).
Products for the tracking conjoint experiment are defined as combinations of two attributes (tracking type of data and monthly incentive level) with five levels each. For the one-shot conjoint experiment, products are defined as combinations of two attributes as well (one-shot type of data and per-participation incentive level) with two levels for the first and five for the second.
Participants were randomly assigned to one of the two conjoint questionnaires (available, in Spanish, at https://ww2.netquest.com/respondent/glinn/willingness2017/). The questionnaires were optimized for mobile devices. However, vertical scrolling or zooming out were usually necessary on smartphones in order to see all the information of a given question. It was compulsory to answer all questions to go on and it was not allowed to go back; this is a common practice in market research surveys, so the panellists are used to it.
Each questionnaire consisted in 10 questions. The first eight questions were the conjoint questions, asking to choose between two data types (proposed at a given level of incentive) and the option ‘I would not participate’. An example of such questions is presented in Figure 1 (layout for a PC screen and a smartphone screen).
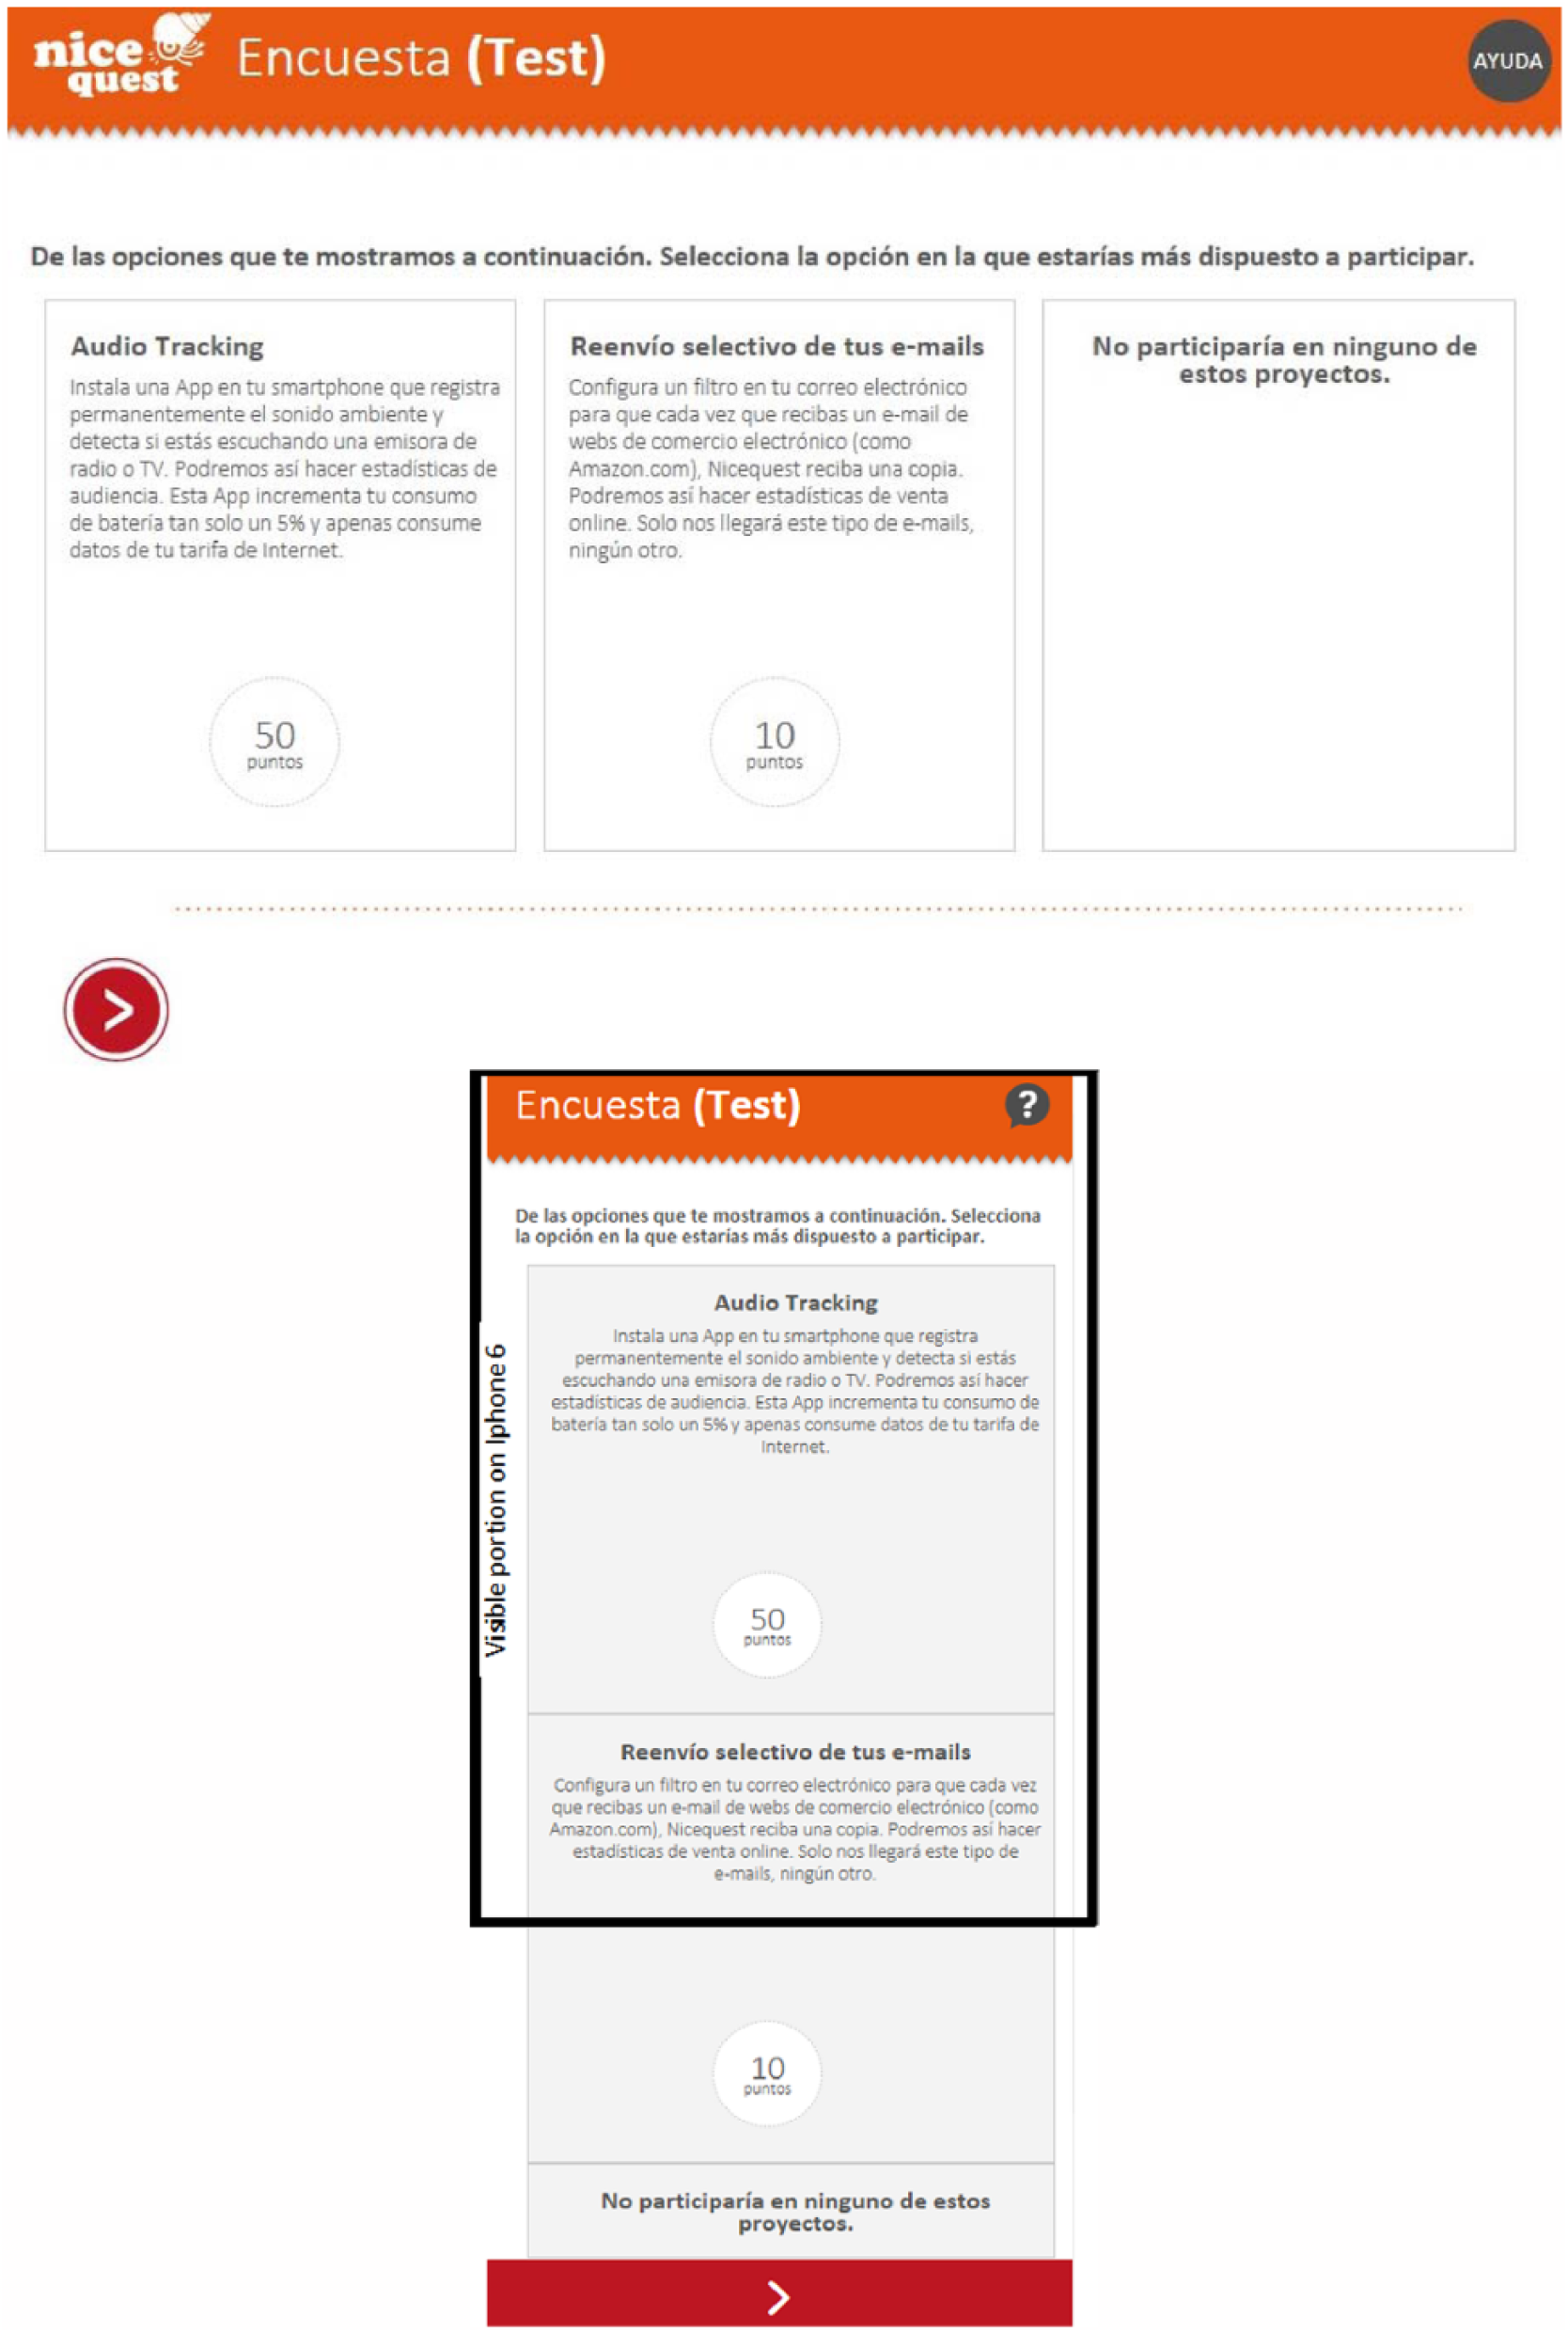
Example of conjoint question, as seen from a PC (up) and a smartphone (down; the black square indicates the part visible without scrolling down).
The different options shown in each question to each participant (i.e. combination of a data type and an incentive) were designed to optimize D-efficiency as defined by Kuhfeld (2010), by means of a proprietary algorithm that follows the general method for constructing efficient choice designs, as described by Zwerina et al. (2010). Further information of the experimental detail can be found in Appendix 1.
The final two questions were direct yes/no questions (‘Would you participate in this activity?’ and ‘And in this one?’). They asked about audiotracking and redirecting your emails, with an incentive of 50 points per month for tracking, and neuroscience research and online presence with an incentive of 100 points per participation for one-shot data sharing.
The questionnaire did not include questions about the respondents’ background characteristics. However, we had information already stored by the panel about their gender and age.
Data collection
The data were collected using the Netquest panel in Spain in 2017 (22–25 February). Netquest (www.netquest.com) is an online fieldwork company present in the United States and the main countries of Europe and Latin America. The panel in Spain exists since 2005 and in March 2018 counted 203,581 active panellists, as defined in the ISO26362 norm.
A sample of 800 panel members was recruited, by offering the survey to panellists who were screened-out from other surveys before beginning them, due to a quota sampling control. Since all kinds of surveys are going on at the same time (each with different target populations and quotas), there is no reason to expect a specific bias due to the screening. This in-advance redirection was performed by a software known as a sample router, which aims to optimize the sample usage, avoiding unneeded invalid participations.
No quotas or filters were set up in order to achieve a particular sample distribution, beyond a total limit of 800 participations. In other words, the sample composition in terms of age, gender and other socio-demographic variables was not designed in advance, but a result of the regular activity of the panel during the period in which the fieldwork was carried out (see ‘Gender and age distributions’ section for more details). Thus, we cannot expect this sample to be representative of the (Internet) population: this is one of the main limits of this study.
The questionnaire was started by 850 participants; 50 of these abandoned the survey 1 (i.e. 5.9%), leading to a final sample size of 800 (which was the objective fixed). Of these 800 participants, 404 completed the conjoint questionnaire about tracking data types and 396 completed the one about one-shot data types; 71.5% of the respondents completed the survey using a PC, 3.9% using a tablet and 24.6% using a smartphone.
Analyses
First, we conduct some preliminary analyses. Since we did not control the sample composition (no quotas), it is important to get an idea of who is in our sample. Therefore, we look at the distributions of gender and age groups for the tracking and for the one-shot experiments. In addition, in order to evaluate to what extent the conjoint analyses match the direct stated willingness to participate, results from the eight conjoint questions are compared to the answers from the final two direct questions. However, if differences are found, we cannot know which of the two methods provides better data. In order to evaluate this, we would need to compare with the actual participation obtained when implementing such special projects and asking to share the different data types. Still, these preliminary analyses give an idea to what extent our results can be compared to previous literature based on direct questions (even if we should be careful since the position and format of the direct questions in this study – after the conjoint questions, and using a quite similar layout – makes it different from other research about willingness using direct questions too).
Second, we turn to our main findings. Both conjoint experiments are analysed separately, using proprietary implementation of a Hierarchical Bayesian analysis as developed by Allenby (1997) and generalized by Train (2001): the utilities for each data type and incentive level are estimated at the individual level. The option ‘I would not participate’ is considered a product in itself, with its own utility. Average utilities for the samples are reported. In addition, the conjoint analysis offers a simple way to measure the willingness to share different types of data, at different incentive levels. Indeed, individual utilities can be used to estimate the expected willingness to share each data type at each possible incentive level. To do so, for each individual, the sum of utilities of each data type and incentive level must be compared to the utility of the option ‘I would not participate’. A multinomial mixed model is used to evaluate the individual probability of acceptance.
Results
Preliminary analyses
Gender and age distributions
First, we look at the sampling composition in terms of gender and age. Participants’ age ranged from 18 to 64 years old; therefore, we use these limits for the age groups. Table 2 shows, separately for the tracking group (n = 404) and the one-shot group (n = 396), the proportions of men and women, and the proportions of respondents in different age groups. In addition, it provides information about the gender and age composition of the whole Netquest panel in Spain (members from 18 to 64 years old, as in March 2018).
Sample composition in terms of gender and age group (in %).
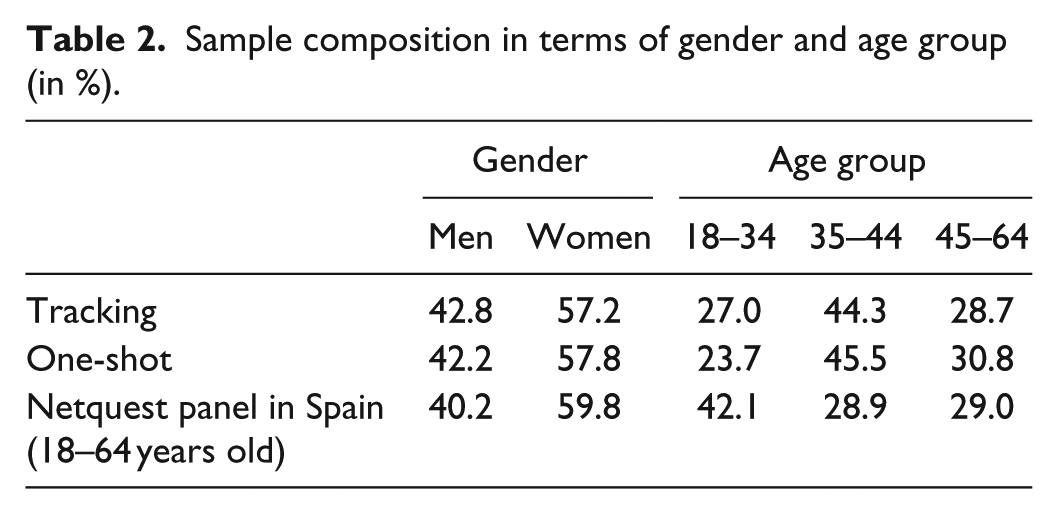
First, the composition in terms of gender is similar for tracking, for one-shot and in the whole panel. Second, both for tracking and one-shot data types, the 35–44 years old are most represented in the sample, with a clear over-representation compared to the whole Netquest panel, whereas the 18–34 years old on the contrary are under-represented in the sample, compared to the overall panel. We will therefore present all the following results by gender and age groups, since the total could be affected by the specific composition of the sample. Indeed, previous research found that age and gender have significant effects on the willingness to share some data types (see, for example, Revilla et al., 2018; Wenz et al., 2017), so it could be the case for the ones in this study too.
We can also note that there are no significant differences in proportions (5% level) across the two samples (for tracking and for one-shot), suggesting that the random assignment to one or the other conjoint questionnaire worked properly.
Conjoint versus direct questions
Then, in order to get an idea of how the results can be affected by the use of a conjoint analysis instead of direct questions, Table 3 shows the differences between the estimated levels of willingness to share different data types at the maximum incentive level when using the data from the conjoint questions and when using the direct questions.
Differences in the estimated levels of willingness to share different data types at the maximum incentive level between conjoint estimations and direct questions (in %).
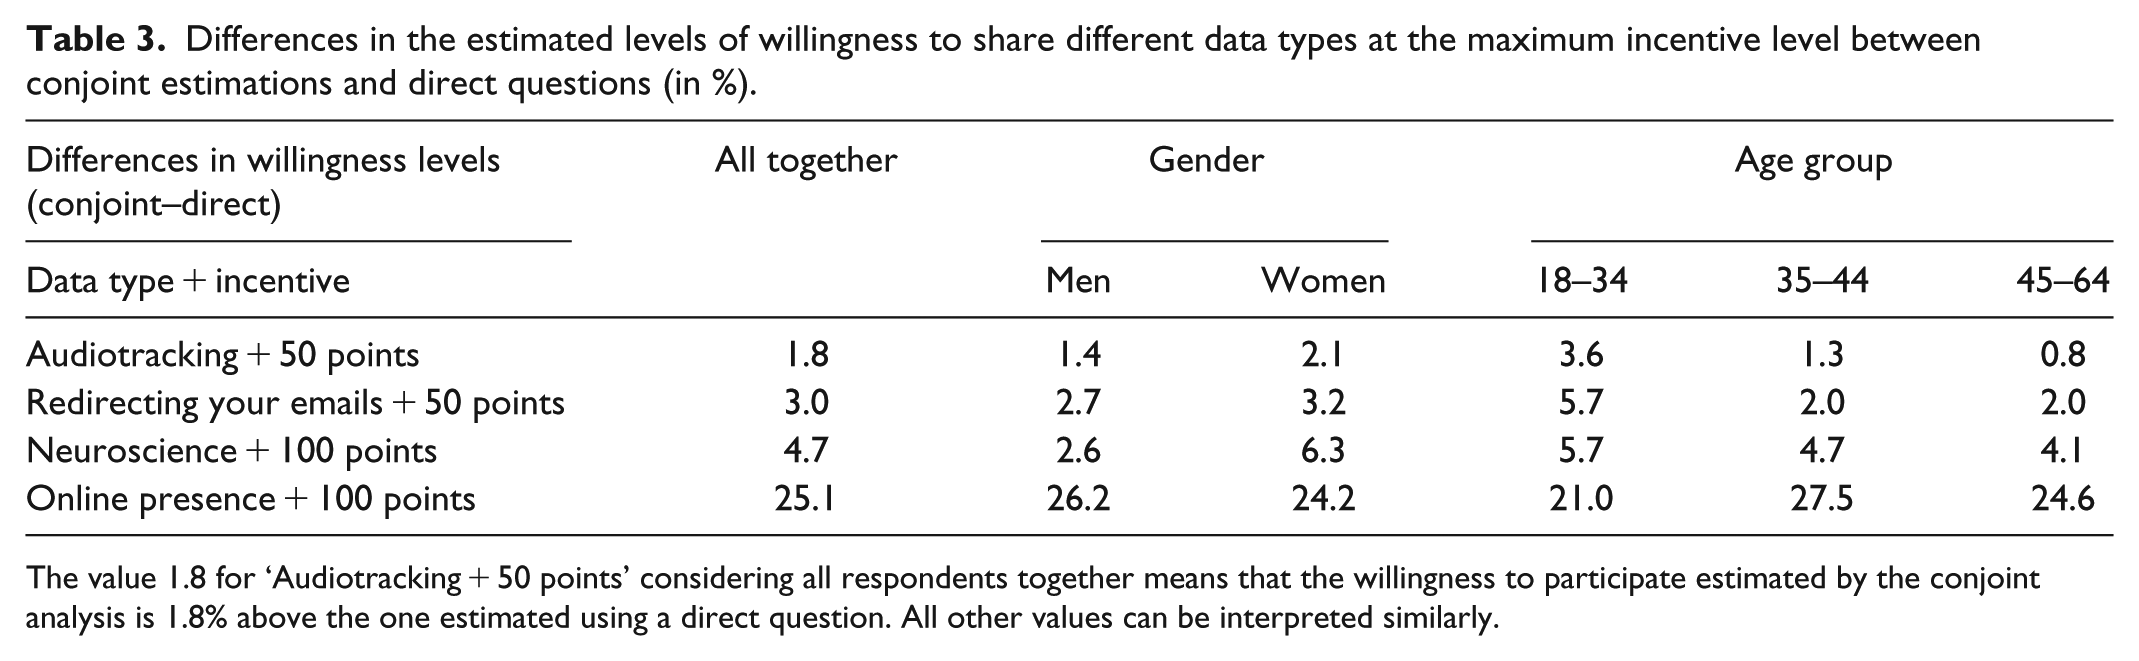
The value 1.8 for ‘Audiotracking + 50 points’ considering all respondents together means that the willingness to participate estimated by the conjoint analysis is 1.8% above the one estimated using a direct question. All other values can be interpreted similarly.
All differences are positive, meaning that the levels of willingness obtained are always higher in the conjoint analyses than in the direct questions. However, in general, the differences are quite small (<5%), with the exception of ‘online presence’ (difference of 25.1% for the full sample). This last one might have created some confusion, since it actually corresponds to data that the researchers can obtain without the permission of the respondents. Associating it to the highest level of incentive in the direct question maybe suggested to the participants that we did not ask only for the publicly available data but wanted to get more private data from their Facebook account, for instance (respondents might have wondered why researchers would pay them such a high incentive to do something that can be done even without asking them and thus assume that we asked for something else). Whatever the reason, we should keep in mind these results when interpreting our main findings. There are no significant differences (at the 5% level) between the differences for the gender or age groups.
Main findings
Keeping in mind the specific sample composition of this study and how the results from the conjoint relate to the ones of direct questions, we next present our main findings.
Utilities
First, average utilities for the tracking and the one-shot data types are reported in Table 4, for the whole sample, per gender and age groups.
Average utilities for the different data types and incentives.
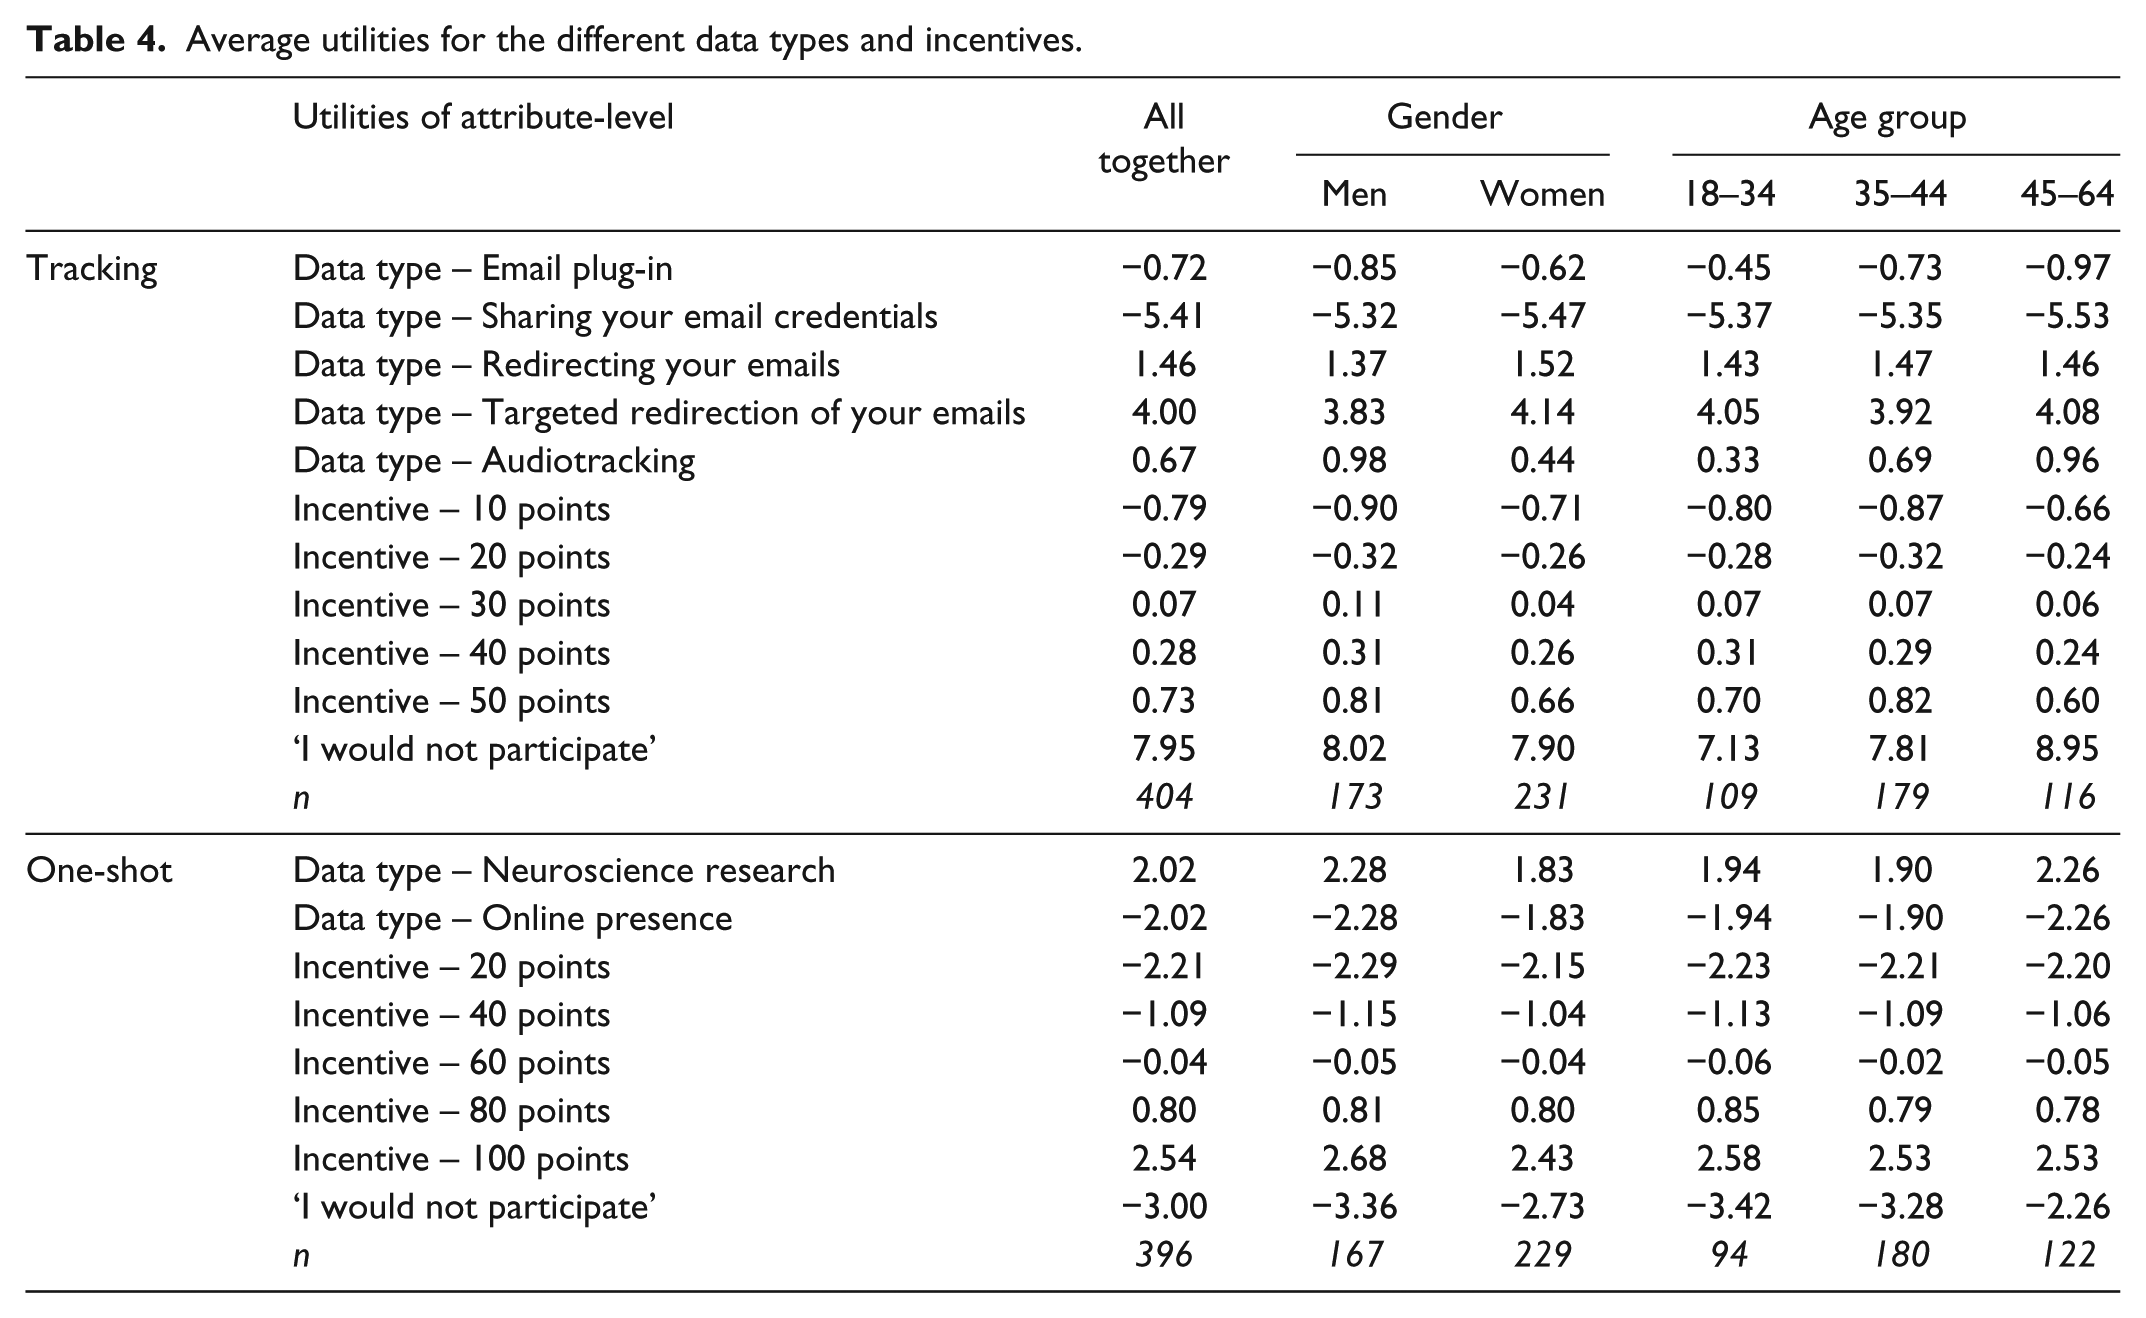
Regarding tracking data types, the email redirection tasks (targeted and total, respectively) get the highest utilities, meaning that these are the data types participants prefer to share, whereas sharing email credentials gets the lowest utility. The order of preference is the same in all gender and age groups. However, people from 45–64 years old are less prone to participate (higher values for the ‘I would not participate’ option).
As for one-shot data types, neuroscience research has a greater utility than tracking online presence. Again, older people are less prone to participate.
Willingness to share data
Finally, we measure the willingness to share different types of data, at different incentive levels, as explained in the ‘Analyses’ section. Figures 2 and 3 report the average willingness for the whole sample, by gender and by age groups, respectively, for tracking and one-shot data sharing. We should notice that the values on the y axis differ across the two figures (0%–40% vs 40%–80%).
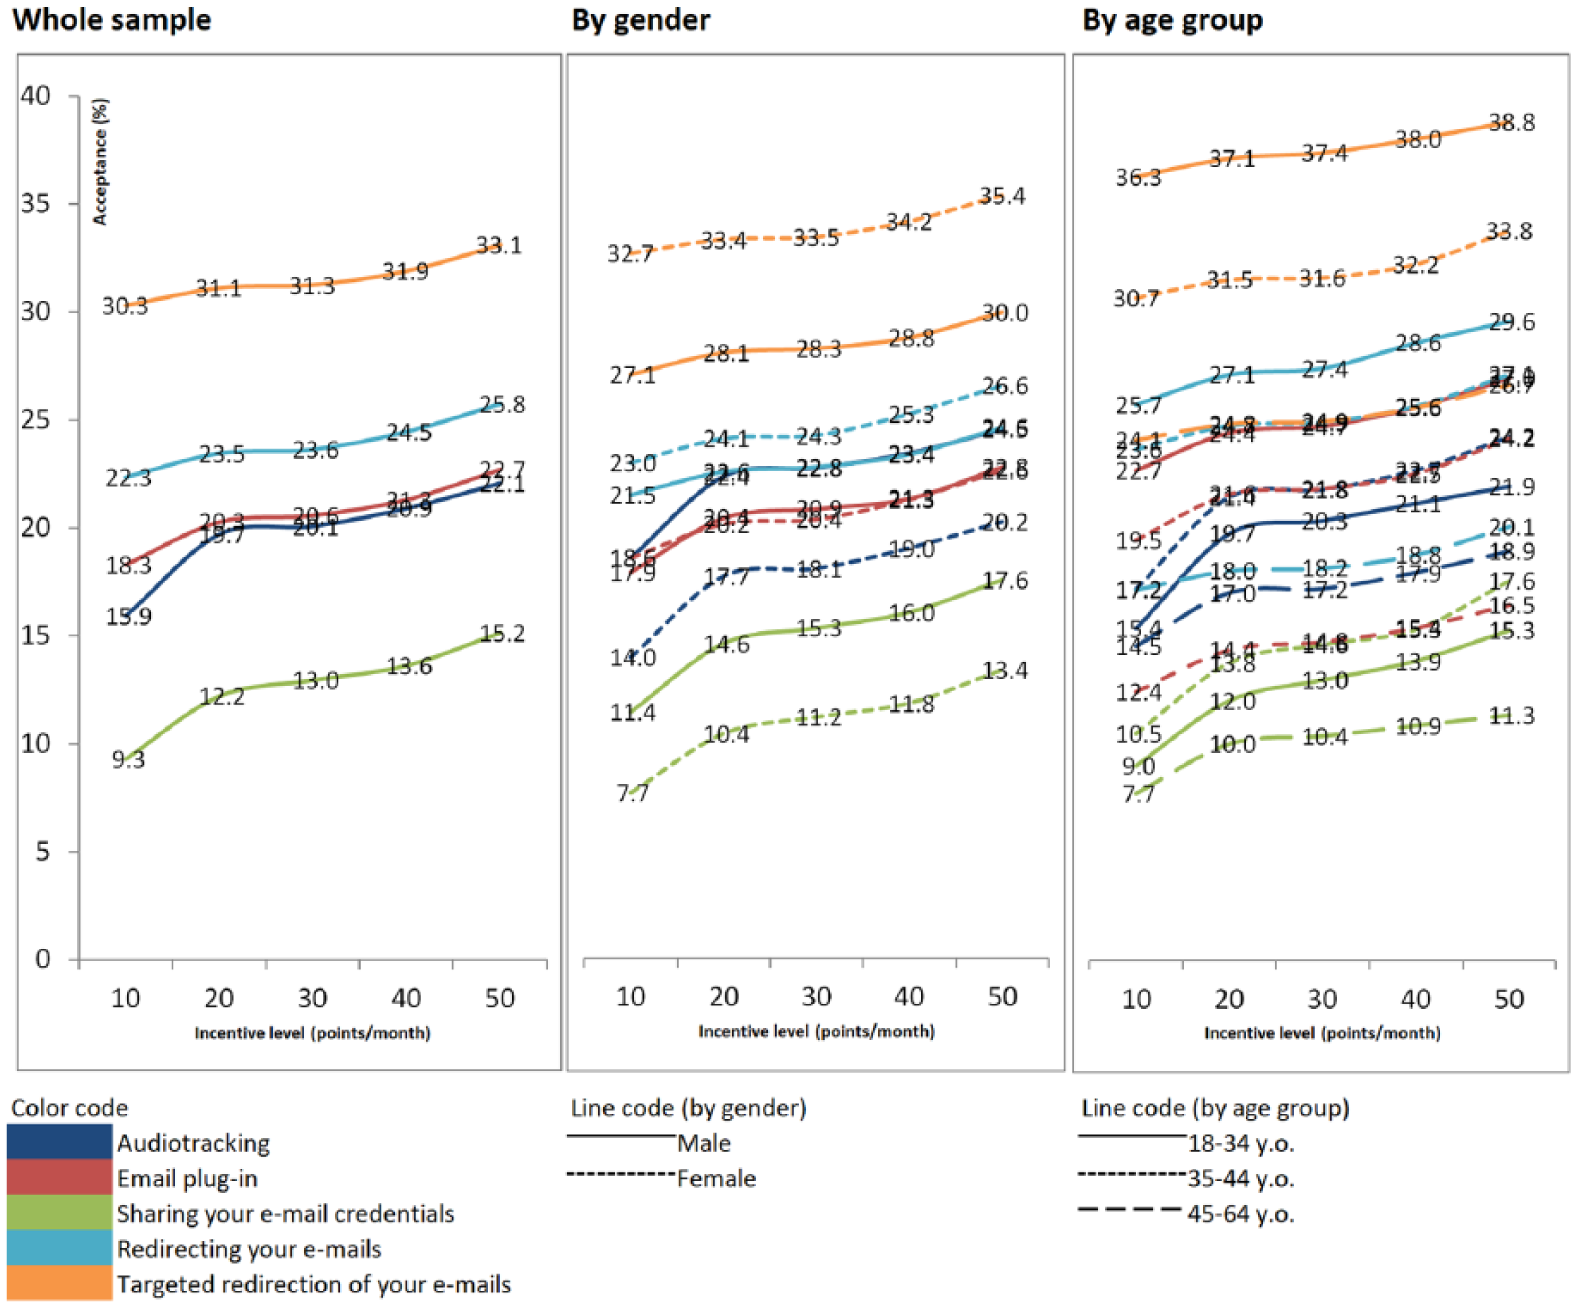
Willingness to share different data types – tracking.
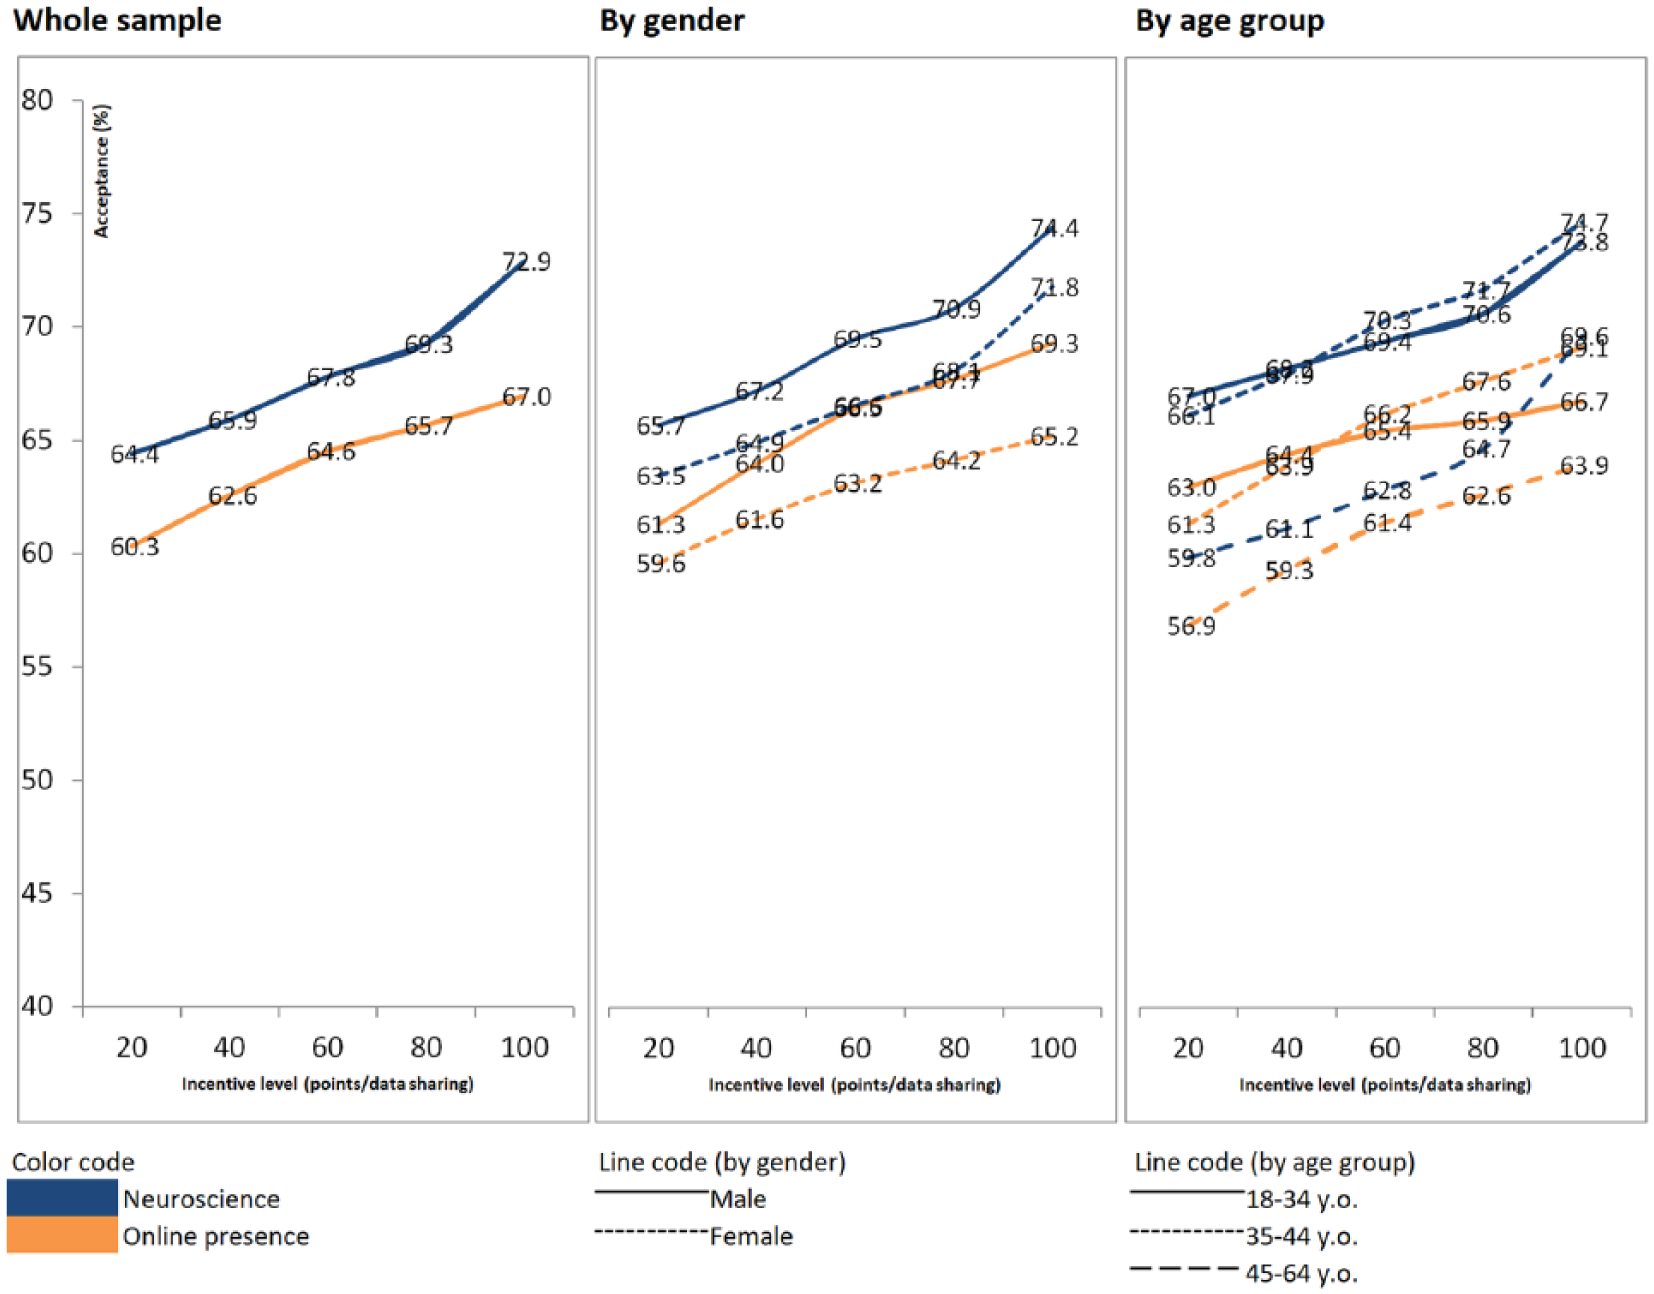
Willingness to share different data types – one-shot.
Regarding tracking data types, four out of five data types correspond to different ways of sharing the content of the participants’ email inbox. The willingness of sharing the content in these different ways follows what may be expected in advance based on the level of intrusion into the respondents’ privacy: sharing email credentials is the least accepted (only 9.3%–15.2% of the sample are willing to share them, depending on the incentive level), followed by email plug-in (18.3%–22.7%) and then two different levels of redirecting your emails: redirecting all the emails (22.3%–25.8%) or only part of the email-content (30.3%–33.1%). It is interesting to note that sharing credentials and redirecting emails produce the same effect (i.e. the panel company can read all the participants’ emails). However, the first method is potentially more dangerous for the user, as the panel company may usurp the users, and for instance send emails from their account. This could explain why the willingness is lower for sharing email credentials compared to redirecting emails. The fifth tracking data type studied, audiotracking, presents levels of willingness varying from 15.9% (for an incentive of 10) to 22.1% (for an incentive of 50). Thus, this is quite similar to the willingness for an email plug-in.
Concerning the effect of the incentives, for all five data types, the willingness increases with the incentives. However, increasing incentive by a factor of 5 only increases acceptance by (approximately) 3%. In other words, the data type seems much more important than the incentive level in the decision-making process. Besides, most of the increase can be observed when moving from an incentive of 10 points to an incentive of 20 points.
Now if we consider men and women separately, we can see that the differences in the levels of willingness across data types are higher for women: on one hand, they are less willing to share email credentials, on the other hand, they are more willing to accept a targeted redirection of the emails. In terms of age groups, respondents from 45 to 64 years old show lowest levels of willingness for all the tracking data types, whereas the ones from 18 to 34 years old show the highest levels for most data types.
Moving to one-shot data types, the willingness for ‘online presence’ varies from 60.3% to 67.0% depending on the incentives, whereas the willingness for ‘neuroscience’ varies from 64.4% to 72.9%. Thus, both willingness levels are quite similar and near twice higher than the ones for the tracking data types. Again, the willingness increases with the incentives, slightly more than for tracking data types: multiplying by 5 the incentive level leads to an increase of around 7 percentage points in the willingness to participate. For both data types, there is a tendency towards lower levels of willingness for women and for the older group of participants. However, differences are not statistically significant.
Conclusion
The goal of this study was to investigate the possibility of using members from an online opt-in panel in Spain to get data beyond survey answers, that could be used to reduce the respondents burden, by decreasing the number of questions needed in the surveys, and/or that could help improving the accuracy of the results (avoiding memory limitations), or discovering new insights (by providing information that cannot be obtained from a survey). The idea is therefore very attractive, but in practice, the implementation depends on people accepting to share different data types with the researchers. Thus, this article uses a choice-based conjoint analysis in order to study the willingness of panel members of sharing different data types. We focused on several data types to which little or no attention had been paid in previous literature but that arouse interest in practice. Different levels of incentives were considered, as well as differences by gender and age groups.
Main results
First, considering the utilities, we saw that, for the tracking data, a targeted redirection of emails got the highest value and sharing the email credentials got the lowest value, whereas for the one-shot data types, neuroscience research got a higher utility than online tracking.
When using the utilities to compute the individual probability of acceptance, we found that the willingness varies a lot across data types, which is in line with previous research (Revilla et al., 2018; Wenz et al., 2017). The tracking data types all show levels of willingness much smaller than the ones for both one-shot data types. Within each category, we also observed large differences in the level of willingness. These may be related to the levels of privacy concerns associated with each data type (Jäckle et al., 2017). For instance, as it has been described to participants, the ‘email plug-in’ data type captures less information than the ‘redirecting your email’ data type: the first only reads information from certain senders while the second captures all the received emails. However, the plug-in is potentially more dangerous for participants, as it could take control inadvertently of other email functions and applications. Respondents have shown a higher level of willingness towards redirecting their emails, suggesting that they prefer less risky methods of sharing information, and that they evaluate properly the privacy implications of the different data types.
In addition, privacy seems to impact more than effort on the decision of participants (again in line with previous research suggestions, for example, Revilla et al., 2018). For instance, participating in a neuroscience experiment (as described in this study) involves receiving a wearable device at home, instal it and watch a video; in contrast, the online presence data type is just about allowing the panel company to look for accessible information about the participant in the Internet. Despite the first task requiring much more effort, the associated willingness is higher at the same incentive level.
Finally, even if there is an increase in willingness when the incentive is higher, this is overall quite limited. Some differences across gender and age groups can also be observed, with in particular a trend of being less willing for older respondents, but most differences are not statistically significant. This is also in line with previous research, which found significant effects of age and gender on the willingness to share some data types, but not others (e.g. see Wenz et al., 2017).
Practical implications
These results, in line with other findings from previous research, show that opt-in online panels have a good potential for gathering different types of data beyond survey data, in particular, for one-shot data types (willingness up to 72.9% for neuroscience at the maximum incentive level studied). However, there are huge differences in the willingness across different data types, and some of them, especially those with more concerns regarding privacy, present low levels of willingness (e.g. 15.2% at the maximum incentive level for sharing email credentials). Panel companies probably still need to invest in building trust with their panellists to increase their willingness of sharing the most sensitive data types.
In terms of incentives, our results suggest that the gain of increasing them is limited, so using one of the middle alternatives is probably the most cost-efficient decision in practice. However, when the levels of willingness are low, it might be important to gain even a few percentage points in the participation. Therefore, it might sometimes be worth-it to use the highest level of incentives, or even incentive levels superiors to the maximum that was tested in this study. One advantage of conjoint analyses is that it is possible to extrapolate and compute what is the expected level of willingness for other incentive levels not included in the experiment.
In practice, the results from this work were used by Netquest to make short-term decisions about the implementation of several studies. In particular, one audiotracking study was implemented in Spain in January–March 2018 to investigate radio/TV audience, by matching the sounds surrounding the participants to different radios/TVs. 2 Participants were asked to instal an audiotracking application in their smartphones for 2 months. Based on the results of this conjoint analysis, an overall low willingness was expected for this task: 22.1% with an incentive of 50 points per month. Therefore, it was decided to propose a higher incentive: 155 points for a 2-month participation (i.e. 77.5 points per month), for which the expected willingness (based on the conjoint) was 23.6%. However, we should note that, on one hand, the conjoint asked about a continuous participation, without any time limit, whereas the real experiment only run over 2 months. Therefore, a slightly higher willingness was expected in the real experiment. On the other hand, the real participation can also be affected by technical problems related to the installation and functioning of the app: these could lower the final participation. Therefore, we cannot consider that differences between the conjoint and the follow-up study results indicate low validity: they can be due to the variations in the exact task and the technical issues.
In practice, 4,750 panellists were invited to the project. From those, some did not answer the preliminary survey, some were screened-out during this survey (due to quotas) and some said they did not want to participate further. Finally, 1,031 panellists were invited to instal the app (i.e. 21.7% of those initially contacted for the project), and 637 of them did instal the app (i.e. 61.8% of the ones invited to instal the app and 13.4% of those initially contacted). After 2 months (at the end of the experiment), 261 panellists (i.e. 41% of those who installed the app) were still sending data: the others uninstalled the app or stopped the tracking.
Limits/need for future research
Our focus on members of an opt-in online panel limits the possible inferences to other types of contexts (e.g. study based on new drawn sample): indeed, we expect higher willingness among people who already accepted to complete surveys for a panel. In addition, because of cost issues, and pressure to get the data used in this study quickly, in order to make short-term decisions (all the data types included in this study corresponded to real projects for which Netquest needed to estimate the costs and decide about their implementation), the composition of the sample used in this experiment was not controlled. This motivated the presentation of all results by gender and age groups (since the total could be affected by the different proportions of these groups). However, other variables could also play a role, meaning that we should be careful about the generalization of the results. This is a clear limit to this study.
However, we believe that the results are still interesting, because so far there were no research on the willingness to share some of these data types, and because we use a different kind of analyses, that allows to study the willingness relative to the incentive levels (with five different levels and the possibility to extrapolate to other levels). To go further, future research could use similar data types and analyses methods (i.e. conjoint), but using a sample representative of the panel of interest or of the Internet population.
In addition, while conjoint analyses seem a promising solution to design value propositions for respondents, as if they were products, our conjoint was quite reduced here (only two attributes). More complex conjoint analyses could be done, taking into account other attributes: for instance, in the case of the tracking activities, for how long we want to get the data. This would make the use of a conjoint design more useful and could provide more realistic or nuanced insights.
Finally, conjoint analysis may play a role in deciding of the exact level of incentives to be offered in different panels, different countries, for different data types and/or for different combinations of data (e.g. how much should a panel offer to its members such that the same member answers surveys and shares emails credentials and accepts that researchers track his or her online presence), in a similar way as it was done in this study. Such analysis also offers clear advantages in understanding the weight of each data type in the decision making of the participants.
Footnotes
Appendix 1
Acknowledgements
The authors thank Gerardo Ortiz for his help in programming the choice-based survey.
Declaration of conflicting interests
The author(s) declared no potential conflicts of interest with respect to the research, authorship and/or publication of this article.
Funding
The author(s) received no financial support for the research, authorship and/or publication of this article.