
Abstract
Mixed methods research has gained momentum over the past decade, but critics rightly charge that the integration of qualitative and quantitative data remains an unresolved methodological issue. While each of the dualistic and canonized methodological paradigms has its own way of handling analysis, researchers in mixed methods as a new paradigm have invested considerable efforts in more complex mixed analysis. They use the quantitizing of qualitative data and qualitizing of quantitative data as the strategies to effect data integration in mixed methods research. While attempts have been made to achieve quantitizing and qualitizing of data, few empirical studies have been conducted in a two-phase convergent parallel mixed methods design to investigate such data conversion approaches, especially dichotomization, within a single inquiry. To contribute to this ongoing methodological quest, this article explores the possibilities and impossibilities offered by either strategy to convert narratives into numerical data and numerical data into narratives.
Introduction
The existing overlaps between quantitative and qualitative methods make it an interesting point of inquiry when it comes to transforming data from one data type to another. Data conversion may come with its merits and demerits, bringing about some methodological challenges worth addressing. As the existing evidence posits, there is no pure quantitizing which does not involve a qualitative thumbprint, and vice versa, thus bringing about overlaps and cross-fertilization (Chang et al., 2009: 850). Both quantitative and qualitative methods entail each other (Sandelowski et al., 2009: 209) and quantitative methods do not escape qualitizing, and vice versa (Sandelowski, 2014: 5). This calls for empirical investigation of the cross-paradigmatic conversion of data especially in today’s world with complex and multifaceted social phenomena that call for the integration of two traditionally polarized worlds: (post-)positivism and interpretivism or constructivism.
Referring to two sets of data collection tools (qualitative interviews and narrative essays on one hand, and the survey questionnaire on the other) used in a mixed methods study that led to the development of this article, the existing literature indicates that by drawing comparisons between cases from the two linear (traceable in natural sciences) and non-linear (traceable in social or human sciences) worlds (Smith, 1999) – simply put, between quantitative and qualitative methodological paradigms – it is possible to explore relationships between demographic variables and theme expression (Collingridge, 2013: 82). Most worldviews critique the positivist perspectives as restrictive of social inquiry – hence post-positivism as the representative of multiple perspectives with researchers’ beliefs acknowledged as forefront factors (Smith, 1999). The post-positivist perspective embraces all forms of research, whether originating from the arts/humanities or the natural/physical sciences, emphasizing that what matters is what illuminates our understanding of human experiences (Smith, 1999).
Within the blurred boundaries of multi-perspectival territories, researchers keep navigating, across borders, whether consciously or not, making sense of the world around them both narratively and/or numerically, qualitizing and quantitizing data, un-qualitizing and un-quantitizing data analysis to find trends, correspondences and insights for a full picture of the phenomenon under inquiry. In mixed methods research, the two paradigmatic views can specifically be brought together to assess whether what is expressed quantitatively converges with what is expressed qualitatively. Sandelowski et al. (2009) and Chang et al. (2009: 850) reiterate that qualitative approach is intermingled into any quantitative approach with ‘interpretive gesture’ always present in quantitizing of any kind, leaving no clear demarcation line between quantitizing and qualitizing. Sandelowski et al. (2009: 213) strongly opine, ‘Conceiving quantitizing as unidirectional – as moving from so-called qualitative to quantitative data – masks the continuous cycling between assigning numbers to meaning and meaning to numbers’. They rightly point out that no one designs a questionnaire starting with numbers; it is concepts which are operationalised into measurable items. These operationalised concepts derive their frame of reference from the meaning which determines how the researcher dissects pre-existing concepts into items to be measured by respondents semantically ticking corresponding numbers. Researchers’ efforts are geared towards matching their conceptualization of the world or their story to the respondents’ worldviews and stories, trying to test whether their story predicts or aligns with the respondents’ story. Sandelowski et al. (2009) rightly opine that the objectivity traditionally associated with quantitative paradigm
inescapably rests on subjective decisions made by the researchers designing the questionnaires and the participants who are asked to choose the verbal anchor that best represents their experience of the target phenomenon, here conceptualized as occurring somewhere between never and always.
Quantitative researchers operationalize, that is, verbalize or qualitize, the concepts to be measured and assign numerical representations to linguistic symbols which respondents use to fill in the questionnaire. The qualitative thumbprints existing in the quantitative questionnaire design underlie the essence of cognitive interviewing to ascertain whether the researcher’s subjective phrasing of questions attracts the pre-established responses. What Behr et al. (2014) rightly posit as applying to multi-country surveys is that appropriate questionnaire design cannot prevent questionnaire items from changing meaning across time or from taking on unintended or differential meanings, and this insight reflects the complexity of data collection even within a single research context. It is not because a questionnaire is closed-ended that objectivity can be achieved. As Behr et al. (2014: 128) reiterate, respondents go through cognitive processes to answer a survey question: they interpret the question, generate an opinion, match the opinion to the response category (proposed by the researcher), and edit the response alongside social desirability and personal views and beliefs systems. Respondents have unavoidably to interpret the wording of the question, by simply attaching a meaning to it according to their understanding, worldview and socio-cultural milieu. Thus, nothing is purely objective or purely subjective; there are interconnections and overlaps evolving over time that make social inquiry worth investigating using both quantitative and qualitative lenses.
Despite their raison d’être, not much has been done to look into the process of quantitizing qualitative data and qualitizing quantitative data in convergent parallel mixed methods designs. While some methodological attempts exist, mainly focusing on quantitizing (Cabrera and Reiner, 2016; Kerrigan, 2014; Leal et al., 2016; Sandelowski et al., 2009), none has so far subjected study participants to two paradigmatically different data collection tools and to switching tools over time in an equal-weight convergent parallel design. Empirically, this article deals with the conversion of qualitative data into quantitative data, and vice versa. The objective is to answer one main research question: what are the possibilities and impossibilities that come with quantitizing and qualitizing data for integration purposes in mixed methods research? Specifically, the article aims at (1) illuminating quantitizing and qualitizing possibilities and impossibilities, (2) showing how to integrate mixed methods data fully and (3) pointing out the merits and demerits of quantitizing and qualitizing in mixed methods research.
Quantitizing possibilities and impossibilities
Defined as ‘the process of assigning numerical values (nominal or ordinal) to data conceived as not numerical’ (Sandelowski et al., 2009: 209–210), the process of transforming coded qualitative data into quantitative data (Driscoll et al., 2007: 20; Tashakkori and Teddlie, 1998: 126; Velzen, 2016: 3) or ‘transforming qualitative data into numerical format’ (Collingridge, 2013), quantitizing analyses narratives to explore the existence of any possible hypothesis or examine the salience of some discourses of interest and how they differentially occur in social actors’ narratives. Different approaches to quantitizing have been adopted, including content analysis of qualitative data and quantitizing of the qualitative codes (Cabrera and Reiner, 2016) into dichotomies. Besides dichotomization coded in terms of presence or absence, mention or non-mention of a concept or an issue under investigation in the qualitative data (coded as 1 vs 0), researchers may opt for capturing the various qualitative nuances on a scale to demonstrate that whatever is said qualitatively does not necessarily fall under a set of dichotomies but a continuum (ordinal, even scales). As such, they can code a chunk of the narrative as not discernible, noted in passing, important or dominant, which could then be numerically coded from 1 to 4 to indicate a linearly increasing extent of space or time (Sandelowski at al., 2009: 217, 218).
Content analysis remains the springboard to sorting out and categorizing chunks of the qualitative narratives that need coding either by 1 or 0 or on a continuum ranging from 0 to any number, say 4. It is therefore a way of grouping respondents by a given category or other features of the responses (Cabrera and Reiner, 2016; Onwuegbuzie, 2003) or what Canoy (2015: 926) has compared to ‘freezing moving pictures in time’. The results of the data-quantitizing process is a set of data that can be combined or merged with the data originally conceived as quantitative to compare, contrast and locate within the research discourse. As Sandelowski et al. (2009) suggest, using quantitized qualitative data to enrich quantitative research, since new analytical strategies are used, can allow the capture of other themes which are not easily captured and therefore not traceable within quantitative data.
Worth noting, however, is that quantitizing is not always possible. Quantitizing comes at a cost: dichotomization engenders loss of critical information and analytical power existing in raw qualitative data, undercuts the nuance and subtlety of particulars within given contexts of meaning and thus undermining the rationale for conducting qualitative research, sometimes trying to count the uncountable (Cabrera and Reiner, 2016: 6; Chang et al., 2009: 850; Sandelowski et al., 2009: 217). To some extent, quantitizing involves a process of getting rid of the uncountable or stripping qualitative data of their contextual and cultural meaning (Kerrigan, 2014: 351), losing the multidimensionality of qualitative data and insights through dichotomization (Driscoll et al., 2007), actually dropping anything that is not amenable to numbers.
Criticisms abound against quantitized qualitative data: such data are vulnerable to collinearity, naturally have a small sample size that constrains the statistical tests that can be performed (Driscoll et al., 2007: 25). In qualitative data analysis, co-occurring textual features are as important as the spatio-temporal linguistic and non-linguistic features and these elements are lost in quantitizing alongside the time-and situation-evolving narratives. As Krippendorff et al. (2016: 2348) indicate, qualitative responses have false starts, overlaps, pauses, incomplete assertions and multiple responses; these moving narratives can be isolated or frozen (Canoy, 2015: 926) to be assigned a binary numerical representation. There are shades and no clear-cut delineation of meanings in the qualitative data, which makes quantitizing a researcher’s conundrum to navigate with tact. Taking into account the empirical intricacies, Kerrigan (2014: 358) indicates that whenever she unearths a new pattern from the quantitized data, she returns to the original to assess whether the quantitizing has not obscured important but complex insights.
As if dichotomization of qualitative data into quantitative data is not criticized enough, the dichotomization of Likert-type scaled items, though frequently encountered in survey research whereby interval variables are reduced to dichotomies, is also vigorously criticized due to the loss of considerable amount of information, leading to underestimating effect sizes and reducing the power of statistical hypothesis testing (Cohen, 1983). Despite the merits and demerits associated with quantitizing, the existing literature (Collingridge, 2013; Onwuegbuzie, 2003; Onwuegbuzie and Teddlie, 2003; Sandelowski et al., 2009) shows that it is much more commonly investigated than qualitizing, and the underlying reasons may pertain to methodological allegiances that sometimes researchers and methodologists do not want to betray.
Qualitizing possibilities and impossibilities
Qualitizing is the process of converting quantitative data into qualitative data (Collingridge, 2013: 81; Driscoll et al., 2007: 20; Sandelowski, 2000: 253; Tashakkori and Teddlie, 1998). This conversion engenders qualitative categories (Leal et al., 2016: 20) which can be mapped against other qualitative insights to uncover any regularities or irregularities, convergent, divergent or contradictory findings (Leal et al., 2016: 2) and extract more information from the quantitative data and confirm the interpretation of it (Sandelowski, 2000: 253). Qualitizing involves participants’ profiling by theoretically grouping or typing participants based on their scores from the quantitative data collection tools (Sandelowski, 2000: 252). The existing literature mentions five kinds of qualitative profiling: modal, average, comparative, normative and holistic (Tashakkori and Teddlie, 1998: 130–133). In qualitative profiling, the numerical values from the standardized questionnaires are attached to a qualitative label whereby, for example, on a 4-point Likert-type scale, respondents with low scores are labelled as in disagreement and those with high scores are labelled as in agreement with a statement requiring scaled responses. This is comparable to straightforward quantitative dichotomization.
The qualitizing process is not confined to turning numbers into words, but it is about finding or imposing an underlying conceptual qualitative representation of the items that make up the factor or the denominator concept which is shared among the items loading together. While factor analysis is a skill, the naming of latent variable or underlying solution is an art, requiring knowledge of the theoretical and conceptual considerations, access to the existing body of knowledge from other sources, thus leading eventually to imposing a meaning to numerically loading together results. It is common practice in survey research to use terms like ‘the majority of the respondents’, ‘a few respondents’, ‘some percentage of the sample’, ‘about half of the respondents’. These linguistic features reflect a form of qualitizing. As Onwuegbuzie et al. (2009) and Hathcoat and Meixner (2015) rightly argue, the researcher makes subjective decisions to derive a final solution from the factor analysis, actually using the researcher as a subjective instrument to identify the latent variable. This is exemplified in the section dealing with study results and interpretation.
Methods and nature of data
Study design and data processing
This article uses the design, methods and data from Nzabonimpa’s (2016) study investigating methods effects in an equal-weight convergent parallel mixed methods research. Nzabonimpa designed his study to assess methods effects resulting from mixing methods at Phase 1 and Phase 2 with respondents having been subjected to a different methods strand in each phase. Dual participation while switching tools from Phase 1 to Phase 2 was meant to investigate whether respondents could give the same responses in a closed questionnaire as they would do in qualitative interviews/essays, after a minimum of 3 months wash-out period had elapsed. This wash-out period was dictated by practical and empirical reasons: the length of the school term which is 3 months and the need to minimize the rehearsal bias. The respondents who participated once at Phase 1 served as a control group against which to assess whether a one-off participation is comparable to dual participation in a convergent parallel mixed methods study. Either phase qualifies as a concurrent mixed methods study design in its own right but a sequential design is added to answer research questions related to methods effects in a time-spaced mixed methods study.
As elaborated in Nzabonimpa (2016), three typical high schools (a girls-only school, a boys-only school and a mixed-sex school) were purposively sampled at the first stage to ensure gender representation. At the second stage of sampling, a probability sampling strategy was used to draw a sample for both the quantitative and the qualitative study strands (Nzabonimpa, 2016). For Phase 1, a sample size of 360 (120 respondents at each of the three schools) was determined as representative of 3,492 schooling population and sufficient for all the planned statistical analyses (Krejcie and Morgan, 1970). At Phase 2, implemented 3 months later, only half of Phase 1 respondents were randomly selected for participation, the remaining (one-off) study participants serving as a control group.
As illustrated in Figure 1, the study was concurrently designed for both methods strands with cross-fertilization during instrument development. For methodological and empirical reasons, all study participants were not aware there would be a second phase of data collection. At Phase 2, a data collection tool different from Phase 1 was administered. Data analysis was done first independently of methods strand but later merged for mixed analysis.
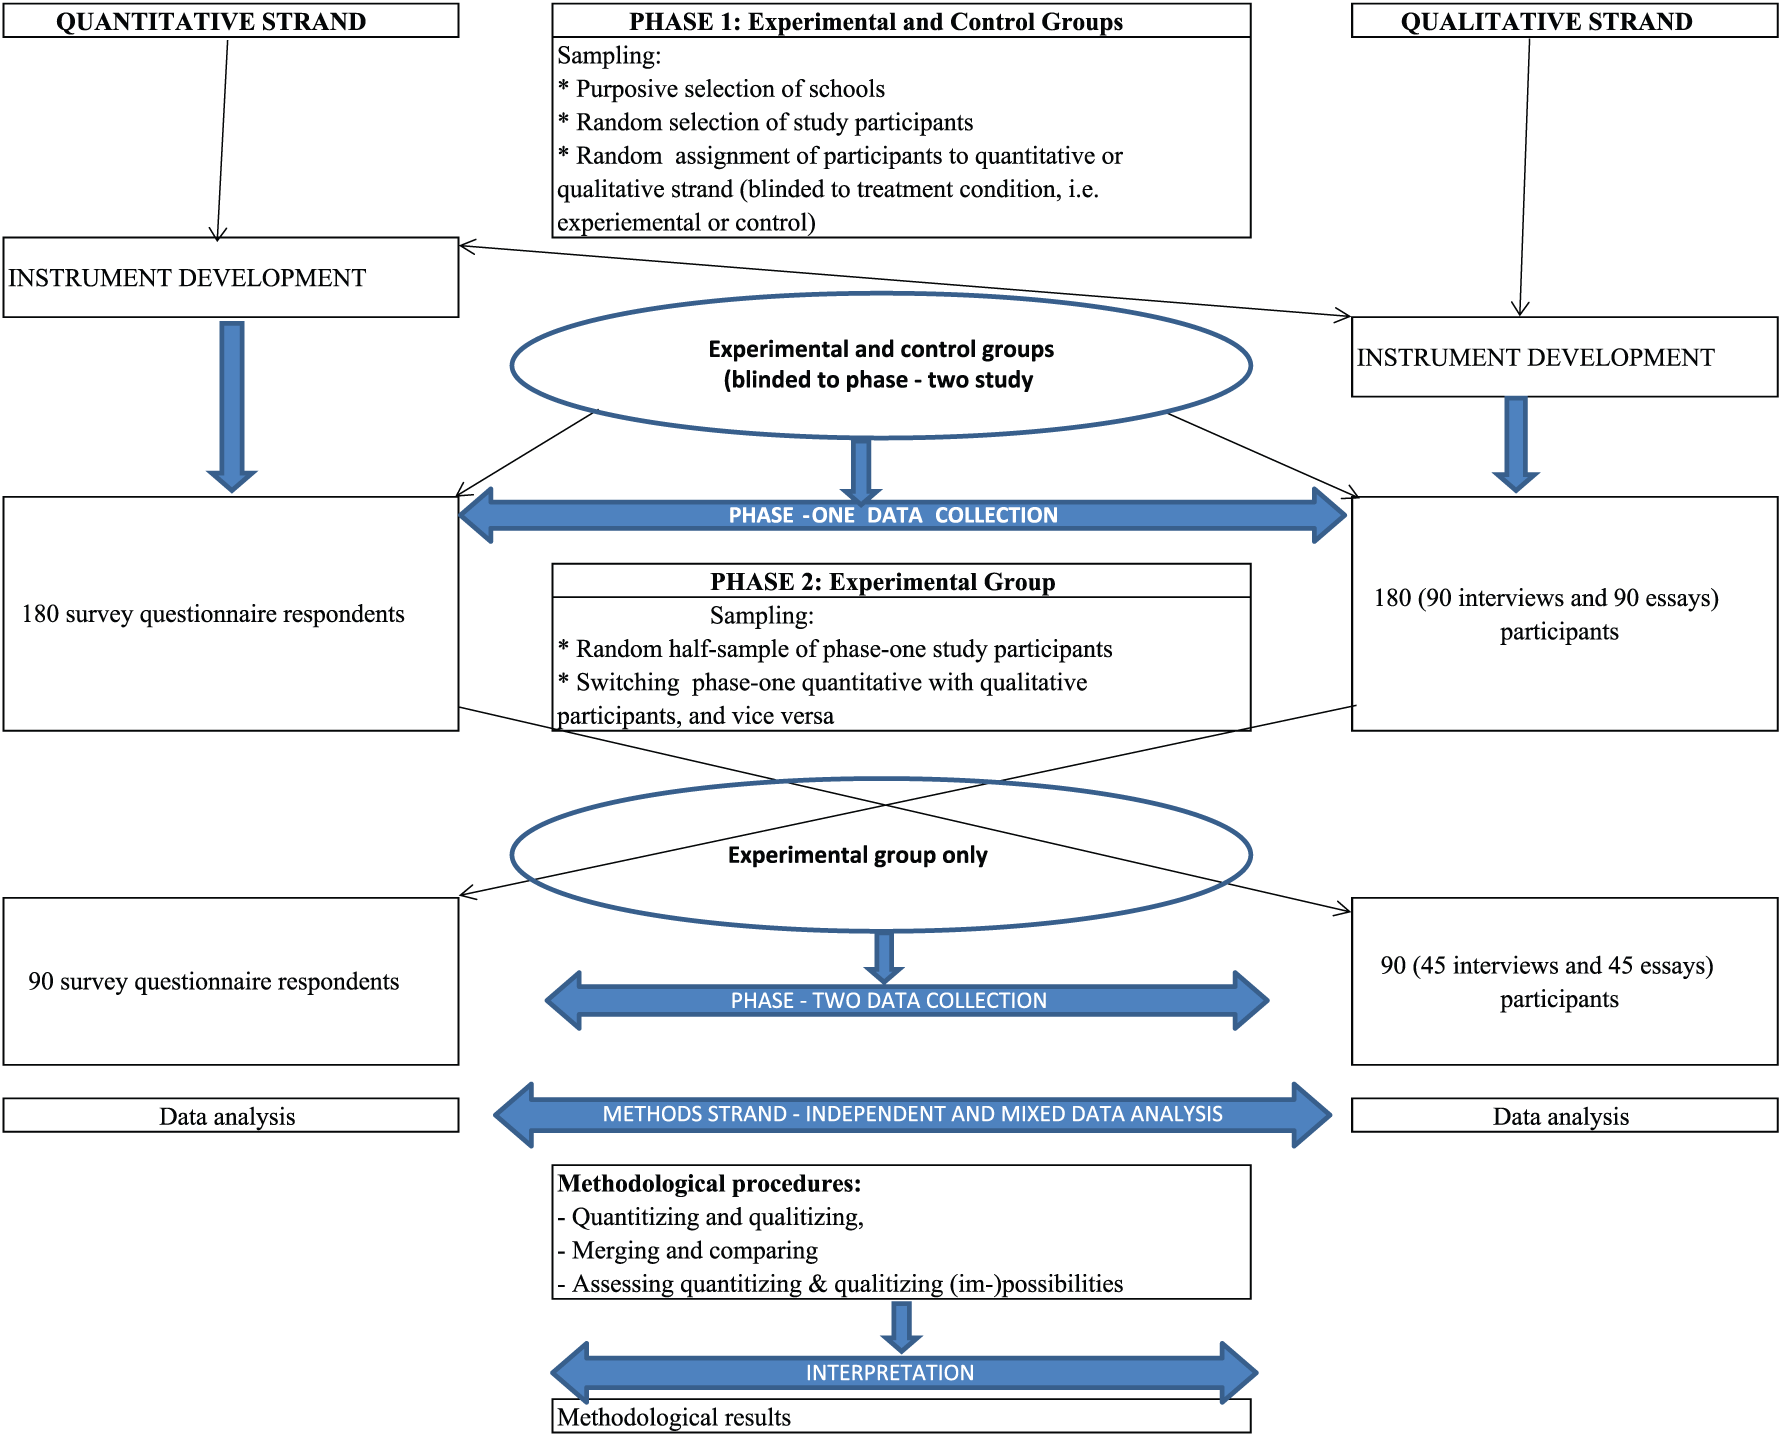
Diagram depicting the overall study design.
Unique identifiers were created, especially at the sampling stage, and used throughout the study to track study participants over time and across methods strands. These unique identifiers were used at Phase 1 and at Phase 2 across data collection tools and were designed to reflect the school, the class, class list number and gender of the respondent. In sampled schools and classrooms, quantitative and qualitative data were concurrently and sequentially collected using a highly quantitative, structured, self-administered survey questionnaire; semi-structured, personal interviews; and biographical narrative essays. With choice of school subjects (science vs non-science) as the dependent variable, independent variables included, among others, existing standardized science motivation and mathematics attitudes scales adapted to measure science uptake in schools, self-reporting of socio-educational background and experiences, self-rating of performance in school subjects, reasons motivating or gendered factors associated with choice of school subjects and gendered future plans. These concepts were operationalized in qualitative and quantitative terms, engendering two sets of data collection tools: the survey questionnaire on one hand, and structured interviews and narrative essays on the other. Data from these operationalised concepts were subjected to conversion and quality criteria were taken into account.
To ensure quality, only those scales which demonstrated internal consistency by meeting the .70 threshold of Cronbach’s alpha were subjected to qualitizing. As discussed in Nzabonimpa (2016), mixed methods research is not without methodological issues which need to be addressed ‘in a way that produces complementary strengths and non-overlapping weaknesses’ (Johnson et al., 2007: 127). The quality criteria in the traditionally bipolar qualitative and quantitative paradigms have led to legitimation criteria in mixed methods research (Leech et al., 2010). In this study, validity issues were addressed by cross-verifying data from more than one data collection tool (Bazeley, 2004: 9) and some of the nine legitimation criteria (sample-integration, inside–outside, weakness-minimisation, sequential, conversion, paradigmatic mixing, commensurability, multiple-validities and political) existing in mixed methods (Onwuegbuzie et al., 2006) were taken into account.
First, the ‘sample-integration’ legitimation was addressed by making all inferences from similar subsamples of participants in both methods strands (experimental group), in addition to a control group which participated once either in the qualitative or quantitative methods strand. Second, the ‘inside–outside’ legitimation was catered for by involving and seeking views of a second researcher for data and insights triangulation. This second researcher was consulted from the design of tools and translation through to data analysis and interpretation. Third, the ‘weakness-minimization’ legitimation, referring to methodological compensation of gaps existing in one strand with the strengths existing in another strand (Onwuegbuzie et al., 2006: 58), was addressed by using, for example, factor analysis and its related reliability testing to uncover underlying conceptual dimensions which, in turn, were assigned a qualitative appellation. Also, the iterative analysis that takes into account un-converted qualitative and quantitative data helped uncover and address possible weaknesses. Fourth, the ‘sequential’ legitimation which has to do with meta-inferences arising from a sequential mixed methods design was catered for by having at each phase concurrent administration of tools from both methods strands. Finally, the ‘conversion’ legitimation is the key quality feature for this article. As discussed in Nzabonimpa (2016), the conversion legitimation is coupled with methodological challenges; as Onwuegbuzie et al. (2006: 58, 59) point out, quantitizing de-contextualizes qualitative data and qualitizing quantitative data may be stained with overgeneralisation and unrealistic profiling. To achieve conversion legitimation, the data analysis and interpretation are conducted in an iterative and looping manner between both strands, referring back to explicit and implicit contextual features. In addition to using same data collection tools at Phase 1 and Phase 2 in both methods strands, Cronbach’s alpha was used to detect internal consistency as a measure of reliability in the quantitative methods strand, while two raters were used to cross-check interrater reliability of the codes and insights in the qualitative component of the study – but the Cohen’s Kappa index of agreement was not used, as the second coder had to review the coding manually while the first used ATLAS.ti (Nzabonimpa, 2016). Given the research questions and the study design, the analysis stage in this article is skewed towards quantitative techniques. However, qualitative and mixed data analyses and interpretation were used to make sense of statistics and trends, adding contextual ingredients to de-contextualized results. In this study, although consent was granted by children’s parents/guardians or school authorities, respondents were also requested to assent to participation.
Qualitative data processing, quantitizing and analysis
The qualitative data from essays and interviews were transcribed and then imported into ATLAS.ti version 7 for a multifaceted qualitative data analysis approach. Building off the interactionist view of meaning, interaction of social actors and of interpretive process to make sense of qualitative data, qualitative data analysis was conducted in a looping and iterative manner, using multiple analytical approaches. Although content analysis is less used in qualitative data analysis (Babbie and Mouton, 2001: 491), it was used to find out the expression or mention of a thematic or conceptual category of interest, as predetermined (Bryman, 2012: 297) during the design of the study tools. The presence or absence of a thematic code was respectively coded as 1 or 0, what Babbie and Mouton (2001: 492) call coding for existence. Regardless of the intended comparison of content-analysis categories with survey questionnaire data, emerging codes are added for relevant conceptual categories or insights throughout the coding process. The coding includes all meaningful instances of a code, whether explicitly or implicitly expressed (Babbie and Mouton, 2001). To decipher the implicit part of the qualitative data, discourse analysis was used to move beyond the obvious language, making the implicit explicit through association, interpretation and comprehension of objects, subjects, meanings, and historical and contextual features (Babbie and Mouton, 2001).
ATLAS.ti was used to sort, display and identify relevant themes and quotes that address and reflect, implicitly or explicitly, gender issues related to choice of school subjects. As stated above, a priori coding based on the existing conceptual categories identified during the design of the study and the development of data collection tools was used, but this was followed by emergent approaches to capture any unexpected insights from the narratives (Kerrigan, 2014: 351). Using ATLAS.ti, response quotes were tagged and linked with the unique identifier assigned to each respondent. Such tagging helps to link responses iteratively with individual respondents across the quantitative and qualitative strands and to merge the quantitative and the quantitized qualitative data into one dataset.
Using various modalities of ATLAS.ti, response quotes were interactively identified and labelled, thus producing thematic categories that could be linked up with one or more of the quantitative ‘themes’. All interview and essay transcripts were analysed in the original language of data collection, that is, Kinyarwanda. Only quotations used in the reporting of results were translated by the researcher (also a native professional translator) and cross-checked by another Kinyarwanda native speaker who was also an English speaker. For the coding of the qualitative data, an additional coder reviewed thematic categories developed to create similar or identical themes that capture the views of respondents (Castro et al., 2010: 349). Identical themes were validated for inclusion in the analysis, while similar thematic categories were reviewed, discussed and harmonized by agreeing to the correct coding. Differing themes were subjected to further scrutiny and were empirically discussed to develop them into agreed-on themes, also for use in the analysis.
The data collected in the qualitative component were analysed to extract systematically insights and meanings from narratives. Each interview or essay was equated to a case or observation and coded to variables. Codes and primary documents (i.e. individual interview or essay cases) were cross-tabulated to generate binary variables (where present = 1 vs absent = 0; mentioned = 1 vs not mentioned = 0; yes = 1 vs no = 0; agreed = 1 vs disagreed = 0; belonging = 1 or not belonging to a code family = 0) from the concepts qualitatively measured. A cross-tabulated spreadsheet of data was exported to Microsoft Excel (Figure 2); ATLAS.ti helps generate the frequency count for each code for each respondent in a cross-tabular format. Recurrent themes were counted but reduced to a one-off count per qualitative strand participant. After harmonization of variable names, using the same variable names in both methods strands, the qualitative and quantitative data were eventually merged in SPSS, where all data cleaning and the main mixed analysis took place.
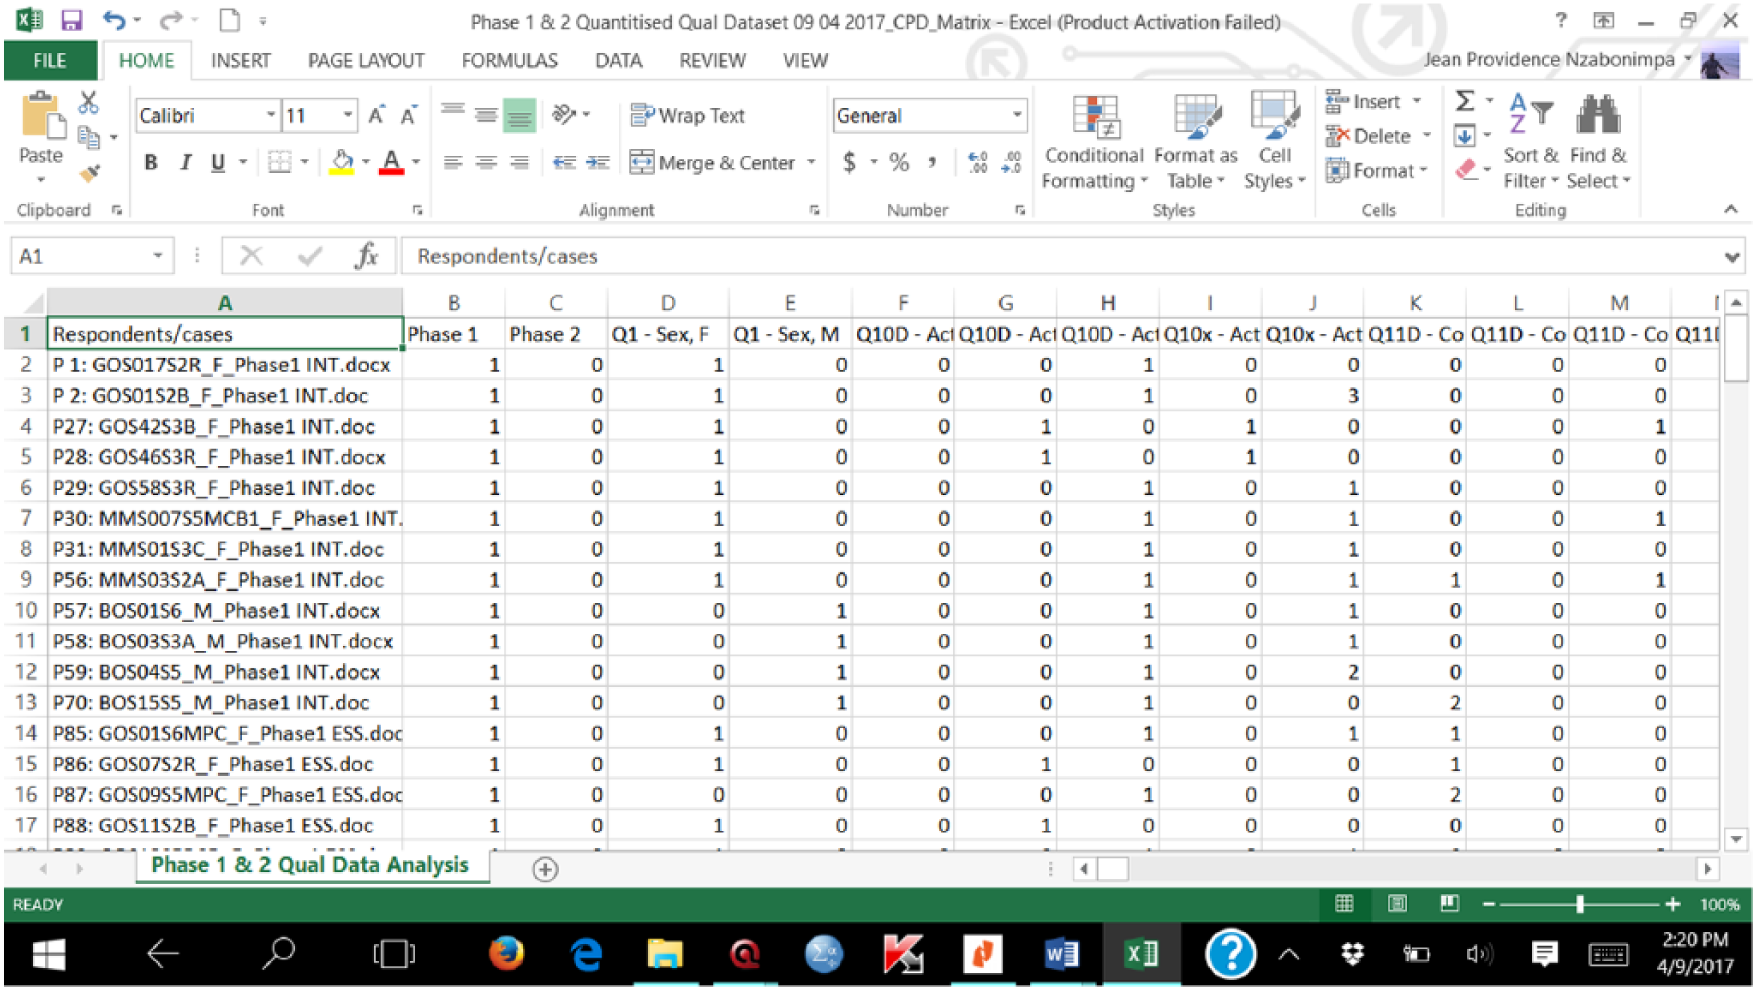
Illustrative data matrix from codes and individual qualitative transcripts.
It is easy to assign shades of grey (Sandelowski et al., 2009) but the likelihood of having such objectivity in interviews and essays might inaccurately shade the wrong side of the continuum. As a research interest, the discovery of regularities (Babbie and Mouton, 2001: 498) is not amenable to clear-cut quantitized categories in open-ended interviews and essays. Driscoll et al. (2007: 22) rightly point out that such quantitized frequencies can indicate particularly influential codes but can also be prone to confounding by repetitive respondents who confine themselves to a certain concept or theme. By simply confining the quantitizing to dichotomization, one can comfortably know who among the participants roughly agrees or disagrees, mentions or does not mention an issue or a concept in their narratives.
Quantitizing qualitative data is not an end in itself. As also pointed out by Karasz et al. (2009: 1046), besides the analysis of quantitized data using statistical methods, analysis of original qualitative data is also performed to ensure no insights are missed out in the quantitizing and analysis process. To the raw qualitative data, qualitized data insights are added to complement each other. The statistical analyses performed include frequency counts and inferential statistics such as chi-square, McNemar for repeated measure sequential designs and logistic regression modelling. The descriptive statistics allow the identification of regular or peculiar patterns (Collingridge, 2013: 82; Sandelowski et al., 2009: 210) that could otherwise go unnoticed in the narratives, and the significance testing enriched the qualitative analysis by exploring significant associations between dependent and independent variables (Collingridge, 2013: 82). Qualitative data and their analysis are the benchmarks from and against which quantitized data and related analyses and findings are derived. As rightly reiterated by other authors (Collingridge, 2013: 82; Leal et al., 2016: 10), qualitative data and analysis are complemented, not replaced by quantitized data analysis, and therefore constantly revisited during the analysis of quantitized data as the analysis of qualitative data in its raw form produces a rich understanding of phenomena not available in quantitized data and potentially able to illuminate and explicate findings between and from quantitative and quantitized qualitative data.
Quantitative data processing, qualitizing and analysis
All quantitative data were entered and processed in SPSS version 20. The quantitative data from Likert-type scaled questions were also converted into qualitative data but to a limited extent. The scaled questions which were subjected to qualitizing were the ones meeting the acceptable minimum level of internal consistency (.70) confirmed by Cronbach’s alpha reliability test. The scaled questions falling short on this threshold were not subjected to qualitizing. Further qualitizing efforts were tied to the conceptualization and operationalization included in the survey questionnaire items whereby the analysis outputs are linked back to the concepts that led to the design of closed-ended questions and to the generation of the numerical responses.
Qualitizing was limited to Likert-type scales where underlying dimensions from factor analysis were qualitatively named to reflect the shared meaning between all the items loading onto the same construct. While the categorical variables in the survey questionnaire were inferentially analysed using mainly chi-square tests for independence, all scale measures were subjected to Principal Components Analysis (PCA) to summarize data. As regards PCA, two statistical measures were used to assess whether the scaled items were factorable: the Kaiser–Meyer–Olkin (KMO) measure of sampling adequacy and Bartlett’s test of sphericity. The former’s value has to reach a minimum of .6 to proceed with PCA, and the latter has to be significant (p < .05) (Pallant, 2010: 183). When both statistical conditions are met, factor analysis is performed.
As suggested by Pallant (2010: 183), the number of factors is sometimes determined after extraction, removal of poorly loading items, and identifying factors with at least three items loading together. Once factors are extracted, they are subjected to reliability testing to assess their internal consistency, with the requirement that at least the acceptable Cronbach’s alpha coefficient threshold of .70 − that is, above the minimal acceptable value of .60 − has to be reached (Helmes and Holden, 2003: 1020). Scales or subscales with a Cronbach’s alpha coefficient of at least .70 are computed into a composite variable of which qualitative appellation or conceptualisation needs to reflect shared features among all the items forming that factor. With factor analysis, only reliable and semantically interpretable composite scales are retained for qualitizing but also for inclusion in the regression modelling. The 4-point Likert-type scales were dichotomized by collapsing together and assigning 0 to strongly disagree and disagree while collapsing together and assigning 1 to strongly agree and agree. A limited number of 5-point Likert-type scales were also dichotomized in the same way by collapsing the first two attributes of 1 and 2 into the zero-represented attribute and 4 to 5 into the second one-represented attribute of the dummy variable, while the middle or neutral point was set to missing.
Mixed data analysis
In view of the research question and study objectives, the bulk of the analysis and comparison was quantitative: the statistical significance of the association between the results produced by the quantitatively and qualitatively collected but quantitized data were measured using the chi-square test of independence. In addition to p-values, effect sizes were measured to determine the magnitude of the difference observed. Both originally quantitative and quantitized qualitative variables were used as independent variables in the regression model. After grouping respondents by their planned or actual school subject choice, respondents in science streams or who intended to take science were coded as 1, while those in non-science streams or those who did not intend to take science were coded as 0. This binary variable was then used as the dependent variable in the logistic regression model.
First, concurrently collected and merged quantitative and qualitative data were descriptively and inferentially analysed and compared within each phase, assessing differences or similarities between the results from the methods strands. Second, as the study includes a matched and repeated-measures design, McNemar’s test was used. Within this repeated-measures sample, when any respondent’s unique identifier was not found in both phases, the corresponding data were discarded from the paired analysis. Sequentially collected data were inferentially analysed to examine whether data generated from individual respondents using interviews/essays converge with, or diverge from, data generated from the identical individuals using the questionnaire at Phase 1 and at Phase 2. Third, a logistic regression model was built to investigate factors predicting the empirical issue under investigation, that is, the choice of science or non-science school subjects, and whether these predictors are the same in quantitative and quantitized qualitative data (Nzabonimpa, 2016).
The non-parametric tests were performed, as key parametric assumptions were not satisfied: the primary dependent variable (choice of school subjects: science vs non-science) was not an interval or ratio measure, and the assumption of normality of the distribution was not met, which can bias parametric test results (Field, 2009: 133, 344–345, 551, Pallant, 2010: 240; Cohen et al., 2000: 317–318). Although there are different ways to run mixed methods data analysis (Wolf, 2010: 153), statistical analyses – frequencies and cross-tabulation for chi-square and McNemar tests, binary logistic regression – can be used to measure the extent to which the independent variables separately from each methods strand predict the dependent variable (choice of science subjects) (Figure 3). This has been reported in Nzabonimpa (2016).
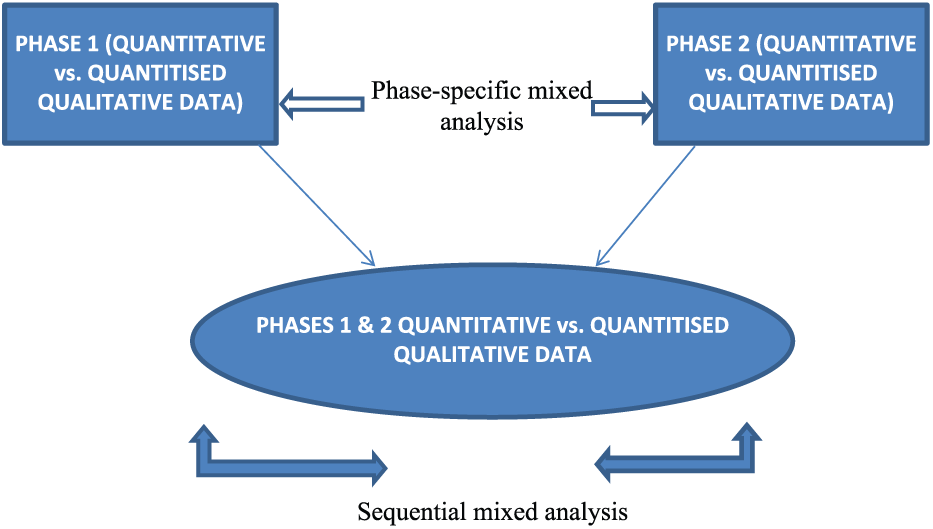
Mixed data analysis matrix.
In this article, analysis is conducted by methods strand or phase, by comparing concurrently collected quantitative and quantitized qualitative data, and by study condition (experimental or control) by comparing sequentially collected quantitative and quantitized qualitative data across phases. The analysis is performed on 337 cases that participated at Phase 1 and on 141 cases that participated twice at Phases 1 and 2. In the mixed dataset, using binary logistic regression, as pointed out by Collingridge (2013: 87), significant driving factors of school subject choice were identified (Nzabonimpa, 2016). Statistical results of these analyses are presented in a paper on methods effects resulting from mixing qualitative and quantitative data (Nzabonimpa and Prozesky, in press).
To a lesser extent, the mixed methods data analysis was also done qualitatively: bringing together the insights generated from both methods strands, mainly comparing the underlying dimension from scaled questions with insights generated from qualitative data. Using factor analysis, it is only the dimensions reliably loading together that are qualitatively translated into conceptual dimensions which in turn are compared to other qualitative insights to find out whether there is any convergence or divergence (see the section on qualitized results).
Data conversion results and interpretation
There are several ways of expressing socio-demographic variables in alphanumerical or numerical terms. This also applies to questions asking respondents about the presence of relatives or siblings with highest educational level or about factual information on their current study streams or other factual educational experiences. Responses to such socio-demographic and educational variables are somehow rarely subject to misinterpretation. Below are quantitized and qualitized results as well as data which could not be converted into another form.
Quantitized results
In addition to the sample distribution which is clear in numbers across phases, the quantitized data allow an easy and streamlined view of the empirical picture. Except the variable ‘age’ which is continuous both in the quantitative and qualitative data collection tools but dichotomized to collapse smaller distribution together for later inferential analysis, the variables in Table 1 below foreshadow the merits and demerits of quantitizing as discussed in the next section.
Distribution of respondents by socio-demographic and educational characteristics and phase.
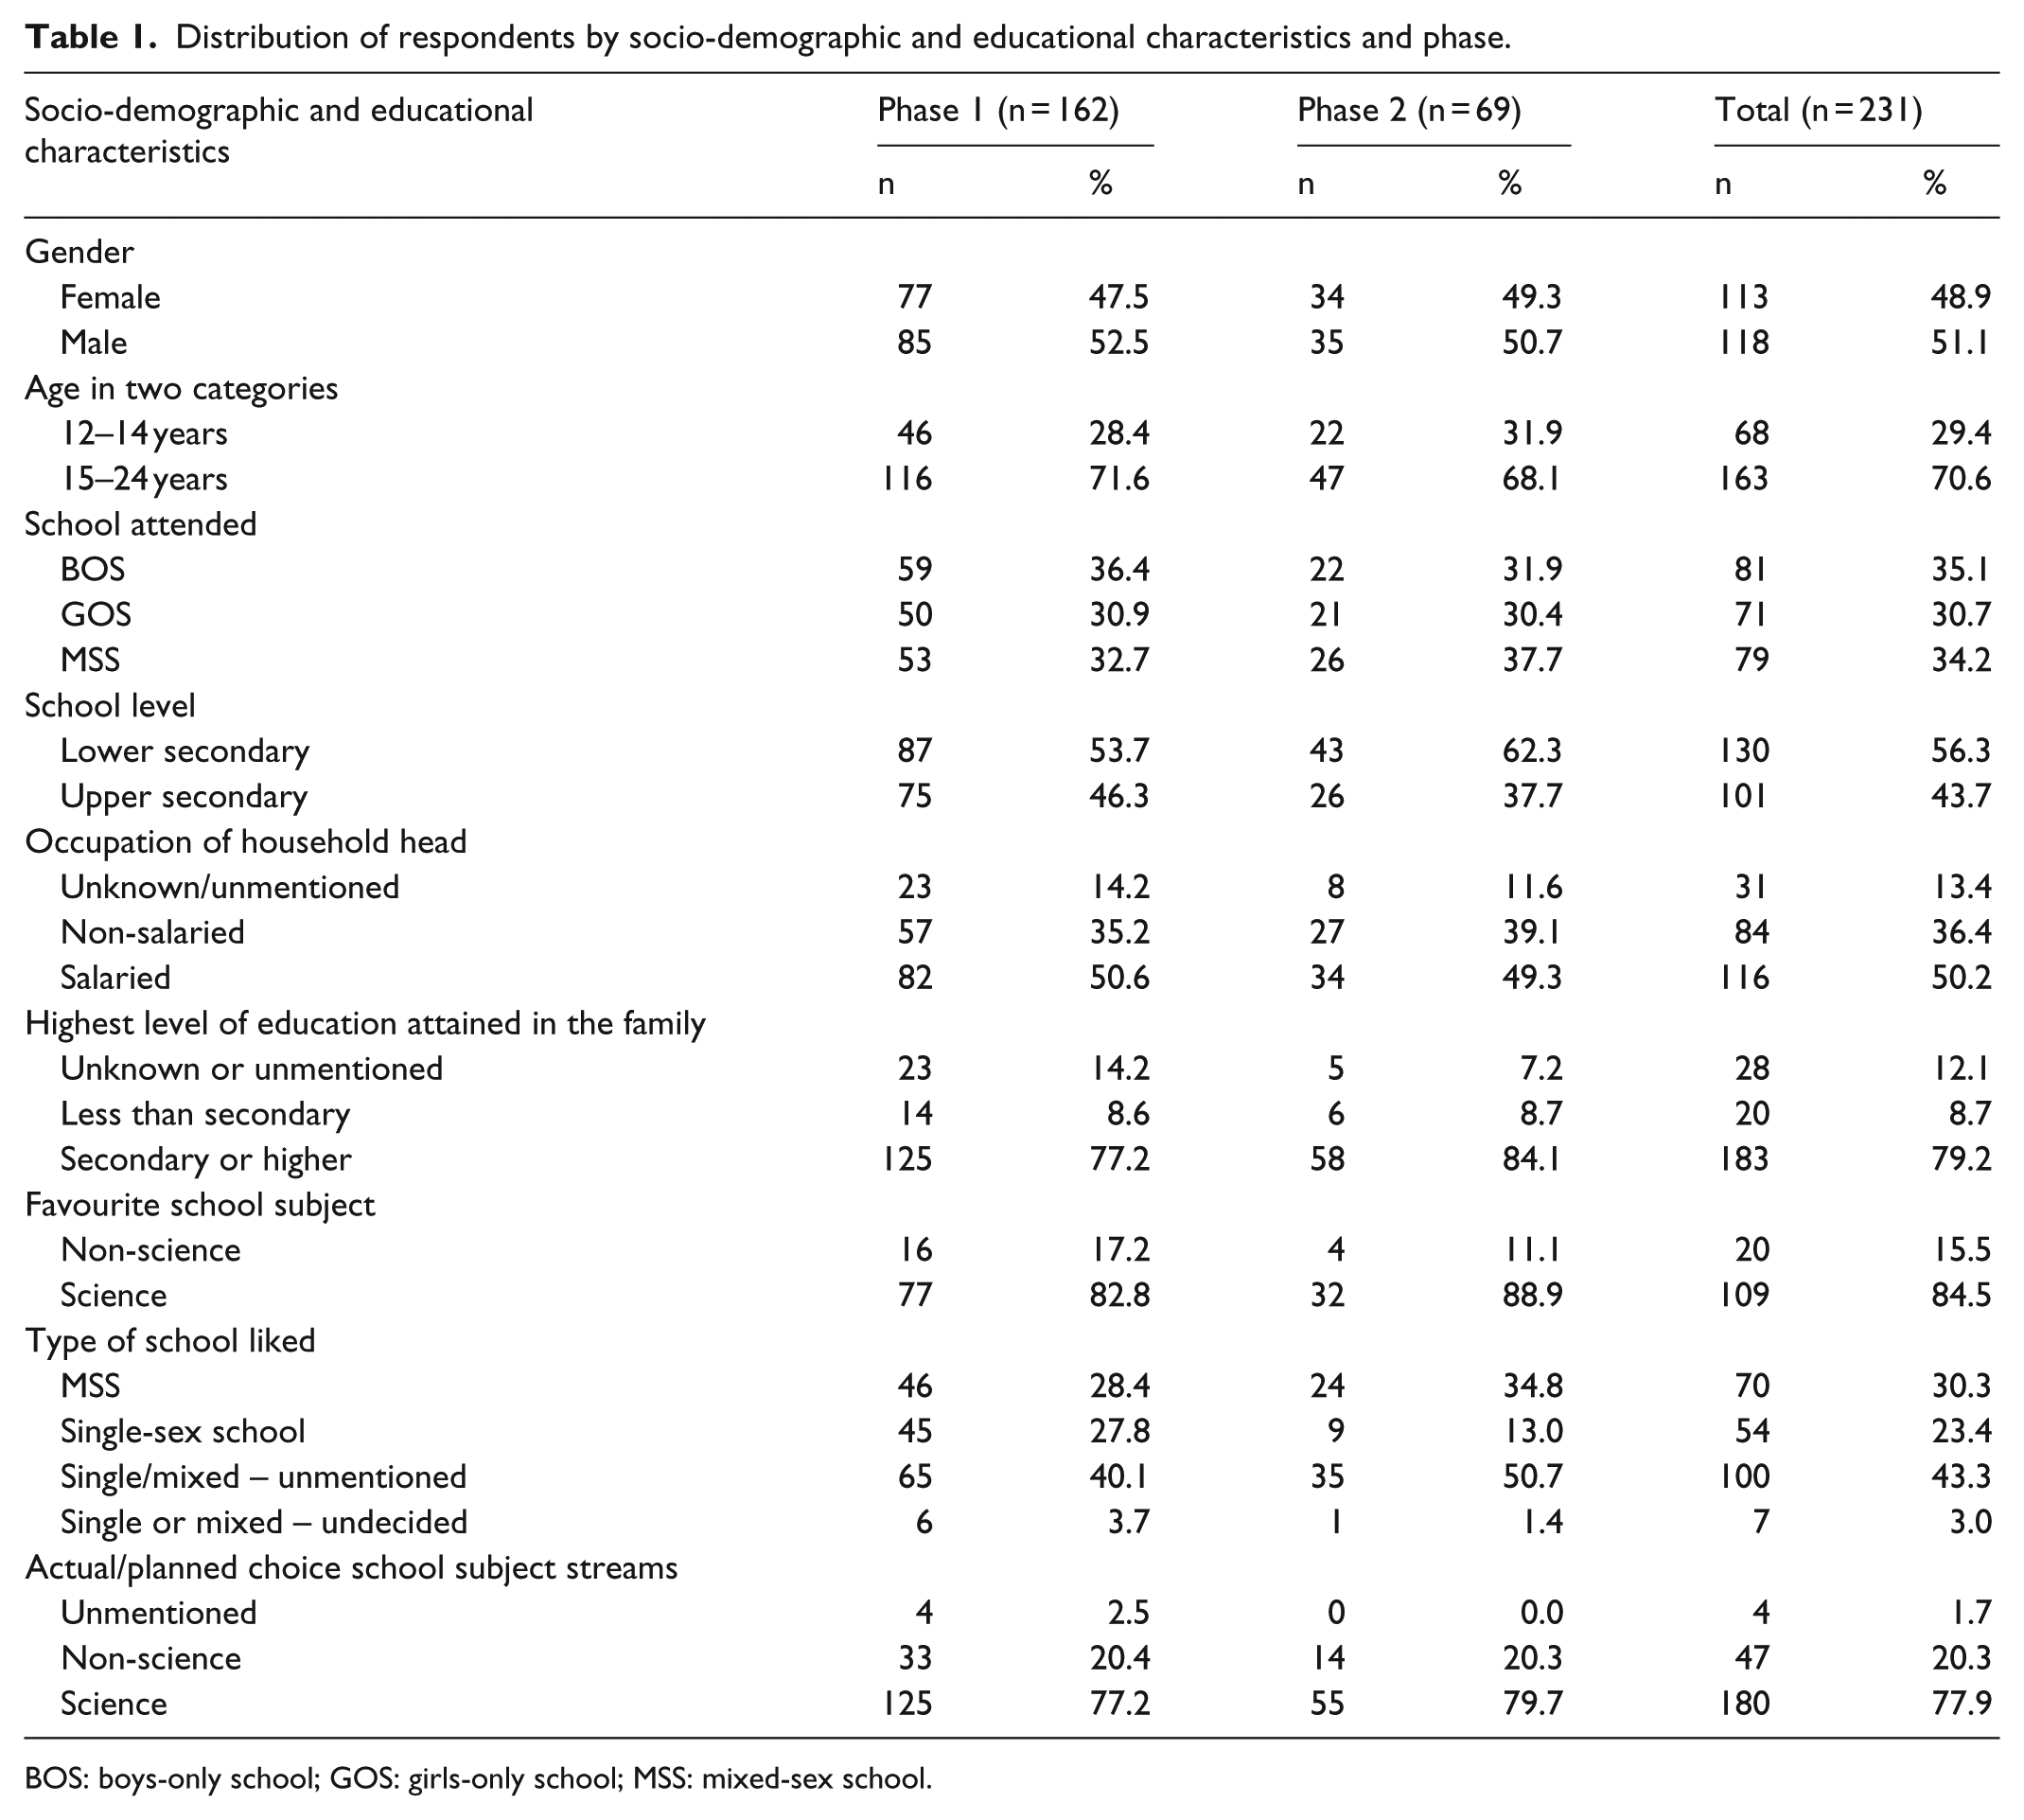
BOS: boys-only school; GOS: girls-only school; MSS: mixed-sex school.
Gender, age and school attended, and level are naturally easy to express into numbers, whether the information is retrieved from the qualitative or quantitative methods strand. When it comes to household income, some participants could not figure out whether the head of their family is in salaried employment or not, which brings about unknown or unmentioned responses. Only salaried versus non-salaried responses are therefore quantitized; the unknown or unmentioned responses (of about 1 in 10 participants) are not quantitized for they have no equivalent in the quantitative strand. A similar pattern is featured under the highest educational level existing in the family; about 1 in 10 participants is unaware of the highest level of education in the family. For favourite school subjects, participants pointed out subjects falling under the realm of science or non-science but the myriad reasons underlying their favourite school subjects remain as qualitative data only, to be used for comprehending their preferences. These reasons behind favourite school subjects remain the sole province of the qualitative strand, non-traceable in the quantitative methods strand. Nearly half of the participants either never mentioned single or mixed-sex school as their preferred type (43%) or squarely remained undecided (3%). When it comes to quantitizing, this is a loss to sample size.
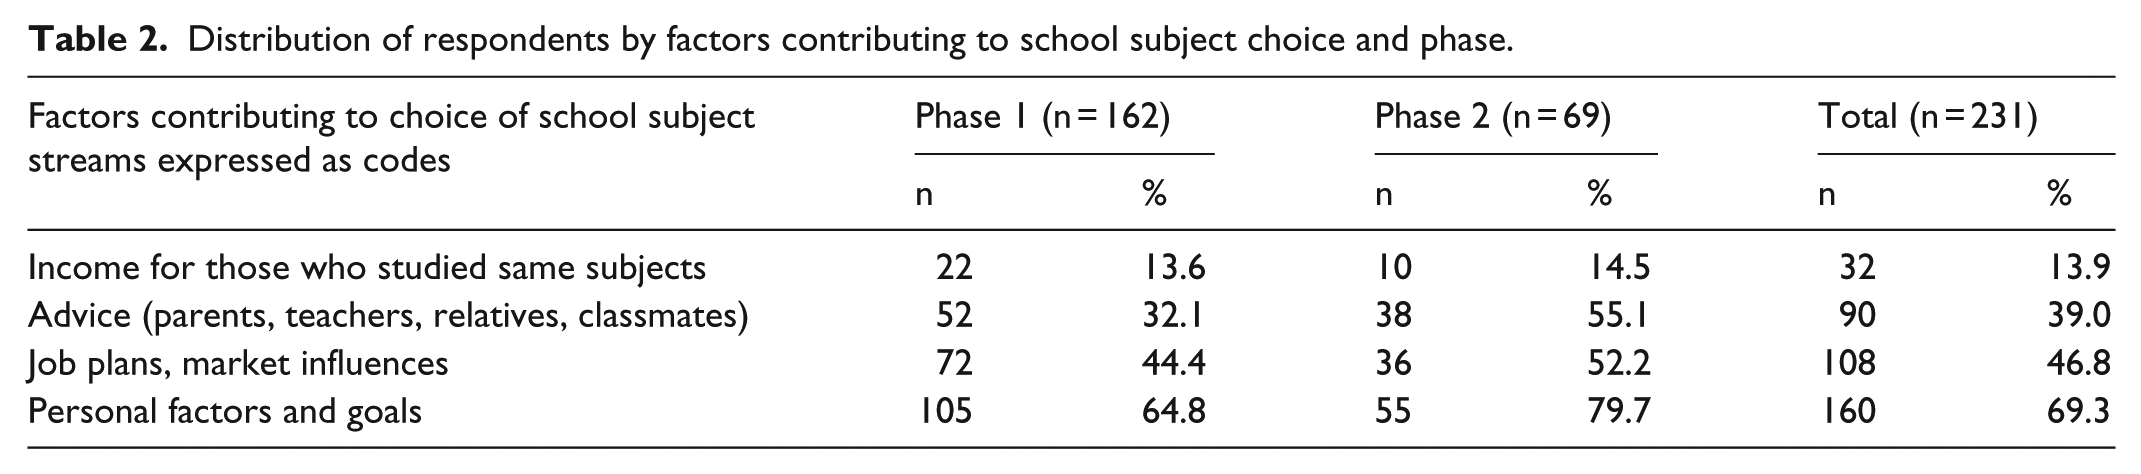
From a relatively large sample in qualitative research (n = 162 at Phase 1, n = 69 at Phase 2), the quantitizing portrays a consistent picture which resurfaces at Phases 1 and 2. Anyone whose narrative does not mention an issue of which responses can be binarized was discarded from the quantitizing. For example, when participants do not mention their favourite school subjects, yet these were categorized as science versus non-science, or cannot tell the highest level of education in their family, educated at least at secondary school level versus less education, such cases were unavoidably collapsed into missing data in the quantitizing process. For issues where quantitizing is confined to simply mentioning something or not, presence or absence in a narrative, the quantitizing is squarely converted into dichotomies. The numbers in each row shown in Table 2 reflect cases which mention the factors contributing to choice of school subjects.
Distribution of respondents by factors contributing to school subject choice and phase.
It is empirically easy to conduct quantitizing based on a priori codes for such codes are easily traceable in and therefore combinable with the quantitative data from the survey questionnaire. A priori codes of the qualitative strand are similar to quantitative-strand responses and can therefore easily be quantitized and merged. Emerging themes, though not much was unexpected in the quantitative strand, are also reported numerically, not for merging with the quantitative strand data but to highlight what would empirically be missing by relying solely on a priori codes and the quantitative strand (Figure 4).
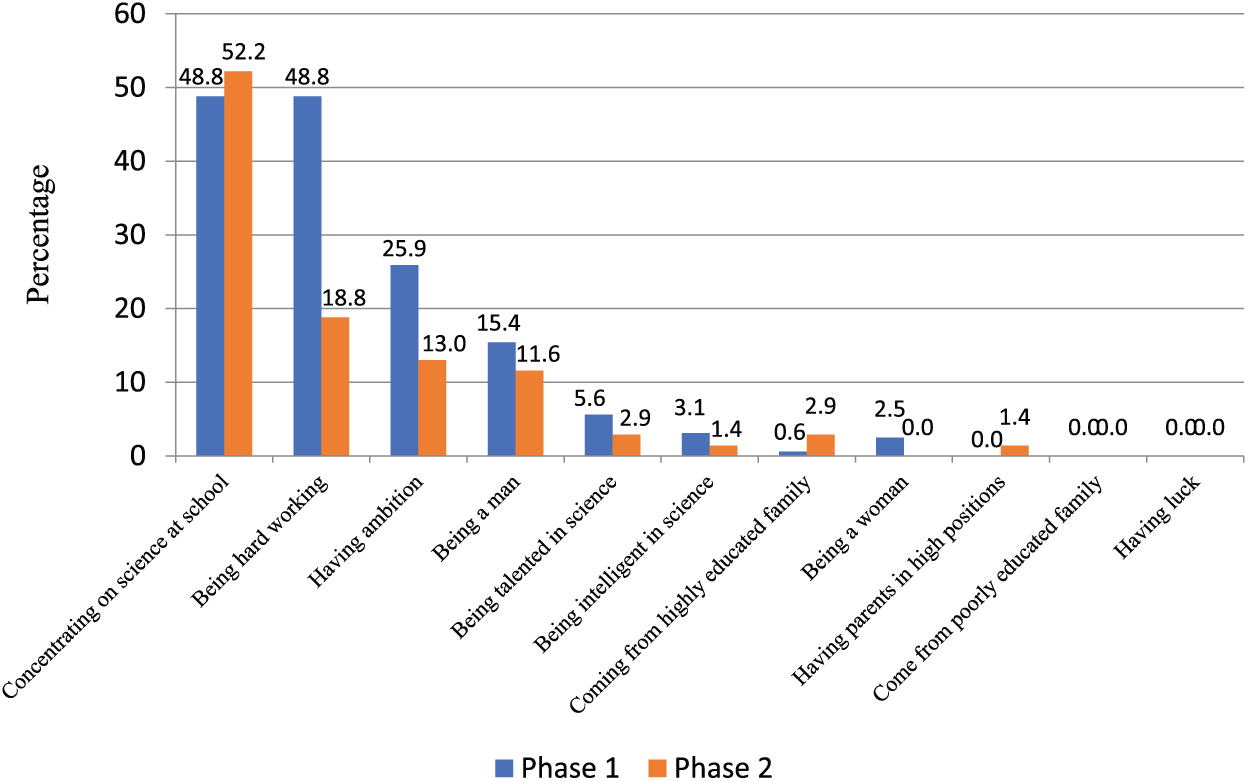
Factors reportedly influencing success in science (a priori codes).
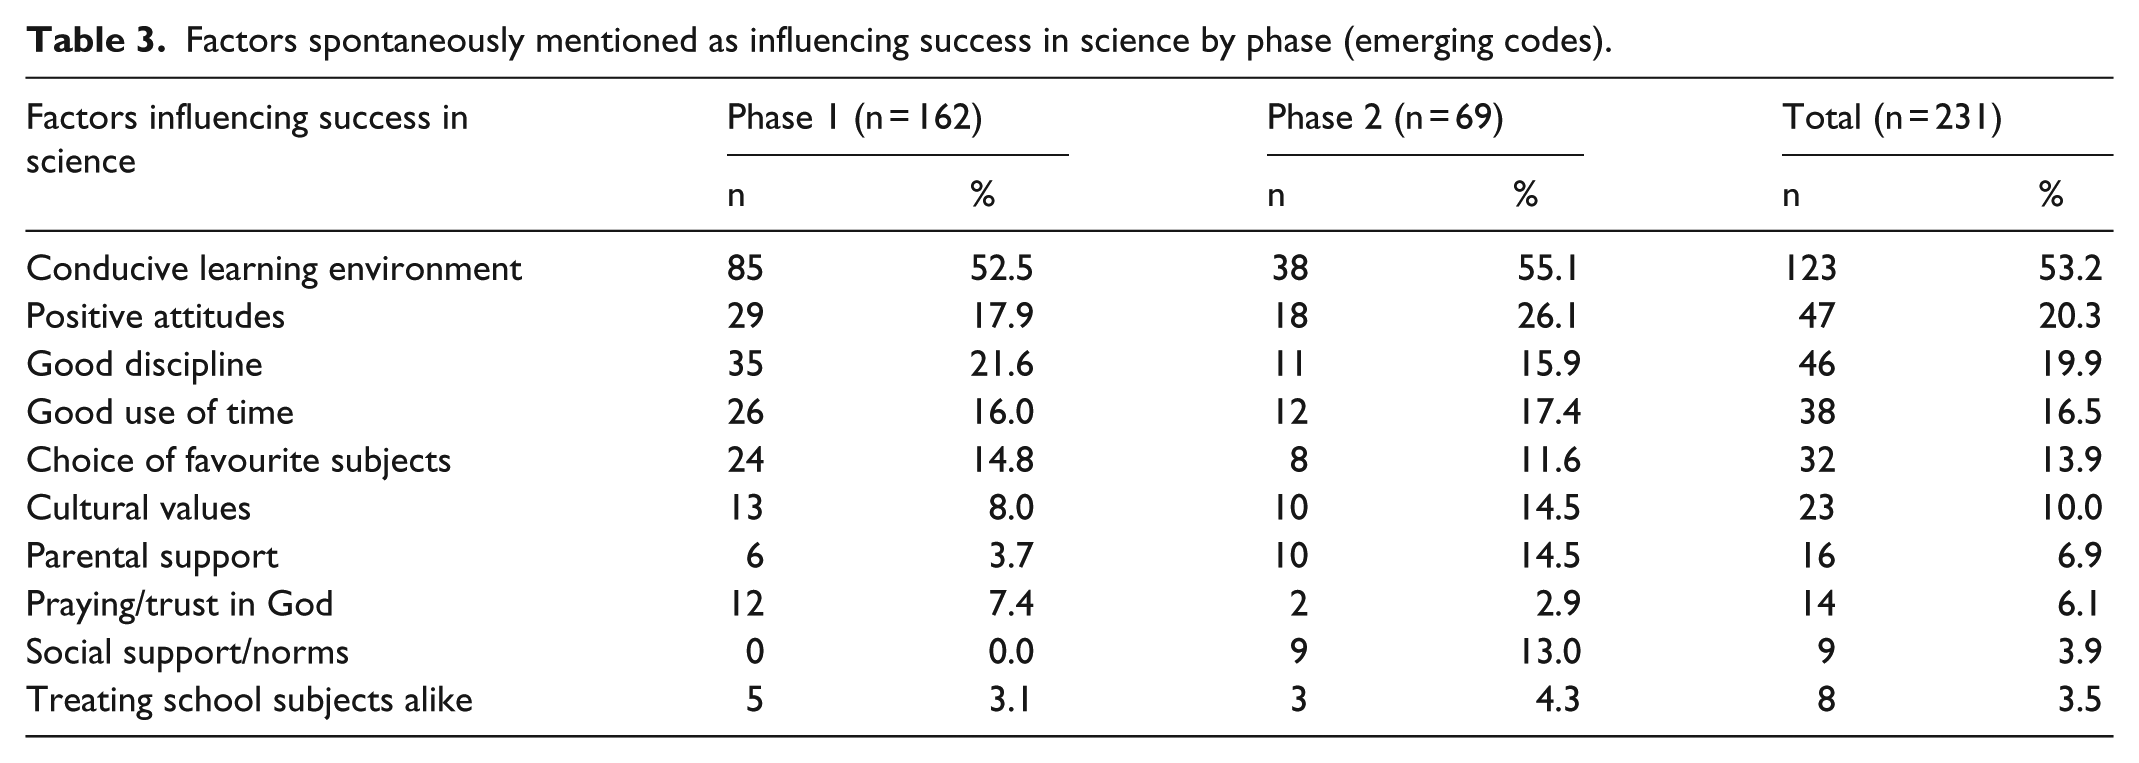
Table 3 presents some other factors generated qualitatively but which, under the survey questionnaire, are not captured as they are not pre-listed. The patterns in the quantitized responses provided during Phases 1 and 2 show that at times Phase-2 responses are higher than Phase-1 responses on some items, while the opposite is also true for other items.
Factors spontaneously mentioned as influencing success in science by phase (emerging codes).
Qualitized results
Most categorical and continuous variables in the quantitative methods strand are dummy-coded to accommodate or be merged with binarized codes from the quantitized qualitative data. Parental advice, teachers’ advice and classmates are analysed as a composite variable and qualitized as factors contributing to choice of school subjects (Cronbach’s alpha = .70). Another subscale of seven items is found reliable (Cronbach’s alpha = .74) and is qualitized as structural factors as reasons underlying the choice of school subject combination, while another set of six items (Cronbach’s alpha = .75) is qualitized as personal factors motivating the choice of school subject combination. While there are other Likert-type scale items on the attitudes towards the role of women in society, only three items loading together emerge internally consistent (Cronbach’s alpha = .73) and are qualitized as positive attitudes towards the role of women in society (Table 4).
Reliability test results and illustrative naming of factors.
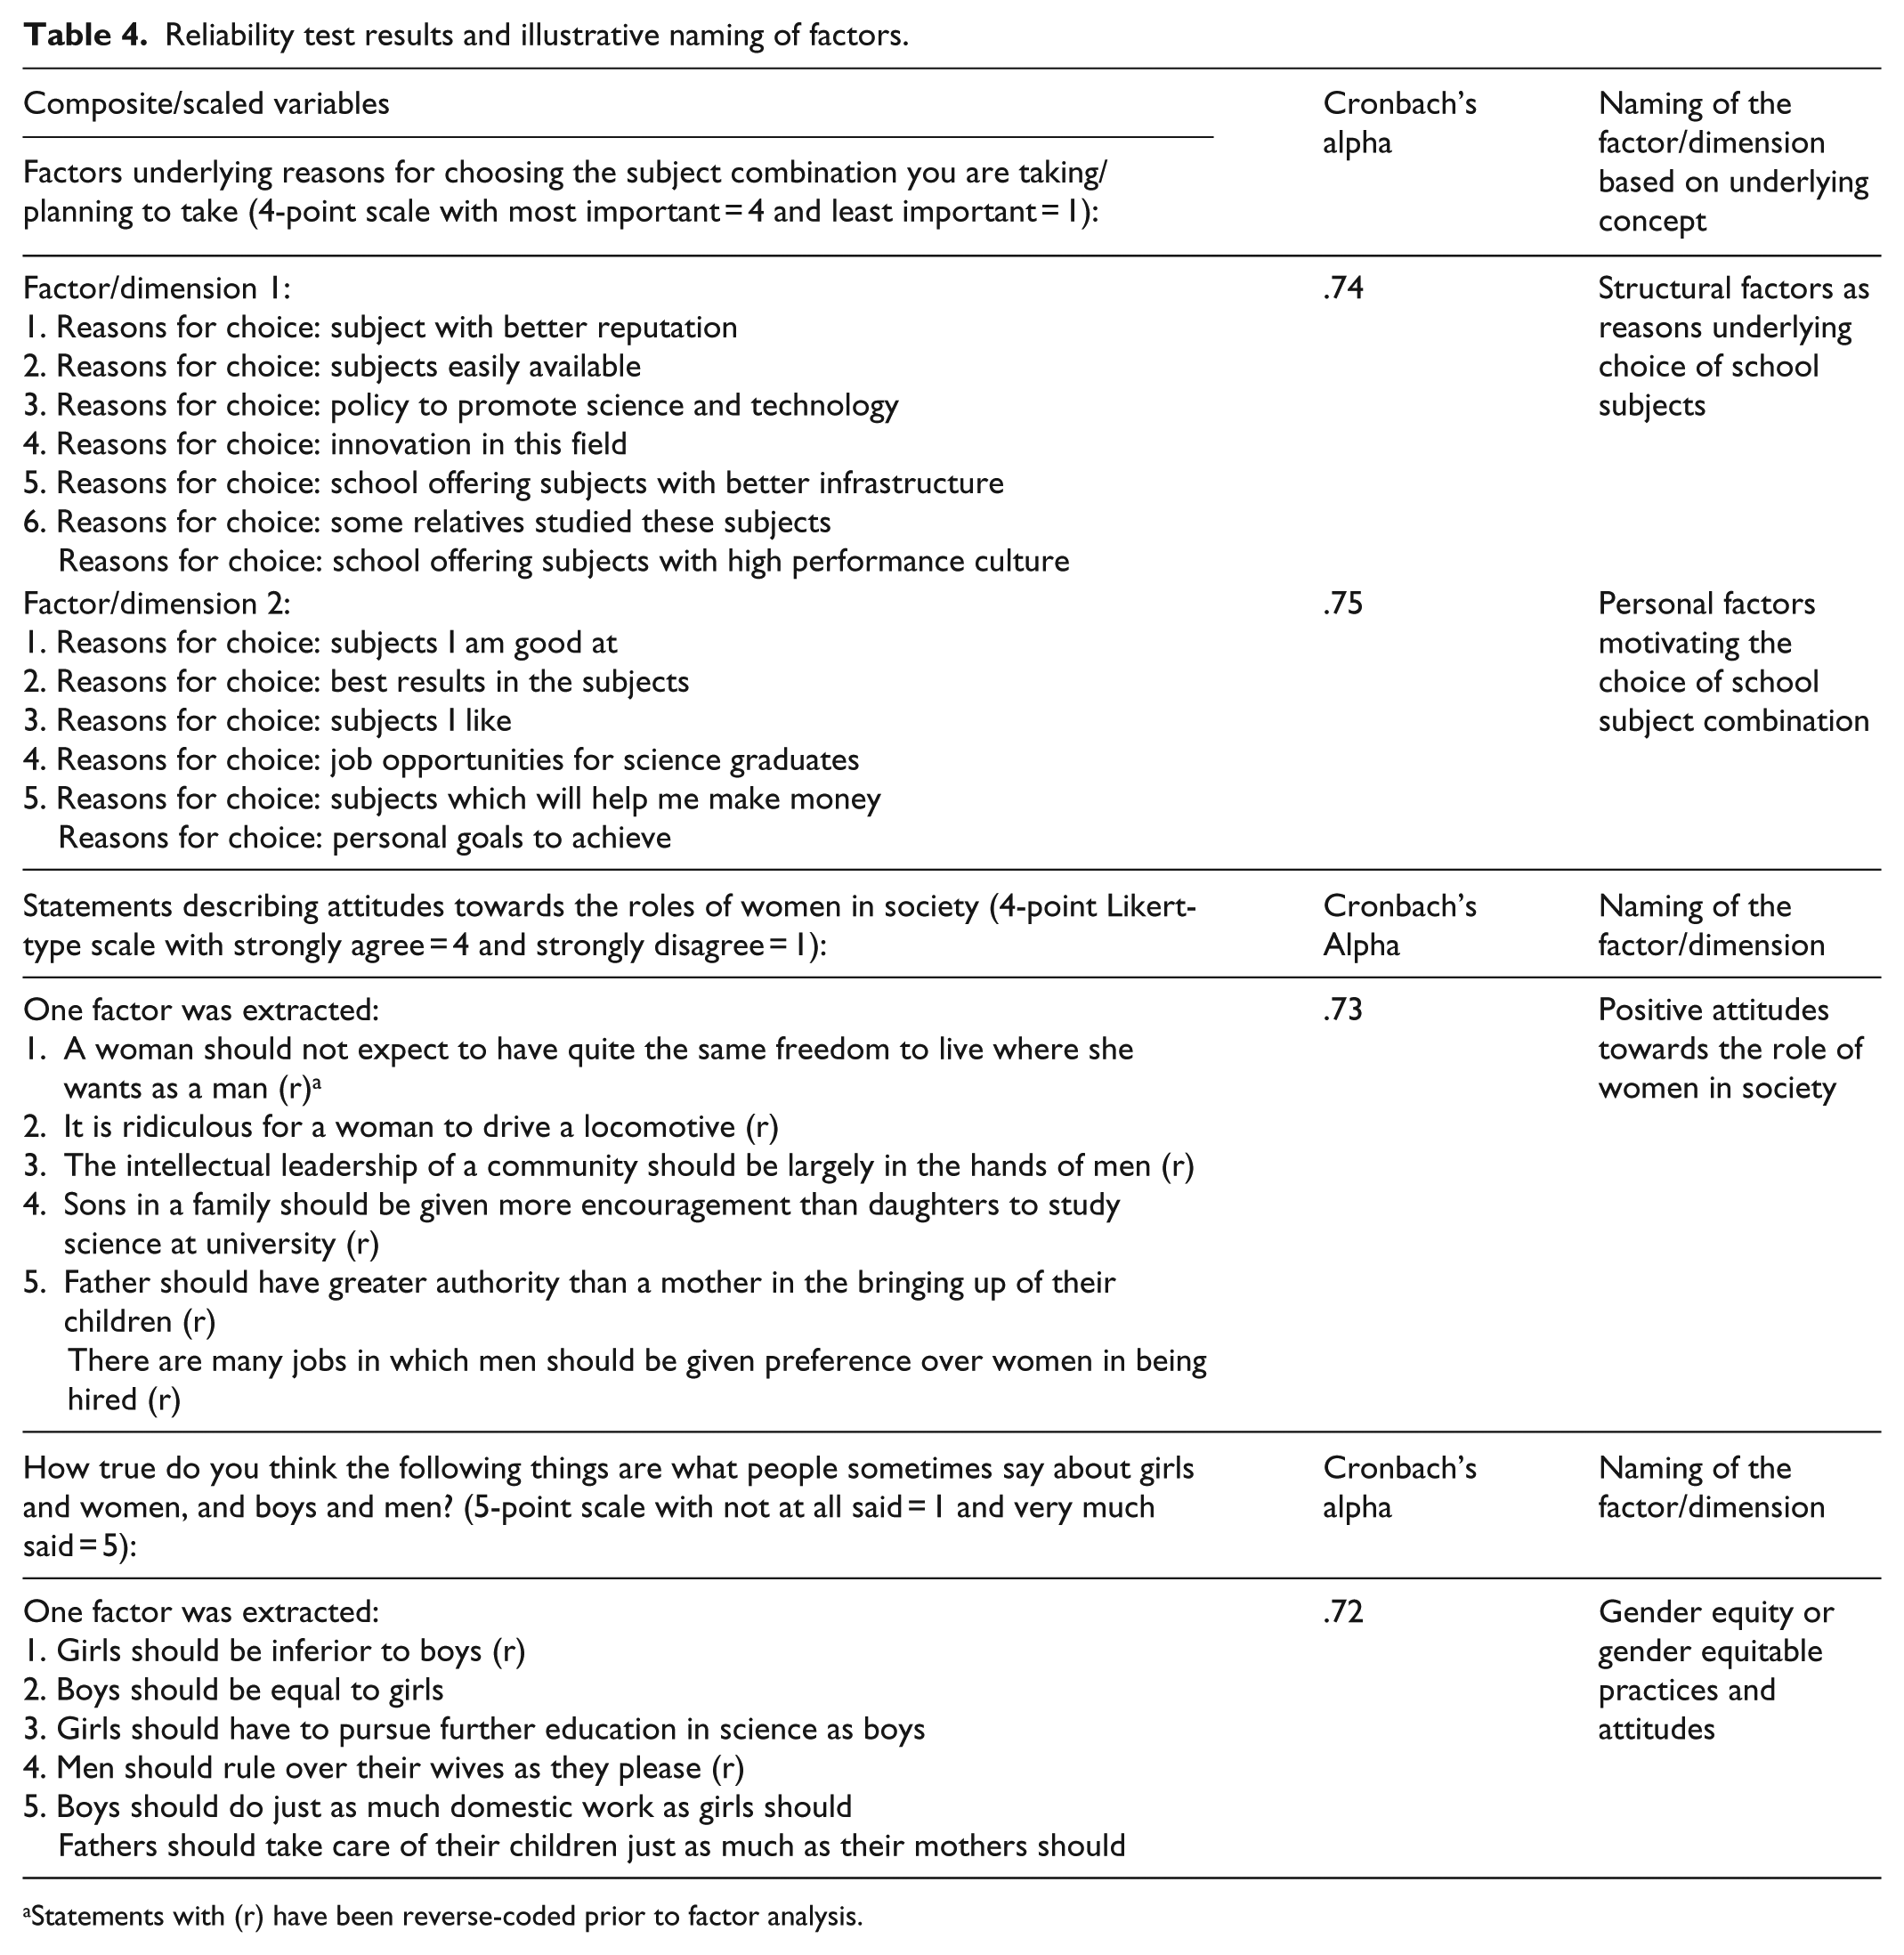
Statements with (r) have been reverse-coded prior to factor analysis.
Respondents are asked to indicate the extent to which they perceive Rwandan society as endorsing certain gender attitudes and practices, and all scaled items converge towards one concept or factor (Cronbach’s alpha = .72) which is termed gender equity or gender equitable practices and attitudes. Having proof that out of the four items constituting the scale, there is conceptually one dimension (Cronbach’s alpha = .80), it was qualitatively taken as positing that science is naturally easier for boys than for girls or male scientific predominance. Another set of scaled items reliably load together to form a concept (Cronbach’s alpha = .76) and this is labelled perceived gendered nature of science. As regards perceived gendered performance in school subjects, three different concepts emerge as having reliable internal consistency. The first subscale is qualitatively labelled perceived gendered performance in science-related subjects (Cronbach’s alpha = .76), the second is named perceived gendered performance in language subjects (Cronbach’s alpha = .75), and the last concept relates to perceived gendered performance in social science subjects (Cronbach’s alpha = .73). Self-confidence, which is mentioned in the qualitative responses as the cornerstone of success in science not only for boys but also for girls, is found falling under two opposing poles: presence versus absence of self-confidence. Both subscales with underlying dimension of self-confidence differ by their contrasting directions: having self-confidence (Cronbach’s alpha = .73) or lacking self-confidence (Cronbach’s alpha = .75) are the key factors mentioned in both methods strands. Not only does this bipolar dimension of self-confidence appear in the quantitative data but also in the qualitative data.
Motivation Likert-type scaled items are also subjected to factor analysis and out of 13 items two factors with internal consistency are extracted. The first factor is qualitized as the prospects offered by science (Cronbach’s alpha = .80) and the second is named science-as-a-springboard to achieve personal goals (Cronbach’s alpha = .78). While it may be surmised that all students value science, two concepts that emerge from the Likert-type scale items point to diametrically opposed stances: the first factor (Cronbach’s alpha = .79) implies the instrumental value attached to science while the second one (Cronbach’s alpha = .76) considers science unnecessary endeavours, suggesting a factor to which non-science students might have contributed. A similar pattern is observed for in-school factors affecting success in science: two factors are reliably extracted and the first (Cronbach’s alpha = .83) shows that there are in-school inhibitors of performance in science while the other one (Cronbach’s alpha = .72) relates to factors positively driving performance in science. The concept which is extracted from planned achievements unearths a factor that qualitatively turns around goals oriented to professional life (Cronbach’s alpha = .77).
Un-quantitizable and un-qualitizable results
There are data and therefore results which were kept in their original format and could not be quantitized (i.e. un-quantitizable) or qualitized (i.e. un-qualitizable). Such data and results include missing data and information, unmentioned, implicit, or unsaid supra-segmental or non-linguistic responses. Some respondents could not specify whether their parents or guardians are in salaried employment or not and some could not figure out the highest educational level attained in their family, presumably the African or Rwandan family in its extended dimension, whence the room for the unknown or un-qualitizable in the case of the qualitative methods, while in the case of the survey questionnaire, respondents could possibly have found something to tick on the list.
On the preference for school type, there are some who consciously or unconsciously never mention or are simply undecided on which type of school they prefer. This middle-ground position blurs their preference for either single- or mixed-sex schools and cannot be dichotomized, hence dropping the cases whose allegiance to either school type is not clear-cut. A blurring picture is also portrayed in choosing the school subjects. The dichotomization allows allocation to science or non-science subjects, but a handful of respondents never mention in their narratives the subject streams they are taking or planning to take during Phase 1 of the study, and consequently not allocated to either science or non-science subjects.
The quantitizing leads to binary of science versus non-science school subjects but leaves out the narratives justifying reasons for the choice. While in the survey questionnaire factors affecting choice of school subjects are empirically identified through correlation analysis and regression modelling, the qualitative strand, in addition to the binary quantitized variables, is coupled with justification motivating or associated with school subject choice. Empirically, the statistical analysis has not detected all the driving factors that the qualitative strand revealed as factors ultimately contributing to choice of school subjects. Specifically, there are girls who want to break barriers into science subjects which have been traditionally the stronghold for boys; their burning desire to overcome the gendered stereotypes are only traceable in their tone and sense of revolt against all sorts of socio-cultural stereotypes that have for long undermined their opportunities to excel in science. Except for the narrative content, these language tones and sense of revolt are not easily quantitizable, unless the process is confined to counting participants whose tone and revolt are raised against the patriarchal order.
Qualitative methods strand produces some un-quantitizable data and results. Some of the interview data are characterized by a tone of surrender to the gender status quo, and therefore the interviews seem to be a rich source of complementary information in an investigation of a complex social phenomenon. The sentiment of opposition against, and weariness with gender-biased practices, is manifest among girls’ narratives. The narratives never seem to betray the homogeneity of the sample; rather, they continually generate complementary evidence: the analysis of and insights from the qualitative data produce similar results across Phase 1 and Phase 2, yet at the latter phase, respondents have already been subjected to a different data collection tool from a different methods strand.
It is common to come across a single statement that could embody all school subjects, rather than gender-labelling each school subject. For example, a statement such as ‘there is no reason to say there are school subjects for girls and others for boys’ (MSS07S5PCM1, Phase 1, 120:20) is coded as de-gendering school subjects, as it reflects the view that all school subjects are studied to an equal extent by all schoolchildren, regardless of their sex, thus assigning a single statement to different but relevant codes. Except scaled questions, subjected to factor analysis, and average profiling, the bulk of the quantitative data are fixed sets of numerical categories and numerical responses which are un-qualitizable.
Discussion
Quantitizing and qualitizing have allowed a twofold analysis of both types of data. Original qualitative data are largely subjected to qualitative analysis and, after quantitizing, to quantitative or statistical analysis. Empirically, there are two types of data in the quantitative strand: the said (what the respondents indicate numerically) and the unsaid (what they never mention – and not much can be done to probe further to understand what the respondent has not said). Empirically, there are three types of data in the qualitative strand: the said (amenable to qualitative data analysis and to some extent quantitizable), the semi-said (the implicitly mentioned responses, including the non-verbal, easy to analyse qualitatively but somehow un-quantitizable at least into dichotomies), and the unsaid, which resembles the unsaid in the quantitative strand. The said and the semi-said make up the salient responses that easily come to the surface or that respondents are willing to disclose. The unsaid is the silence in both methods strands, the silence that MacLure et al. (2010) call ‘unspeakable and unanalyzable’. In a self-administered survey questionnaire, silence leaves blank, unanalyzable space, but silences in face-to-face interviews are manifestly meaningful when accompanied by any linguistic symbols, verbal or non-verbal, in which case they become semi-said, giving a glimpse into something. Whether in qualitative or quantitative research, without leaving a clue behind, there are types of data that cannot easily be rendered into another form or subjected to conversion. Possibilities exist and range from the easy-to-do to the impossible-to-convert.
To count the uncountable (Sandelowski et al., 2009) or say the unsaid with methodological objectivity and rigour is not straightforward. First, the supra-segmental tone, hesitation and mood features of the participants’ verbal and non-verbal semantics cannot easily be rendered into numerical terms. It is all about approximations, especially when one tries to be accurate, with possibilities of betraying the original responses as intended by the study participants. Second, there are topics which can only surface to the mind of respondents upon mentioning the issue to them; without the probing naturally existing in the qualitative interviews, the inner part of the surfacing responses remains unattainable. This is the case for getting married or having children after completion of secondary school, which is untouched in the narratives, and therefore nonexistent in the quantitized qualitative data, but easy to point to in the survey questionnaire. Lack of significant differences between the quantitative and quantitized qualitative results constitutes evidence that respondents may converge in their responses, regardless of whether data are quantitative or quantitized qualitative. Impersonal, communal issues can be investigated using both quantitative and quantitized qualitative data and uniformity in the response patterns may be reached. However, the significant differences observed on sensitive topics suggest multiple perspectives exist, and consequently there is the possibility of generating different and salient responses and patterns between the quantitative and qualitative methods strands.
Although not usually identified in research reports as qualitative profiling, the average profiling is commonly used to describe samples and to interpret research results (Sandelowski, 2000: 253), and has therefore been used to arrive at the shared attributes among the scaled items reliably loading onto one dimension or concept in the factor analysis. These qualitized results or qualitative profiles generated from the underlying dimensions across interrelated items are given a name that reflects the shared attributes and then compared to other original profiles from the qualitative strand. Linking numerical responses to qualitative nuances that trigger them is used to arrive at meaningful interpretation of the quantitative results. For example, to find out when respondents became interested in the school subjects they are taking or planning to take, they are asked, ‘As far as you can remember, when did you for the first time become interested in the school-subject combination you are taking or planning to take? Circle ONLY ONE answer’ and the answer options included ‘not interested’, ‘got interested at nursery school’, ‘got interested at home before going to primary school’, ‘got interested at lower primary school’, ‘got interested at upper primary school’, ‘got interested at lower secondary school’, and ‘got interested at upper secondary school’. The purpose of this question is to find out how much early or late schoolchildren get interested in school subjects, whether before any form of schooling, at preschool age or at primary or secondary school level. These are easily linked to the two qualitative codes that emerged from the analysis: interested in school subject at primary or earlier and interested in school subject at secondary school level. The numerical responses cannot make sense without reference to these developmental educational stages, which requires qualitative lenses and contexts throughout to understand the meaning attached to numbers.
Despite the fact that code frequencies may bring to the surface influential codes or themes worth highlighting in quantitized qualitative data, they may also be misleading, as repetitive respondents’ views would prevail over those of respondents who are concise and to the point. This has led to underplaying the number of times codes are mentioned by a participant and only systematically retained 1 for each code, regardless of the number of times it is repeated. In other words, coding for existence proved empirically more useful and practical in this study than coding for frequencies. Using chi-square, p-values and effect sizes, the study proves that, despite participating twice in the study, with the second-phase likely to be stained or influenced by Phase-1 participation, qualitative responses did not significantly differ across phases. Using these statistical techniques does not undermine the possibility to perform qualitative analyses on raw, non-quantitized data; rather it adds convergent validity to and strengthen the study findings.
Qualitized through factor analysis and average profiling, quantitative data do not offer many conversion possibilities. On one hand, extracted factors were given a qualitative appellation, usually reflecting the conceptual category that underlies the scaled question. On the other hand, a shared conceptual denominator is identified by collapsing different categories into dummies – for example, educated versus non-educated, early versus late schooling age, and self-confidence versus lack of self-confidence. The limited process of qualitizing quantitative data proves that the quantitative and the qualitative are intertwined in the process of instrument development which begins with conceptualization and operationalization expressed in qualitative terms and is eventually measured in quantitative terms. When quantitative data are qualitized, the researcher is engaged in back-conversion: getting numerical data back to their operationalized qualitative terms through average profiling and dimension extraction. As the existing literature reveals, there is an interpretative gesture in quantitative measurement design (Sandelowski et al. 2009: 213) and ensuing results. By qualitizing, especially for scaled questions, the process amounts to driving back to operationalized and underlying concept that led to numerical responses. It has been noted, at least in this study, that qualitizing works optimally with scaled items, indicating much more likelihood of qualitizing than quantitizing impossibilities in mixed methods research. The post-positivistic stance or the commonly accepted pragmatic stance in mixed methods research allowed the back-and-forth drawing and interaction of meta-inferences from the explicit and implicit qualitative and quantitized hard data. From the post-positivistic stance, it is also worth noting that not all data can be subjected to quantitizing or qualitizing, using analytical techniques of the paradigmatic lenses that generate such data in their un-converted format; hence there is some room for un-quantitizability and un-qualitizability of data for mixed methods data integration.
Conclusion
Methodological reflections
In this methodological inquiry, I investigated quantitizing and qualitizing possibilities and impossibilities, integrating data to interrogate merits and demerits of data integration in mixed methods research. Despite the fact that the two-phase convergent parallel mixed methods design offers advantage of looking into issues surrounding concurrent and sequential designs, data from participants in the sequential component of the study, that is, those who participated in both phases of the study, are empirically more revealing and robust than single-phase participants. Concurrent-design participants do not offer insights as regards switching qualitative with quantitative instruments. Quantitizing and qualitizing in mixed methods, it can be argued, are more relevant for complementarity than for triangulation.
Evidence abounds on the possibilities offered but also on the deterrence of impossibilities existing mainly due to methodological allegiance and political reasons. There is nothing set in stone, not amenable to both quantitative and qualitative terms of expression; there are many overlaps and opportunities for cross-validation. In this article, it has been demonstrated how to quantitize the qualitative data to a great extent but also the qualitizing of quantitative data has been demonstrated. The salience and importance of qualitative codes do not suffice in mixed methods, but the additional analyses of raw data help control for confounding variables and estimate the likelihood of expressing the outcome theme or variable given other predictor variables (Collingridge, 2013: 86, 87). The possibilities offered by quantitizing make this process popular in mixed methods studies (Collingridge, 2013: 82; Teddlie and Tashakkori, 2006) but qualitizing possibilities have a long way to go.
There are more possibilities than impossibilities to empirically quantitize and qualitize, but not in all instances should researchers expect to convert data from one paradigm to another. On one hand, quantitizing is more used and documented than qualitizing, with software available to help navigate this data conversion strategy. On the other hand, qualitizing is the least practised in data conversion and may still lag behind, for the closed-ended and numerically answered questionnaire does not offer much that can be taken back into narratives, unless in the form of data interpretation. The merits of quantitizing and qualitizing render the mixed methods a unified approach empirically shedding light on social inquiries. In this article, three-fold types of data analysis were identified, all of which are required for mixed methods research data to be empirically integrated to inform social inquiry: qualitative analysis of qualitized data, quantitative analysis of the quantitized data and hybrid analysis of un-quantitized and un-qualitized data. There are no pure quantitative methods which do not involve qualitative thinking from the stage of design by the researcher, through data collection by study participants, into data analysis and interpretation by the researcher (Chang et al., 2009: 850; Sandelowski, 2014: 5; Sandelowski, et al., 2009: 209). The correlation existing between quantitized qualitative and quantitative data and the types of analyses proposed for integrated mixed methods research prove the methodological overlaps. For mixed methods researchers, the findings show that beyond similarities and dissimilarities in findings across methods strands, integrated data analysis does not exclude methods-specific data analysis for optimal retrieval of insights from all pieces of data available.
Whether in qualitative or quantitative research, interest is respectively in the story by study participants and the researcher’s pre-existing category-based story which is taken as an evidence-based worldview. The findings reveal that sometimes the researcher’s pre-existing itemized story may converge but also diverge from the study participants’ stories. Mixed methods research with full integration of both data types shows that respondents can understand the conceptual frameworks and items thereof as designed by the survey researcher, but it is when study participants’ un-imposed narratives are contrasted with the researcher’s quantitative conceptual frameworks that comprehensive accounts of social phenomena are uncovered. Despite the pretesting of the data collection tools which allows their improvement, all themes and insights cannot be exhausted within a specific timeframe – hence the emerging themes. There is a gap in our empirical knowledge of whether the unsaid traceable in qualitative methods strand can be said in the quantitative strand, and vice versa. There is an empirical gap in our knowledge of whether the unsaid of qualitative methods can be correlated with the unsaid of quantitative methods. Making sense of data, telling and interpreting stories, exist in both methods strands but at different levels and following different trajectories: for the qualitative strand, it is the time-evolving process that starts with the design, data collection, through to data analysis and interpretation, while for the quantitative methods strand they take place during the design and interpretation stages.
Further research
More quantitative data analysis can be performed, for the possibilities offered by existing software are many, but very little, if any, exists for qualitizing. Qualitizing is linked to a limited number of occasions where this data conversion strategy can apply, especially in factor analysis where a qualitative representation is required for the extracted factor. There is room for further investigation of qualitizing in mixed methods research. As most qualitative and quantitative software promote quantitizing to the detriment of qualitizing, the qualitative component in mixed methods is struggling to forge its way through the highly quantitative tradition usually labelled rigorous and scientific (Sandelowski et al., 2009). As qualitative software gains ground, efforts are still geared towards sophisticating the qualitative analysis in the same way as the quantitative one. However, despite the political and marketing strategies behind the development of qualitative software, is the advent of qualitizing modules expected to guide mixed methods researchers on how to qualitize quantitative data systematically, not how to quantitize the qualitative data as is the case for the time being? Otherwise, it is likely to end up with the quantitative paradigm relegating the qualitative strand to the background in what would then be so-called mixed methods research (Nzabonimpa and Prozesky, in press; Sandelowski et al., 2009).
Footnotes
Acknowledgements
The author is grateful to Professors Pamela Abbott and Roger Sapsford of the University of Aberdeen, UK, for their comments on the first draft of the manuscript. The author would also like to thank and acknowledge Dr Heidi Prozesky of the Centre for Research on Evaluation, Science and Technology and DST-NRF Centre of Excellence in Scientometrics and STI Policy, Stellenbosch University, South Africa, for her rigorous supervision and guidance throughout the doctoral journey, of which this article is an outcome. This manuscript is based on some of the research conducted by the author for his PhD in Social Science Methods at Stellenbosch University’s Department of Sociology and Social Anthropology in 2016.
Declaration of conflicting interests
The author(s) declared no potential conflicts of interest with respect to the research, authorship and/or publication of this article.
Funding
The author(s) received no financial support for the research, authorship and/or publication of this article.