
Abstract
In Alzheimer’s disease (AD), the presence of amyloid-β peptide may impair cell energy formation by altering both anaerobic and aerobic metabolism. This study aimed to estimate possible alterations in circulating energy substrates. In 54 community-dwelling AD subjects, fasting peripheral venous blood samples were drawn in the morning to determine the energy substrates lactate, pyruvate and ketone bodies (KBs, β-hydroxybutyrate and acetoacetate). Plasma lactate levels in the entire AD population were significantly lower than in healthy controls (P < 0.01), whereas pyruvate concentrations were similar. This is particularly evident in AD subjects with diagnosis time >5 years. Moreover, both plasma lactate and pyruvate were lower in subjects with AD >5 years than in subjects with AD ⩽5 years (P < 0.001 for lactate; P = 0.04 for pyruvate). KB concentrations were normal in both subgroups. Lactate was inversely related to diagnosis time (r = −0.42; P = 0.002). In conclusion, subjects with AD, particularly those with a longer diagnosis time, show considerable reductions in circulating lactate and pyruvate as an expression of altered muscular metabolic pathways that generate energy.
Introduction
Alzheimer’s disease (AD) is characterised by both central (brain) symptoms, such as cognitive impairment and neuropsychiatric disturbances, and peripheral alterations that include loss of motor function and functional decline.
In AD subjects, functional decline may result from combined AD- 1 and ageing-related symptoms. 2 A combination of these symptoms is particularly harmful to patients for functional and life 3 prognoses.
Although central mechanisms are mainly responsible for motor dysfunction in AD individuals, skeletal muscle damage also plays a role. Initially, muscle damage can take the form of structural and functional alterations in mitochondria 4 and subsequently as an accumulation of the pathogenic amyloid-β (Aβ) peptide 5 following mitochondrial dysfunction. Indeed, the skeletal muscles of AD patients have increased levels of Aβ peptide. The negative impact of Aβ peptide was documented in an experimental model of mice with AD, 5 in which the peptide disrupted the resting membrane potential of skeletal muscle fibres and changed both the morphology and the function of muscle mitochondria, the main site of energy formation. Toxicity by Aβ peptide is also exerted on the glycolytic pathway in skeletal muscle tissue 6 and in the brain. 7 All these studies suggest that there is a lack of muscle energy production in AD patients.
In this study, we formulated three hypotheses. First, AD patients may have reduced availability in circulating lactate and pyruvate substrates, indicating abnormalities in the glycolytic pathway, especially from skeletal muscle tissue, which normally represents a large proportion (40%) of body weight (BW). Second, the concentrations of lactate and pyruvate may be associated with the duration of AD. Finally, abnormalities in energy production may be compensated by increased formation of ketone bodies.
Patients and methods
Population
A total of 54 subjects with long-term (4.84 ± 2.89 years, median: 5, range: 1–12) clinical diagnosis of AD, who were living at home, were enrolled in this observational study. The entire population had severe cognitive dysfunction (Mini–Mental State Examination (MMSE): 12.76 ± 5.48 scores; normal value: ⩾25 scores; severe cognitive dysfunction: ⩽18 scores; mild–moderate cognitive dysfunction: >18 and ⩽ 24 scores). MMSE had been carried out by neurologists. The diagnosis of AD was based on the Diagnostic and Statistical Manual of Mental Disorders (4th edn; DSM-IV 8 ) and the NINCDS-ADRDA criteria (National Institute of Neurological and Communicative Disorders and Stroke and the Alzheimer’s Disease and Related Disorders Association). 9 Patients with chronic lower limb obliterative arterial or venous diseases were excluded.
In total, 17 males and 37 females (mean age: 82.9 ± 7.15 years, median: 83, range: 65–95) were eligible for the study.
Subjects attended the nutritional service of S. Margherita Institute (Pavia, Italy) every 6 months where their nutritional status was evaluated (body composition and nutritional intakes) and where they received dietary recommendations and, when necessary, oral nutritional supplementation.
The patients and their relatives were informed of the purposes, procedures and aims of the study. They gave their written consent and the protocol was approved by the local Ethical Scientific Committee.
Overall, 22 healthy individuals (negative pathological anamnesis, no clinical signs or instrumental findings of disease), matched by age, sex and body mass index (BMI), served as a control group.
Procedures
The following measures were performed in both patients and healthy controls.
As established, at 8 a.m. after 12 h of overnight fasting, blood samples were drawn from an antecubital vein and immediately delivered to the laboratory where plasma was obtained from heparinized blood using centrifugation (800g, 15 min).
Besides routine biohumoral parameters, the following substrates were assessed using a microplate spectrophotometer (BioTek ELx800, BioTek Instruments Highland Park, Winooski, USA):
Lactate. Plasma levels of lactate were measured using the ‘Lactate Colorimetric Assay Kit II’ (BioVision Incorporated, Milpitas, CA, USA) according to the manufacturer’s instructions (normal value: 0.4–2.0 µmol/mL). Increased plasma lactate levels indicate prevalence of anaerobic rather than aerobic pathways for the cellular generation of energy.
Pyruvate. Plasma levels of pyruvate were measured using the ‘Pyruvate Colorimetric/Fluorometric Assay Kit’ (BioVision Incorporated) according to the manufacturer’s instructions (normal value: 0.042–0.130 µmol/mL). Pyruvate is the first mitochondrial substrate to be processed in the tricarboxylic acid cycle (TCA). Alterations in normal plasma pyruvate levels suggest some inadequacy in TCA function.
Ketone bodies. β-hydroxybutyrate (β-HB) and acetoacetate (AcAc) were measured, the former using the ‘β-hydroxybutyrate (Ketone Body) Colorimetric Assay Kit’ (Cayman Chemical Company, Ann Arbor, MI, USA) according to the manufacturer’s instructions (normal value: 0.05–0.17 µmol/mL), and the latter by using the ‘Acetoacetate Colorimetric Assay Kit’ (BioVision Incorporated, Milpitas, CA, USA) according to the manufacturer’s instructions (normal value: 0.018–0.078 µmol/mL). Increased plasma levels of KBs indicate increased production by the liver. KBs serve to provide body districts (including the brain, the myocardium and skeletal muscle) with energetic substrates in the case of starvation or high fat intake.
Both lactate and pyruvate were also normalised for fat-free mass (FFM) in healthy and AD individuals.
Nutritional evaluation and intakes
BW (kg) and height (m) were measured. BMI, commonly used in clinical practice, was calculated as kg/m2.
Body composition (FFM (kg) and fat mass (FM, kg)) was measured by dual x-ray densitometry (DXA) using a Lunar Prodigy DXA (GE Medical Systems, Waukesha, WI, USA). The in vivo coefficients of variations were 0.89% and 0.48% for FM and FFM, respectively.
Nutritional intakes.
These were not determined in healthy controls.
Daily average energy (kcal), carbohydrate (CHO, g), lipid (g) and protein (g) intakes were calculated from a 3-day diet diary, in which patients’ relatives/caregivers had reported cooked and uncooked food, type of food, and weight before and after consumption. Nutritional analysis, as described elsewhere, was conducted on the foods that were actually ingested.
Muscle function
Muscle strength was measured by means of the hydraulic hand dynamometer Jamar 5030JI (Sammons Preston, Bolingbrook, IL, USA). The dynamometer is an instrument which objectively and quantitatively evaluates physical parameters of the muscle function in different joints.
Subjects performed three maximal hand contractions with a 15-s interval between each one and the average value was recorded; both hands were tested. The measurement was performed in the sitting position with the arm held comfortably. Muscle strength was expressed in kg.
Patient physical autonomy
Healthy controls obviously had no physical limitations.
The participants’ ability to care for themselves was assessed with the Katz Index of independence in activities of daily living (ADL; normal values: 6 points) and Barthel Index (100 points: full autonomy; 90–99 points: light dependency; 60–89 points: moderate dependency; 21–59 points: severe dependency; 0–20 points: full dependency).
Statistical analysis
Descriptive analysis (mean ± standard deviation (SD)) was conducted to describe the characteristics of the entire population. Chi-square (χ2) test for categorical variables and unpaired Student’s t-test for continuous variables were used to compare the AD population with healthy subjects. Thereafter, the AD population was stratified into two subgroups according to diagnosis time (DT): one with DT ⩽ 5 years, the other with DT >5 years. Differences between healthy subjects and these two stratified subgroups of AD patients were estimated using one-way analysis of variance (ANOVA) followed by Tukey’s post hoc test.
Pearson’s linear correlation was used to show relationships between energy substrates (lactate, pyruvate and KBs) and the other subjects’ variables. The level of significance was set at P < 0.05. Statistical analyses were performed using R version 3.2.2.
Results
Table 1 reports the demographic-, anthropometric- and clinical characteristics, routine biohumoral variables, nutritional status, muscle strength and functional state of the AD population and, when relevant, of healthy elderly subjects.
Demographic-, anthropometric- and clinical characteristics, routine biohumoral variables, muscle strength, functional state and nutritional status of the AD population and healthy elderly individuals, when relevant.

Values are expressed as mean ± standard deviation and median, when relevant. Normal values (nv) in brackets.
Normal value of the test.
All the variables except for lactate, muscle strength and physical performance in their ADL were similar in AD subjects and healthy controls. With respect to plasma lactate, there was a significant reduction in the energetic substrate in subjects with AD (P < 0.01). Interestingly, lactate remained lower in subjects with AD even after normalisation for FFM (P = 0.03; Table 1). The subjects with AD, compared to healthy subjects, had important reductions in both muscle strength and physical performance in their ADL, but similar body composition.
After AD stratification according to DT (DT ⩽ 5 years and DT > 5 years; Table 2), in comparison with healthy subjects, we observed that patients with AD ⩽5 years had reduced pyruvate concentration normalised for FFM (P < 0.05) and plasma lactate (P < 0.05), especially when this substrate was normalised for FFM (P < 0.02). This metabolic profile was more accentuated in AD >5 years when compared to healthy subjects. Moreover, the two AD subgroups differed in terms of plasma lactate and pyruvate levels, which were significantly lower in subjects with a longer DT. In subjects with AD >5 years, lactate remained lower than in AD ⩽5 years after normalisation for FFM (P = 0.02). Pyruvate/FFM also tended to be lower in AD >5 years (P = 0.07). Body composition was similar in the two subgroups.
Demographic-, anthropometric- and clinical characteristics, routine biohumoral variables and nutritional status of the AD population after stratification according to diagnosis time and healthy elderly individuals, when relevant.
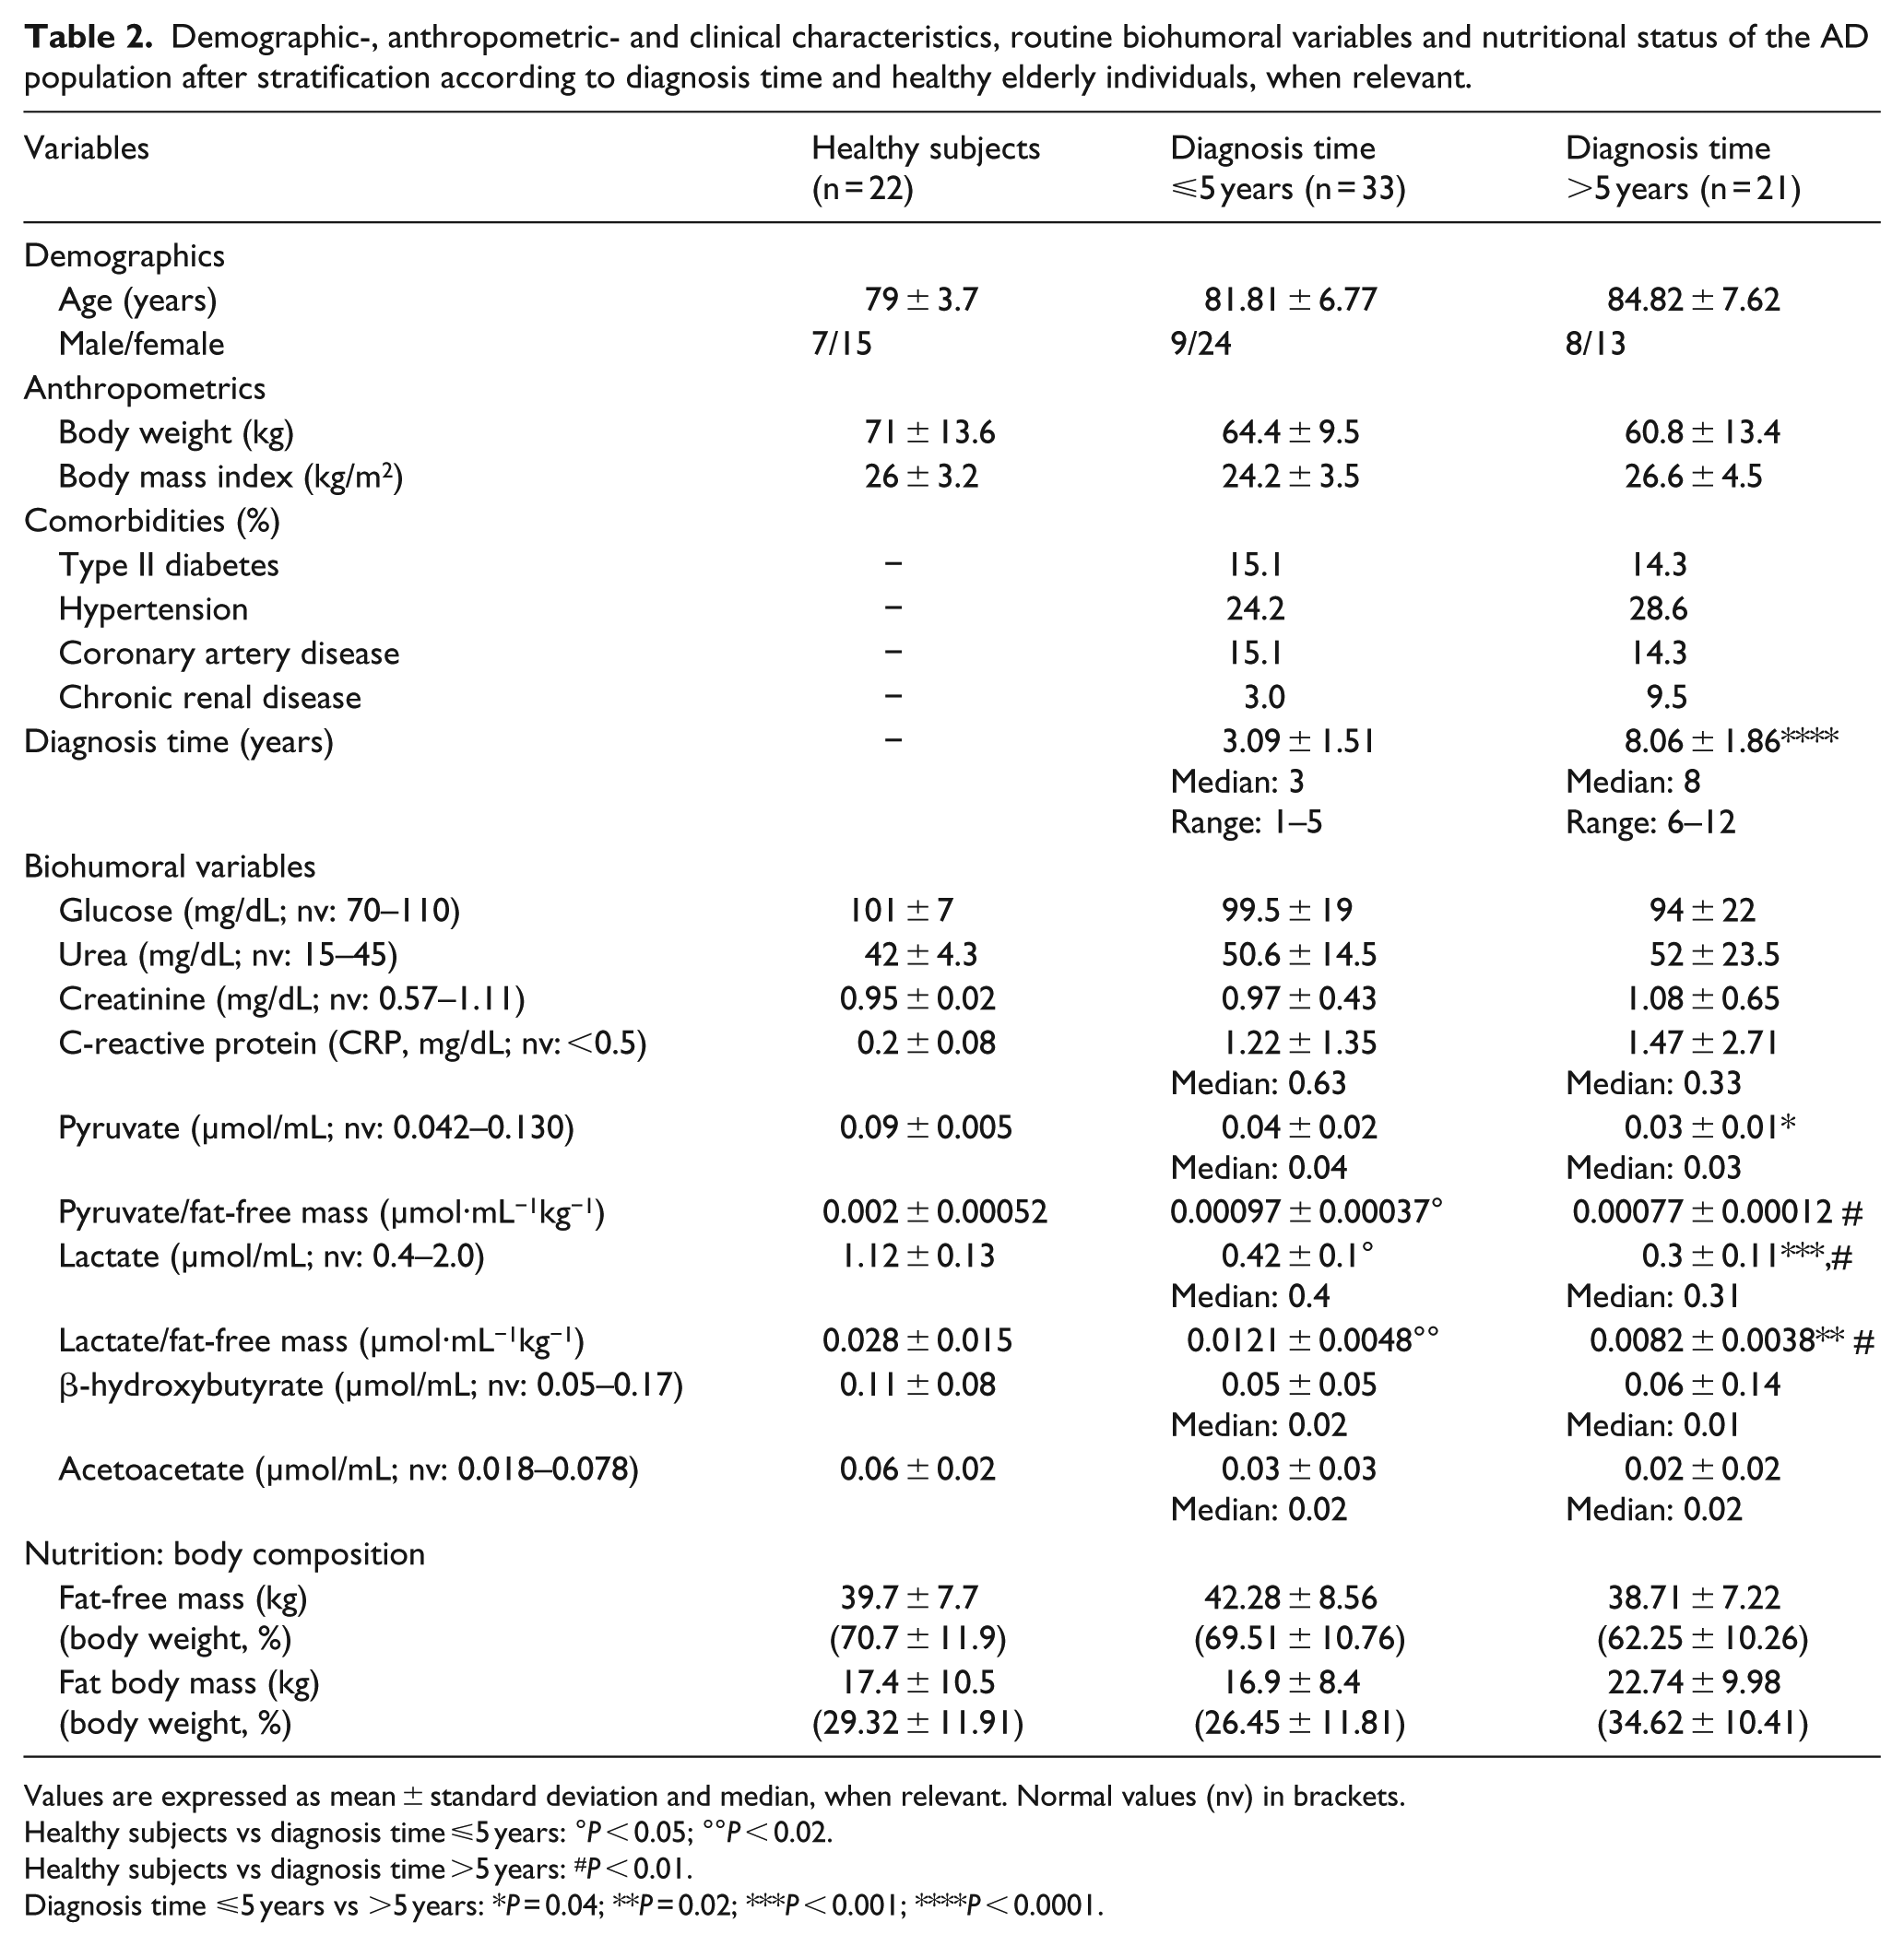
Values are expressed as mean ± standard deviation and median, when relevant. Normal values (nv) in brackets.
Healthy subjects vs diagnosis time ⩽5 years: °P < 0.05; °°P < 0.02.
Healthy subjects vs diagnosis time >5 years: #P < 0.01.
Diagnosis time ⩽5 years vs >5 years: *P = 0.04; **P = 0.02; ***P < 0.001; ****P < 0.0001.
The two subgroups were similar in terms of daily nutrition intakes (energy: 24.7 ± 4.2 kcal/kg/day in AD ⩽5 years vs 26.2 ± 4.6 in counterpart, P = 0.06; protein: 1.43 ± 0.2 g/kg/day vs 1.59 ± 0.29, P = 0.3; carbohydrates: 2.61 ± 0.5 g/kg/day vs 3.07 ± 0.47, P = 0.07; lipids: 0.8 ± 0.2 g/kg/day vs 0.94 ± 0.3, P = 0.06), muscle strength (17.67 ± 7.31 kg in AD ⩽5 years vs 12.75 ± 1.89 in AD >5 years, P = 0.4), functional state (Barthel Index: 48.3 ± 27.1 scores in AD ⩽5 years vs 48.57 ± 28.72, P = 0.98) and physical autonomy of daily living (ADL: 2.43 ± 1.95 scores in AD ⩽5 years vs 2.75 ± 2.05, P = 0.6). Compared to healthy subjects, both AD subgroups showed significant reductions in muscle strength and obviously in functional state.
The negative correlation between plasma lactate and DT (r = −0.42, P = 0.002) confirmed that plasma lactate levels vary according to diagnosis time (Figure 1). No correlations were observed between pyruvate and β-HB, or between pyruvate and DT. AcAc tended to be negatively associated with DT (r = −0.25, P = 0.075).

The plot shows the negative relationship between plasma lactate levels and diagnosis time.
No significant correlations were observed between the plasma energetic substrate levels and the other measured variables.
Discussion
This study shows that AD patients, especially AD >5 years, when compared to healthy subjects, had reduced circulating plasma lactate and pyruvate levels. Plasma KB levels are normal in both AD subgroups. In the two AD subgroups, time was the only factor associated with more accentuated impairment in circulating lactate and pyruvate. To the best of our knowledge, this is the first time that, in humans, plasma concentrations of lactate and pyruvate have been found to be lower in patients with AD. This finding is in line with a previous experimental study. 10 Alterations in muscle glycolysis 6 were the likely cause of low lactate. In AD >5 years, alterations in lactate and pyruvate, especially after normalisation for FFM, suggest a progressive deterioration of the glycolytic pathway. The low plasma pyruvate level in subjects with a longer DT unequivocally means progressive reduction in aerobic energy formation.
The results of the study do not confirm our initial hypothesis that KBs may be increased following alterations of body energy formation. We cannot exclude the possibility that skeletal muscle may partly contribute to normal plasma levels of KBs, 11 whose main site of formation is the liver.
The shortage of plasma energy substrates is unlikely to be due to defects in insulin activity, the fasting state, systemic inflammation, diet or body composition. First, 80% of the AD population showed no alterations in peripheral tissue insulin sensitivity. Second, in overnight fasting, subjects’ myocyte utilisation of pyruvate was reduced. Third, systemic inflammation, which was higher in AD patients with a longer DT, reduced pyruvate utilisation. 12 Fourth, nutrient intakes by inter-group AD subjects provided sufficient amounts of calories and macronutrients. Finally, body lean mass was normal in the overall AD population and similar between the two subgroups. The coexistence of normal lean mass and reduced muscle strength in AD subjects suggests that the main defect in muscle strength development may not be muscle bulk, but possible alterations in intrinsic muscle activities. We believe that the results of this study show that AD patients are at risk of losing physical autonomy in their ADL.
In conclusion, the study shows that AD community-dwelling individuals, particularly those with longer DT, may have low plasma levels in lactate and pyruvate energy substrates.
Limitations of the study and future studies
The study has several limitations. Subjects with very recent AD (e.g. <6 months) and mild cognitive impairment (MCI) were not investigated.
Studies addressing longitudinal changes of energy substrates both in AD patients (especially referring to muscle Aβ peptide concentrations) and in a larger cohort of healthy subjects will provide a better evaluation of muscle energy metabolism development over time.
Footnotes
Acknowledgements
M.V. and R.A. equally contributed to this work.
Declaration of conflicting interests
The author(s) declared no potential conflicts of interest with respect to the research, authorship and/or publication of this article.
Funding
The author(s) received no financial support for the research, authorship and/or publication of this article.