
Abstract
Currently, the role of cytokines in the tumor progression, including breast cancer, is universally recognized. At the same time, there are still many questions concerning the role of individual cytokines and receptors for cytokines in various morphogenetic processes underlying the tumor progression. The objective of this work was to study cytokine production and vascular endothelial growth factor (VEGF)-R2 and VEGF-R1 expression by mammary adenocarcinoma (MAC) and the correlations with histopathological parameters of malignant tumors. The object of the study was cultured tumor biopsy samples from 47 women aged 43–75 years with invasive ductal carcinoma, which was classified as grade II–III adenocarcinoma. It was shown that the cytokine profiles of the supernatants of MAC samples from patients differ greatly. A correlation between the levels of VEGF-R2 and tumor necrosis factor (TNF)-R1 expression was observed. Correlations were also revealed during analysis of the relations of histopathological MAC indicators with KVEGF-R2/VEGF-A and KTNF-R1/TNF-α coefficients, which are equal, respectively, to the ratio of expression values of receptors VEGF-R2 and TNF-R1 to the concentrations of the relevant cytokines (VEGF-A and TNF-α) in the culture supernatants of the same MAC samples. A direct correlation was identified between KVEGF-R/VEGF-A and some histopathological MAC characteristics: proportion of cells undergoing mitosis or pathological mitosis in MAC and poorly differentiated cells. KVEGF-R2/VEGF-A directly correlated with the concentration in supernatant interleukin (IL)-18 and interferon (IFN)-γ. KTNF-R1/TNF-α was inversely correlated with the concentration in supernatant of IL-1Ra, IL-8, and granulocyte-macrophage colony-stimulating factor (GM-CSF). The data obtained show that the high-level production of IL-18 and IL-1β by MAC, overexpression of VEGF-R2 in tumor (at relatively low VEGF-A production), and the high level of IFN-γ production are attributed factors contributing to the formation of a population of low-grade cells in the tumor. The factors regulating the population of moderately differentiated cells in the tumor are referred to as IL-1Ra, IL-8, and GM-CSF.
Introduction
Currently, the role of cytokines in the tumor progression, including breast cancer, is universally recognized.1,2 At the same time, there are still many questions concerning the role of individual cytokines and receptors for cytokines in various morphogenetic processes underlying the tumor progression.
As is known, cytokines affect cells while interacting with the appropriate receptors.3–5 For instance, it has been shown that in a tumor, overexpression of such receptors as vascular endothelial growth factor receptor 1 (VEGF-R1) and VEGF-R2 may indicate advanced tumor progression in the case of breast cancer because of the important role they play in the process of tumor angiogenesis.5,6 In addition, the production level of the most important member of the VEGF family, VEGF-A, can vary in a tumor and the organs of the immune system of a patient depending on the stage of tumor development. This situation inevitably means ambiguity of the role of receptors for VEGF-A in tumor progression in different patients. There is even less clarity in the understanding of the function of the tumor necrosis factor (TNF) receptor family in this process (TNF-R1 and others) because these receptors may be expressed on both breast tumor cells and cells of a tumor microenvironment (lymphocytes, macrophages, dendritic cells, and granulocytes).7,8 The ambiguous effect of many cytokines on tumor growth in patients may be due to different ratios of cells expressing receptors for mediators that regulate tumor growth within a tumor and different levels of production of the cytokines that are complementary to them. Thus, the research on the relations among cytokine production levels in a tumor, expression of the relevant receptors on tumor cells (and on cells of the tumor microenvironment), and the histopathological parameters of a tumor in each patient, including the features of the formation of a population of low-differentiated forms of tumor cells, characterized by a high degree of malignancy, is essential for predicting the effectiveness of treatment and for evaluation of the risk of recurrence and metastasis.
The objective of this work was to study VEGF-R2 and TNF-R1 expression and cytokine production by mammary adenocarcinomas and their correlations with histopathological parameters of these malignant tumors.
Materials and methods
Patients
The object of the study was cultured tumor biopsy samples from 47 women aged 43–77 years with invasive ductal breast cancer, treated at the Novosibirsk regional oncological center, which was classified according to histological type as mammary adenocarcinomas (MACs) grade II–III. The study and all study protocols were approved by the Ethics Committee of the Institute of Molecular Biology and Biophysics (Novosibirsk). All the studies were conducted in accordance with the Helsinki Declaration (Brazil, Fortaleza, 2013), and all recommendations of the International Committee of Medical Journal Editors (ICMJE) were taken into account. At the time of registration, each patient is assigned an individual identification number, which was then placed on the results of his analyzes, as well as other documents relating to the data of this study. Each patient was informed about the study conducted and its objectives and methods. Written informed consent for participation in the study and for the tumor biopsy procedure was signed by each patient and verified by a physician.
Method of measurement of cytokine production
Each 8-mm3 tumor biopsy sample obtained by trepanobiopsy was placed in a glass vial containing 1 ml of Dulbecco’s modified Eagle medium (DMEM)-F12 and then incubated for 72 h. Before collection of the supernatant, the tumor biopsy sample was taken out of the vial and placed in a solution of 10% neutral formalin. The remaining cellular detritus were pelleted by centrifugation at 900 g for 15 min. Using enzyme-linked immunosorbent assays, the concentrations of IL-2, IL-6, IL-8, IL-10, IL-17, IL-18, IL-1β, IL-1Ra, TNF-α, interferon (IFN)-γ, granulocyte colony-stimulating factor (G-CSF), granulocyte-macrophage colony-stimulating factor (GM-CSF), and VEGF-A in the culture supernatants were determined. Enzyme-linked immunosorbent assay was performed using enzyme immunoassay analyzer Multiskan spectrum (Thermo Electron Corporation, Finland) with the kits manufactured by Vector-Best Inc. (Russia).
Immunohistochemical analysis
Expression of receptors VEGF-R2 and TNF-R1 in the MAC biopsy samples was determined by immunohistochemical analysis. The MAC biopsy samples, fixed in neutral formalin, were dehydrated and embedded in paraffin. Dewaxing and rehydration of the samples were performed according to the standard procedure by means of a xylene and graded series of ethanol solutions. Antigen retrieval was performed at: pH = 6 at 95°C for 20 min using the citrate-based antigen retrievel solution (pH = 6.0) in the BioSan WB-4MS water bath (Latvia). To block endogenous peroxidase, the slices were incubated in a 1% aqueous solution of Н2О2 for 5 min. To reduce non-specific staining, the slices were treated with normal blocking non-immune serum (from VECTASTAIN Elite ABC Kit, Cat. No. PK-7200, Vector Laboratories, USA) for 10 min. Then the slices were incubated for 1 h with primary antibodies specific for VEGF-R2 (rabbit polyclonal, Cat. no. PAB367Hu01, Cloud-Clone Corp, USA) and TNF-R1 (TNFRSF1A; rabbit polyclonal, Cat. no. PAB499Hu01, Cloud-Clone Corp.) at final concentration of 5.0 µg/ml in an antibody dilution solution (Cat. no. 559148; Becton Dickinson, USA). After a wash, they were incubated for 30 min with secondary biotinylated antibodies (VECTASTAIN Elite ABC Kit, Vector Laboratories). Then, the tissue slices were incubated with the avidin peroxidase complex (VECTASTAIN Elite ABC Kit, Vector Laboratories) for 30 min and with a chromogenic substrate containing diaminobenzidine (ImmPACT DAB, Vector Laboratories, Cat. no. SK-4105) for 5 min. The slices were stained with hematoxylin and eosin, then washed with water, and embedded in balsam after dehydration.
Computer morphometric analysis
Histological samples stained for VEGF-R2 and TNF-R1 were photographed (at magnification ×400) using an image analysis system based on a Micros MC 300A microscope (Austria) and a digital CMOS camera based on the Aptina MT9J003 sensor-format 1/2.4-inch (China). Computer morphometric quantitative evaluation of expression of receptors VEGF-R2 and TNF-R1 was performed in the ImageJ 1.50a software (National Institute of Health, USA). Digital images of histological sections stained on VEGF-R2 and TNF-R1 was decomposed into three color image layers using “Colour Deconvolution” option in the “H & E DAB” mode. On a digital section with a brown color corresponding to the DAB color, the colored DAB structures were extracted using the “Threshold” option in the “MaxEntropy” mode, which were marked binary. The resulting binary image of the memory was measured in automatic mode. With this measurement, the percentage of the total DAB color (corresponding to the VEGF-R2 or TNF-R1 color) was found relative to the area of the entire digital image taken as 100% (3488 × 2616 pixels). Immunohistochemical indicators of VEGF-R2 and TNF-R1 expression were as squares of colored zones which were specific for VEGF-R2 or TNF-R1 expression (%, percentage of colored area from a total area of tested image) in each digital image of the tested section. KVEGF-R2/VEGF-A and KTNF-R1/TNF-α coefficients were then determined, representing the ratio of the expression value of receptors VEGF-R2 or TNF-R1 to the concentration of the relevant cytokines (VEGF-A or TNF-α). The coefficients are expressed in arbitrary units. Statistical analysis of expression of the receptors under study was performed based on the average expression index calculated during examination of eight digital photographs of each MAC sample.
Histopathological analysis
Histopathological analysis of the tumors was performed by a pathologist using histological sections of MAC samples stained with hematoxylin and eosin according to the standard procedure. The average numbers of mitotic cells and cells undergoing pathological mitosis were calculated after analyzing 10 fields of view; also analyzed the shares (estimated percentage) of poorly differentiated, moderately differentiated, and well-differentiated tumor cells.
Statistical analysis
Histograms were created in the Microsoft Excel. Cluster analysis, determination of Spearman’s rank correlation coefficient (r), assessment of differences between groups by Mann–Whitney U-test, and identification of canonical correlations (R) including their reliability (p) were performed by means of software package Statistica 7.
Results
Correlation between VEGF-R2 and TNF-R1 expression, KVEGF-R2/VEGF-A or KTNF-R1/TNF-α coefficients and histopathological indicators
When we studied the receptor expression in MAC samples, a direct correlation between immunohistochemical indicators of VEGF-R2 and TNF-R1 expression was revealed (r = 0.57, p < 0.01). In contrast, no significant correlation was found when we analyzed the relation of expression of these receptors with histopathological MAC indicators.
However, correlations was found only between the KVEGF-R2/VEGF-A or KTNF-R1/TNF-α coefficients and histopathological indicators. KVEGF-R2/VEGF-A directly correlated with histopathological MAC parameters that characterize tumor grade: the numbers of mitotic cells ( r = 0.47, p = 0.0426), cells undergoing pathological mitosis (r = 0.51, p = 0.0246), and the proportion of poorly differentiated cells (r = 0.54, p = 0.0174). KTNF-R1/TNF-α directly correlated only with the number of moderately differentiated tumor cells in MAC ( r = 0.39, p = 0.0499).
Correlation between VEGF-R2 and TNF-R1 expression, KVEGF-R2/VEGF-A or KTNF-R1/TNF-α coefficients and with cytokine concentrations in the MAC culture supernatants
When we studied the relation of the expression of receptor VEGF-R2 with cytokine concentrations in the tumor culture supernatant, only two correlations were identified: between VEGF-R2 and IL-18 as well as between VEGF-R2 and IFN-γ (Table 1). KVEGF-R2/VEGF-A also directly correlated with the concentration of these cytokines in the supernatant. When we analyzed the relations between the expression of receptor TNF-R1 in MAC and cytokine concentrations in the tumor supernatant, no correlations were identified (Table 1).
Coefficients of correlation (r) of the indicators of VEGF-R2 and TNF-R1 expression and of coefficients KVEGF-R2/VEGF-A and KTNF-R1/TNF-α with cytokine concentrations in the MAC culture supernatants (Spearman’s rank correlation).

VEGF: vascular endothelial growth factor; TNF: tumor necrosis factor; G-CSF: granulocyte colony-stimulating factor; GM-CSF: granulocyte-macrophage colony-stimulating factor; IFN: interferon; IL: interleukin; AU: arbitrary unit.
Nonetheless, in the analysis of the associations of the KTNF-R1/TNF-α coefficient, three negative correlations were identified: with IL-8, IL-1Ra, and GM-CSF.
Peculiarities of distribution of VEGF-R2 and TNF-R1 expression in the samples of MAC
Histopathological and immunohistochemical analyses suggested that in the tissue samples tested, VEGF-R2 was predominantly expressed in endothelial cells of mature and emerging blood vessels, as well as cells of duct epithelium (Figure 1(a) and (b)). VEGF-R2 was also expressed by some tumor cells and by cells in the tumor microenvironment: macrophages and fibroblast-like cells (myofibroblast and/or fibroblasts). Indicators of VEGF-R2 expression (colored areas, %) varied in different patients within the range: from 0.26 (weak expression) to 6.1 (overexpression). TNF-R1 was predominantly expressed by tumor cells (Figure 1(c) and (d)). Indicators of TNF-R1 expression varied in different patients within the range of 0.27–5.6 (colored areas, %). The results of the immunohistochemical analysis indicated that most of the tumor cells expressed TNF-R1 in nucleus. An inverse correlation was identified between the number of tumor cells expressing TNF-R1 and the number of poorly differentiated cells in MAC (r = 0.53; p < 0.01).

Mammary gland adenocarcinoma (MAC). Images were captured at ×400 magnification. Immunohistochemical staining for VEGF-R2 and TNF-R1 (brown color). In addition, staining with hematoxylin & eosin: (a) sample of MAC grade II with moderate VEGF-R2 expression, (b) sample of MAC grade III with VEGF-R2 overexpression, (c) sample of MAC grade III with moderate TNF-R1 expression, and (d) distribution histogram of the proportion of cells expressing TNF-R1 when evaluating only those cells that have expressed TNF-R1.
Canonical correlation between coefficients KVEGF-R2/VEGF-A and KTNF-R1/TNF-α and histopathological MAC parameters
Using canonical correlation analysis, the relations between two groups of variables were evaluated: (1) KTNF-R1/TNF-α and the percentage of tumor cells expressing TNF-R1 (%) and (2) the number of tumor cells undergoing mitosis, pathological mitosis, and the percentage of poorly differentiated cells. A marked canonical correlation was revealed between these two groups of indicators: R = 0.73 (p < 0.01). When we added KVEGF-R2/VEGF-A to the first group of variables (to KTNF-R1/TNF-α and percentage of tumor cells expressing TNF-R1), the canonical correlation with histopathological parameters, characterized tumor grade, increased: the canonical correlation coefficient reached 0.85 (p < 0.01).
Cytokine profiles of the supernatants of MAC samples and its relation to the number of tumor cells of different degrees of differentiation
Using cluster analysis was constructed hierarchical dendrogram of the distribution of patients depending on the ratio of poorly differentiated, moderately differentiated, and well-differentiated tumor cells in the supernatant samples MAC (Figure 2(a) and (b)). Depending on the ratio of tumor cells with different differentiation in tumors, all patients were fairly clearly divided into two clusters forming two groups, respectively, with a high (Group I: prevails poorly differentiated tumor cells) and low (Group II: prevails well-differentiated tumor cells) content of poorly differentiated tumor cells in MAC samples.

The results of formation of groups of patients with similar distribution characteristics in tumor samples on ratio tumor cells with different degrees of differentiation: (a) hierarchical dendrogram of the distribution of 47 patients with mammary gland adenocarcinomas (MAC) depending on the ratio of poorly differentiated, moderately differentiated, and well-differentiated tumor cells in the samples MAC formed by the method of cluster analysis and (b) histograms of the distribution of tumor cells with different degrees of differentiation in the groups of patients.
A comparative analysis of the differences between the two groups of patients by the production of cytokines by MAC specimens was conducted, one of which was dominated by low-grade tumor cells in MAC samples and the other by highly differentiated tumor cells. Significant differences between groups were found only in the production of IL-1β and IL-18 (Figure 3).
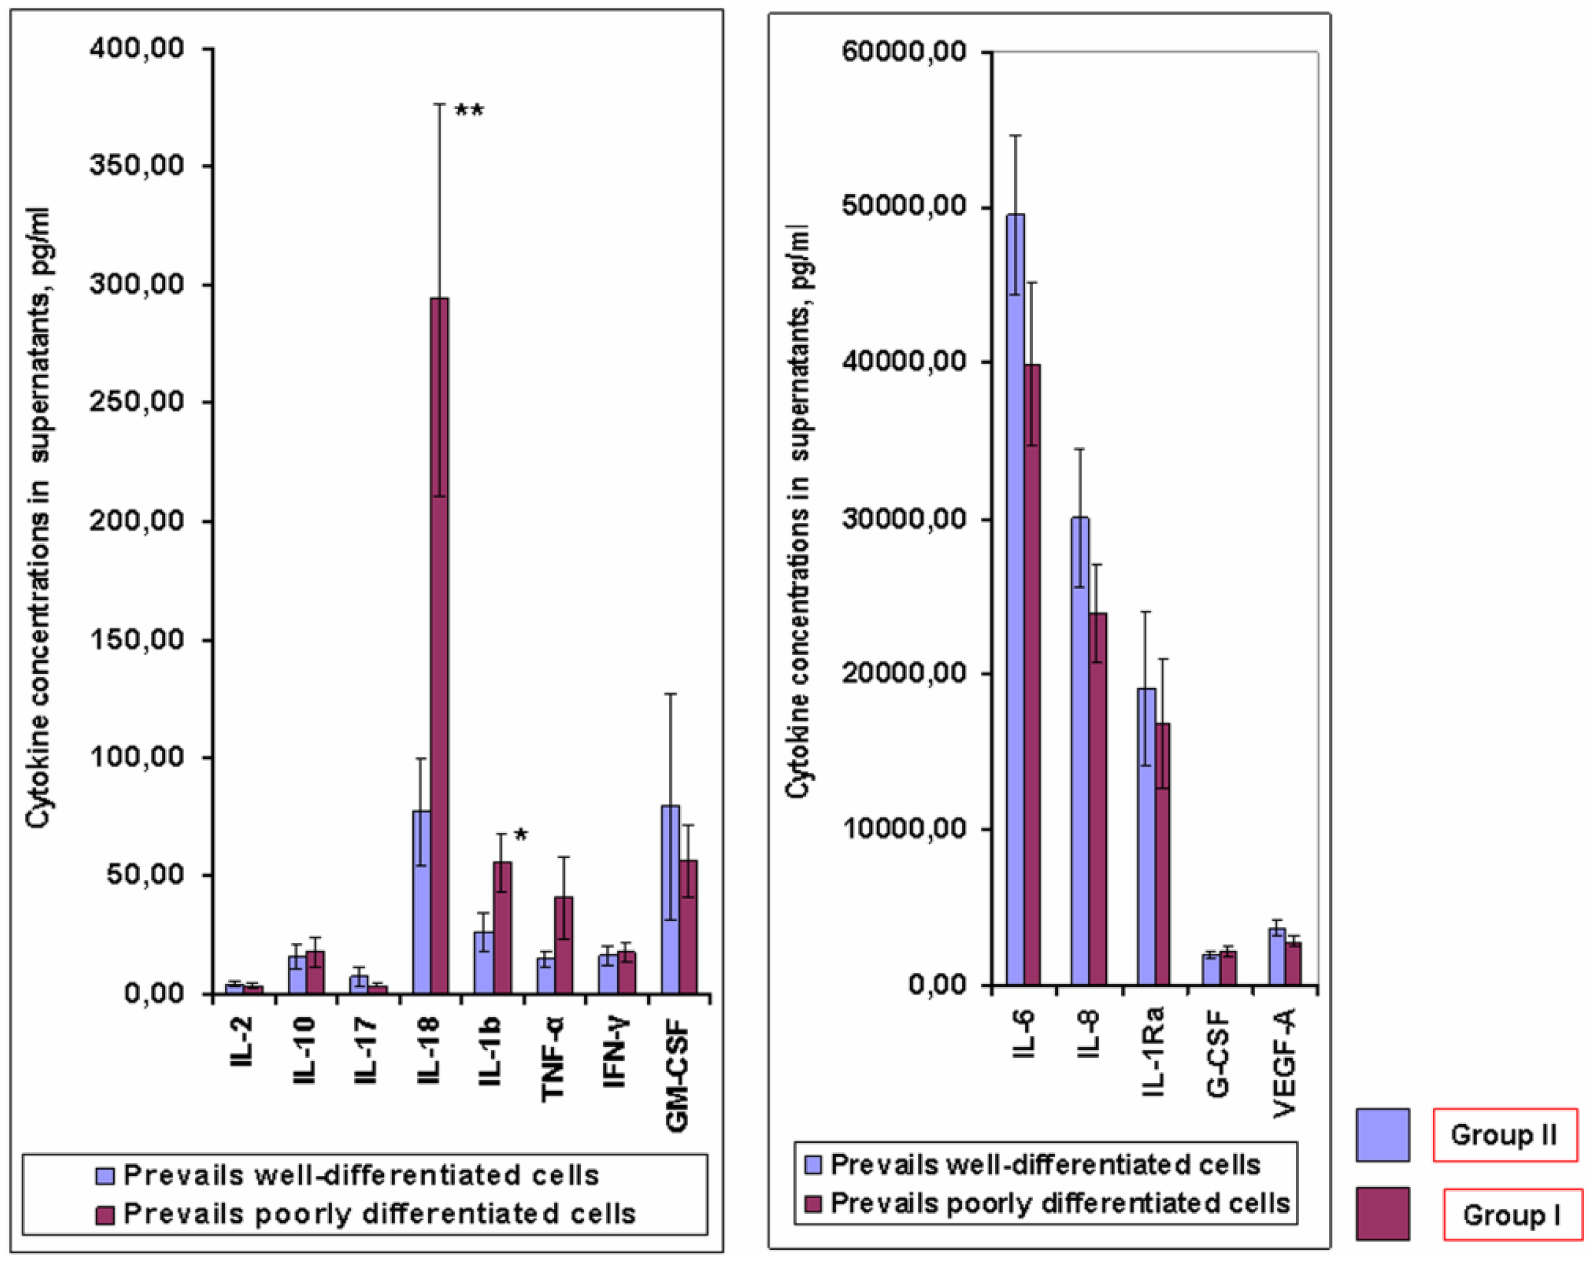
The results of analysis of the differences between two groups of patients on the production of cytokines by MAC specimens in which prevails poorly differentiated or well-differentiated tumor cells. Each 8-mm3 tumor biopsy MAC sample obtained by trepanobiopsy was placed in a glass vial containing 1 ml of DMEM-F12 nutrient medium and then incubated for 72 h. Using enzyme-linked immunosorbent assays, the concentrations (pg/ml) in the culture supernatants were determined. Bars correspond to mean ± SE. *p < 0.05, **p < 0.01 (Mann–Whitney U-test).
Discussion
A number of studies have shown that different human cancer cell lines express different amounts of TNF-R1.9,10 Therefore, the induction of apoptosis can depend to a large extent on the concentration of death receptors on the tumor cell membrane.2,10 It was determined that TNF-R1 internalization into the nucleus may be is an indicator of irreversibility of the apoptotic process in a cancer cell.9,10
The data we obtained on the relation between KTNF-R1/TNF-α and the number of MAC tumor cells expressing TNF-R1 predominantly in the nucleus on one hand, and the number of poorly differentiated cells and cells with pathological mitosis on the other hand, indicate that the TNF-R1 overexpression in tumor cells and the process of TNF-R1 internalization into the nucleus are important during formation of the most malignant subpopulation of poorly differentiated cells.
As is known, the key growth regulators of vasculature in a tumor are VEGF-A and its receptors VEGF-R1 (Flt-1) and VEGF-R2 (KDR).4,6,11 It is important to note, however, that VEGF-R2 expression has been demonstrated in both neoplastic endothelial cells and directly in tumor cells. 12 The main recipient of the biological effect of VEGF-A is VEGF-R2.
Analyzing the tumor slices from the patients with a high KVEGF-R2 /VEGF-A value, we detected not only a number of cells in the tumor microenvironment (endotheliocytes, duct epithelial cells, and macrophages) expressing VEGF-R2 but also some tumor cells with VEGF-R2. These data indicate that the activation of a VEGF-R2–dependent autocrine mechanism that stimulates proliferation of tumor cells should be regarded as one of the factors responsible for accumulation of poorly differentiated tumor cells.
The direct correlations between VEGF-R and IL-18, between VEGF-R and IFN-γ, and the inverse correlations of IL-8, GM-CSF, and IL-1Ra with the KTNF-R1/TNF-α coefficient indirectly point to the role played by the cells of the tumor microenvironment in the regulation of VEGF-R2/VEGF-A– and TNF-R1/TNF-α–dependent mechanisms of tumor progression. We have been shown that in the group with a predominance of low-differentiated tumor cells, MAC samples produced more IL-18 and I L-1β than in the group with a predominance in the tumor of highly differentiated tumor cells. Thus, the data obtained show that the high-level production of IL-18 and L-1β by tumor, overexpression in VEGF-R2 tumor (at relatively low VEGF-A production), and the relatively high level of IFN-γ production are attributed factors contributing to the formation of a population of low-grade cells in the tumor. The factors regulating the population of moderately differentiated cells in the tumor are referred to as IL-1Ra, IL-8, and GM-CSF.
It can be assumed, that if you change the state of TNF-R1/TNF-α; VEGF-R2/VEGF-A; and the production of IL-18, IFN-γ, IL-1Ra, IL-8, and GM-CSF in a tumor, for example, by cytokine-directed therapy, you can slow down the formation process of poorly differentiated forms of tumor cells and, probably, stimulate the process of their reverse differentiation. To check this assumption, it is necessary to conduct additional researches.
Footnotes
Declaration of conflicting interests
The author(s) declared no potential conflicts of interest with respect to the research, authorship, and/or publication of this article.
Funding
The author(s) received no financial support for the research, authorship, and/or publication of this article.