
Abstract
Background
As CT pulmonary angiography (CTPA) is not performed in routine contrast-enhanced CT, it is important to improve the accuracy of embolism detection from the portal-venous phase images that are generally obtained.
Purpose
To assess the diagnostic performance of virtual monochromatic images (VMIs) obtained from portal phase dual-energy CT (PP-DECT) by qualitative and quantitative evaluation of contrast-to-noise ratio (CNR) and signal-to-noise ratio (SNR) compared with those of CTPA.
Material and Methods
Included were 45 oncology patients who had been diagnosed with pulmonary embolism based on CTPA. Two radiologists evaluated conventional PP-DECT images and VMIs created from PP-DECT at 40, 55, 70, and 85 keV with the window width and level fixed at 400/70. The energy with the highest diagnostic accuracy was determined, and the image was re-evaluated under conditions where the window could be freely set. Quantitative evaluation was based on CNR and SNR.
Results
Under the condition of fixed window width and level, the energy with the highest accuracy was 55 keV for both radiologists. When the window was set freely in the 55 keV image, accuracy rates were 96.0% and 96.3%; and were 98.5% and 98.1% when limited to the main pulmonary artery or lobar level. CNR and SNR were highest at 40 keV, and were similar to those of CTPA.
Conclusion
Compared to original PP-DECT images, 55 keV images created from PP-DECT appear more useful for detecting pulmonary embolism.
Keywords
Introduction
As pulmonary embolism (PE) is asymptomatic or has non-specific symptoms and is often fatal, it is important to rule out potentially treatable emboli whenever possible. Computed tomography pulmonary angiography (CTPA) is commonly used for diagnosis of PE.1–5 In diagnosing PE using CTPA, the optimal scan timing for detecting emboli in the blood vessels is when the contrast agent concentration in the pulmonary artery is very high, about 20 seconds after the start of contrast agent injection. When evaluating organs, malignant tumors, and lymph nodes, portal-venous phase images using dual-energy CT (PP-DECT) taken 60–70 seconds after the start of contrast agent injection are frequently used, which are not sufficient to detect PE. If PP-DECT can appropriately evaluate high-risk PEs, the number of scans can be reduced, and radiation exposure can also be reduced. Previous studies have suggested that virtual monochromatic images (VMIs) can be generated from PP-DECT, which may improve contrast, including contrast of emboli.2,6,7 Although a few previous studies have examined the rate of embolus detection using VMIs generated from PP-DECT, 2 CTPA and PP-DECT have rarely been performed in a single examination, and to the best of our knowledge no study has compared detection rates between 120 kVp portal-venous phase images and VMIs. The comparison of 120 kVp portal-venous phase images and VMIs will clarify the extent to which diagnostic accuracy can be improved, thereby providing an incentive to generate and evaluate additional images.
The purpose of this study is to investigate the detection rate of PEs using conventional portal-venous phase alone and to evaluate the usefulness of VMIs by comparing the detection rate of conventional portal-venous phase images with that using VMIs generated from PP-DECT.
Materials and methods
Patient selection
This retrospective study was approved by our local institutional review board, which waived the requirement for written consent. Our facility is a cancer hospital, and many of the patients referred to us are cancer patients. We also perform CTPA scans to rule out pulmonary arterial embolism in patients who are new to the gynecology department or who are scheduled to undergo surgery in other departments and have a D-dimer level greater than 1.0. From the radiology information system, we identified 1173 consecutive adult patients who underwent DLCT for evaluation of PE between July 2021 and July 2023. A review of patients’ CT reports in the Picture Archiving and Communication System identified 49 adult oncology patients diagnosed with PE who had undergone CTPA and PP-DECT at the same examination. After applying the exclusion criteria, four patients were excluded due to the presence of large pleural effusions, leaving a final total of 45 patients. A detailed description of the sample size is provided in Figure 1. Table 1 lists the clinical characteristics of the study population. Flowchart of the study design and inclusion and exclusion criteria. Clinical characteristics. aData are expressed as the mean (SD). Abbreviations: BMI**: body mass index.

Image acquisition
A dual-layer detector CT system (IQon Spectral CT, Philips Health Care, Best, the Netherlands) was used for all examinations. All CT images were reconstructed with a standard kernel using an iterative reconstruction method (iDose 1, Philips Healthcare) to obtain conventional 120-kVp images. The scanning parameters were 120 kVp, 140–250 mA (reference mAs, 82), pitch 0.609, rotation time 0.27 s, collimation 64 × 0.625 mm, slice thickness 1 mm, slice increment 0.8 mm, and standard filter (filter B). All patients received the same breathing instructions.
For all patients, the dose of iodinated contrast medium (iohexol; Omnipaque 300, GE Healthcare, Tokyo, Japan; or iomeprol; Iomeron 350, Bracco Japan, Co., Ltd, Tokyo, Japan) was determined at 600 mgI/kg body weight, with an upper limit of 135 mL. Contrast medium was injected using a power injector (Dual Shot GX 7; NEMOTO, Tokyo, Japan) over 30 seconds via a peripheral vein at a rate of 2–4.5 mL/s, followed by an additional 30 mL of saline injected at the same rate. In CTPA, the bolus tracking method was used to determine the timing of the start of scanning. A circular region of interest (ROI) was set in the main trunk of the pulmonary artery, and the CT value threshold was set at 150 Hounsfield units (HU). CTPA was performed in the caudal-to-cephalic direction after contrast agent injection (mean time after injection, 20 s; range, 17–23 s). PP-DECT in the cephalic-to-caudal direction was started 40 seconds after the start of the CTPA scan.
Quantitative image analysis
One radiologist with 14 years of experience in chest imaging measured the absolute attenuation values (HU) of the main pulmonary artery trunk and latissimus dorsi muscle in the conventional 120-kVp images, all VMIs, and CTPA. Measurement of the latissimus dorsi muscle was performed in an area without beam hardening. The size of each ROI was adapted to the diameter of the structure being analyzed. Background noise (BN) was measured in room air 20 mm from the anterior chest wall at the midline. BN was defined as the standard deviation (SD) of air. All VMI measurements were obtained at exactly the same positions as in the conventional 120-kVp images, and the CTPA measurements were taken at the same positions as far as possible.6,7 All measurements were taken twice, and the average of the two measurements was recorded as the representative value. Contrast-to-noise ratio (CNR) and signal-to-noise ratio (SNR) calculations were performed as follows:

HUPA = average Hounsfield units of the pulmonary artery.
Qualitative image analysis
The presence or absence of PE was determined using a binary classification system based on the presence or absence of low-density defects in the pulmonary artery lumen in each region. The presence of PE was assessed as “present” if at least one embolus was present in the target region, regardless of the number of emboli, whether they were occlusive or non-occlusive, or their exact anatomical location. Presence of PE was evaluated for the following 14 segments: (1) right main pulmonary artery, (2) right upper lobar artery, (3) right middle lobar artery, (4) right lower lobar artery, (5) right upper segmental/subsegmental artery, (6) right middle segmental/subsegmental artery, (7) right lower segmental/subsegmental artery, (8) left main pulmonary artery, (9) left upper lobar artery, (10) left lingula lobar artery, (11) left lower lobar artery, (12) left upper segmental/subsegmental artery, (13) left lingula segmental/subsegmental artery, and (14) left lower segmental/subsegmental artery. For all 45 patients, the left and right main pulmonary arteries were assessed at 90 sites, the right and left lobar (lingula) arteries at 270 sites, and the segmental/subsegmental arteries at 270 sites.
In the first session, a radiologist with 14 years of experience in chest imaging assessed all patients’ CTPA images as the reference standard.
In the second session, two radiologists (Reader 1 with 6 years of experience in chest imaging and Reader 2 with 17 years of experience) independently assessed the conventional 120-kVp images and all VMIs with the same window width and level (400/70) for all 45 patients. When evaluating the same image at different energy levels, the interval between evaluations was at least 1 week. Using the results of the first session, sensitivity, specificity, and accuracy rate were calculated for the conventional 120-kVp images and the four energy types of VMIs.
In the final session, the two radiologists from the second session re-evaluated the VMI with the highest accuracy from the second session, under conditions in which the window settings could be freely changed.
Three readers knew only that the patient had oncological disease and that there was an embolism somewhere in the pulmonary artery.
Statistical analysis
Statistical analysis was performed using EZR (Saitama Medical Center, Jichi Medical University, Saitama, Japan), which is a graphical user interface for R (The R Foundation for Statistical Computing, Vienna, Austria).
We compared the attenuation, noise, CNR, and SNR of conventional 120-kVp images and all VMIs and CTPA images using the Wilcoxon signed-rank test. The statistical significance level was set at 5%.
The agreement rate between readers was calculated using Cohen’s Kappa coefficient.
Results
In assessment of all patients’ CTPA images, 2 PEs (2/90) were identified in the left and right main pulmonary arteries, 50 PEs (50/270) in lobar arteries, and 110 PEs (110/270) in segmental/subsegmental arteries.
Quantitative image analysis
Quantitative image analysis: comparison of VMI with conventional reconstructions from DLCT.

Data are expressed as the mean ± SD.
VMI = virtual monochromatic imaging; DLCT = dual-layer spectral detector CT; SNR = signal-to-noise ratio, CNR = contrast-to-noise ratio; CTPA = CT pulmonary angiography.
CNR was highest for images at 40 keV and decreased with increasing energy. CNR was significantly better at 40 keV and 55 keV than in the conventional 120-kVp images (p < .001). However, mean CNR was lower at 70 and 85 keV than in the conventional 120-kVp images (p < .001). The mean CNR at 40 keV was comparable to that of CTPA (p = .217) (Figure 2). Graph of the mean contrast-to-noise ratio (CNR) of the pulmonary artery at each energy level in 45 patients with pulmonary embolism. Whiskers = ± 1 SD.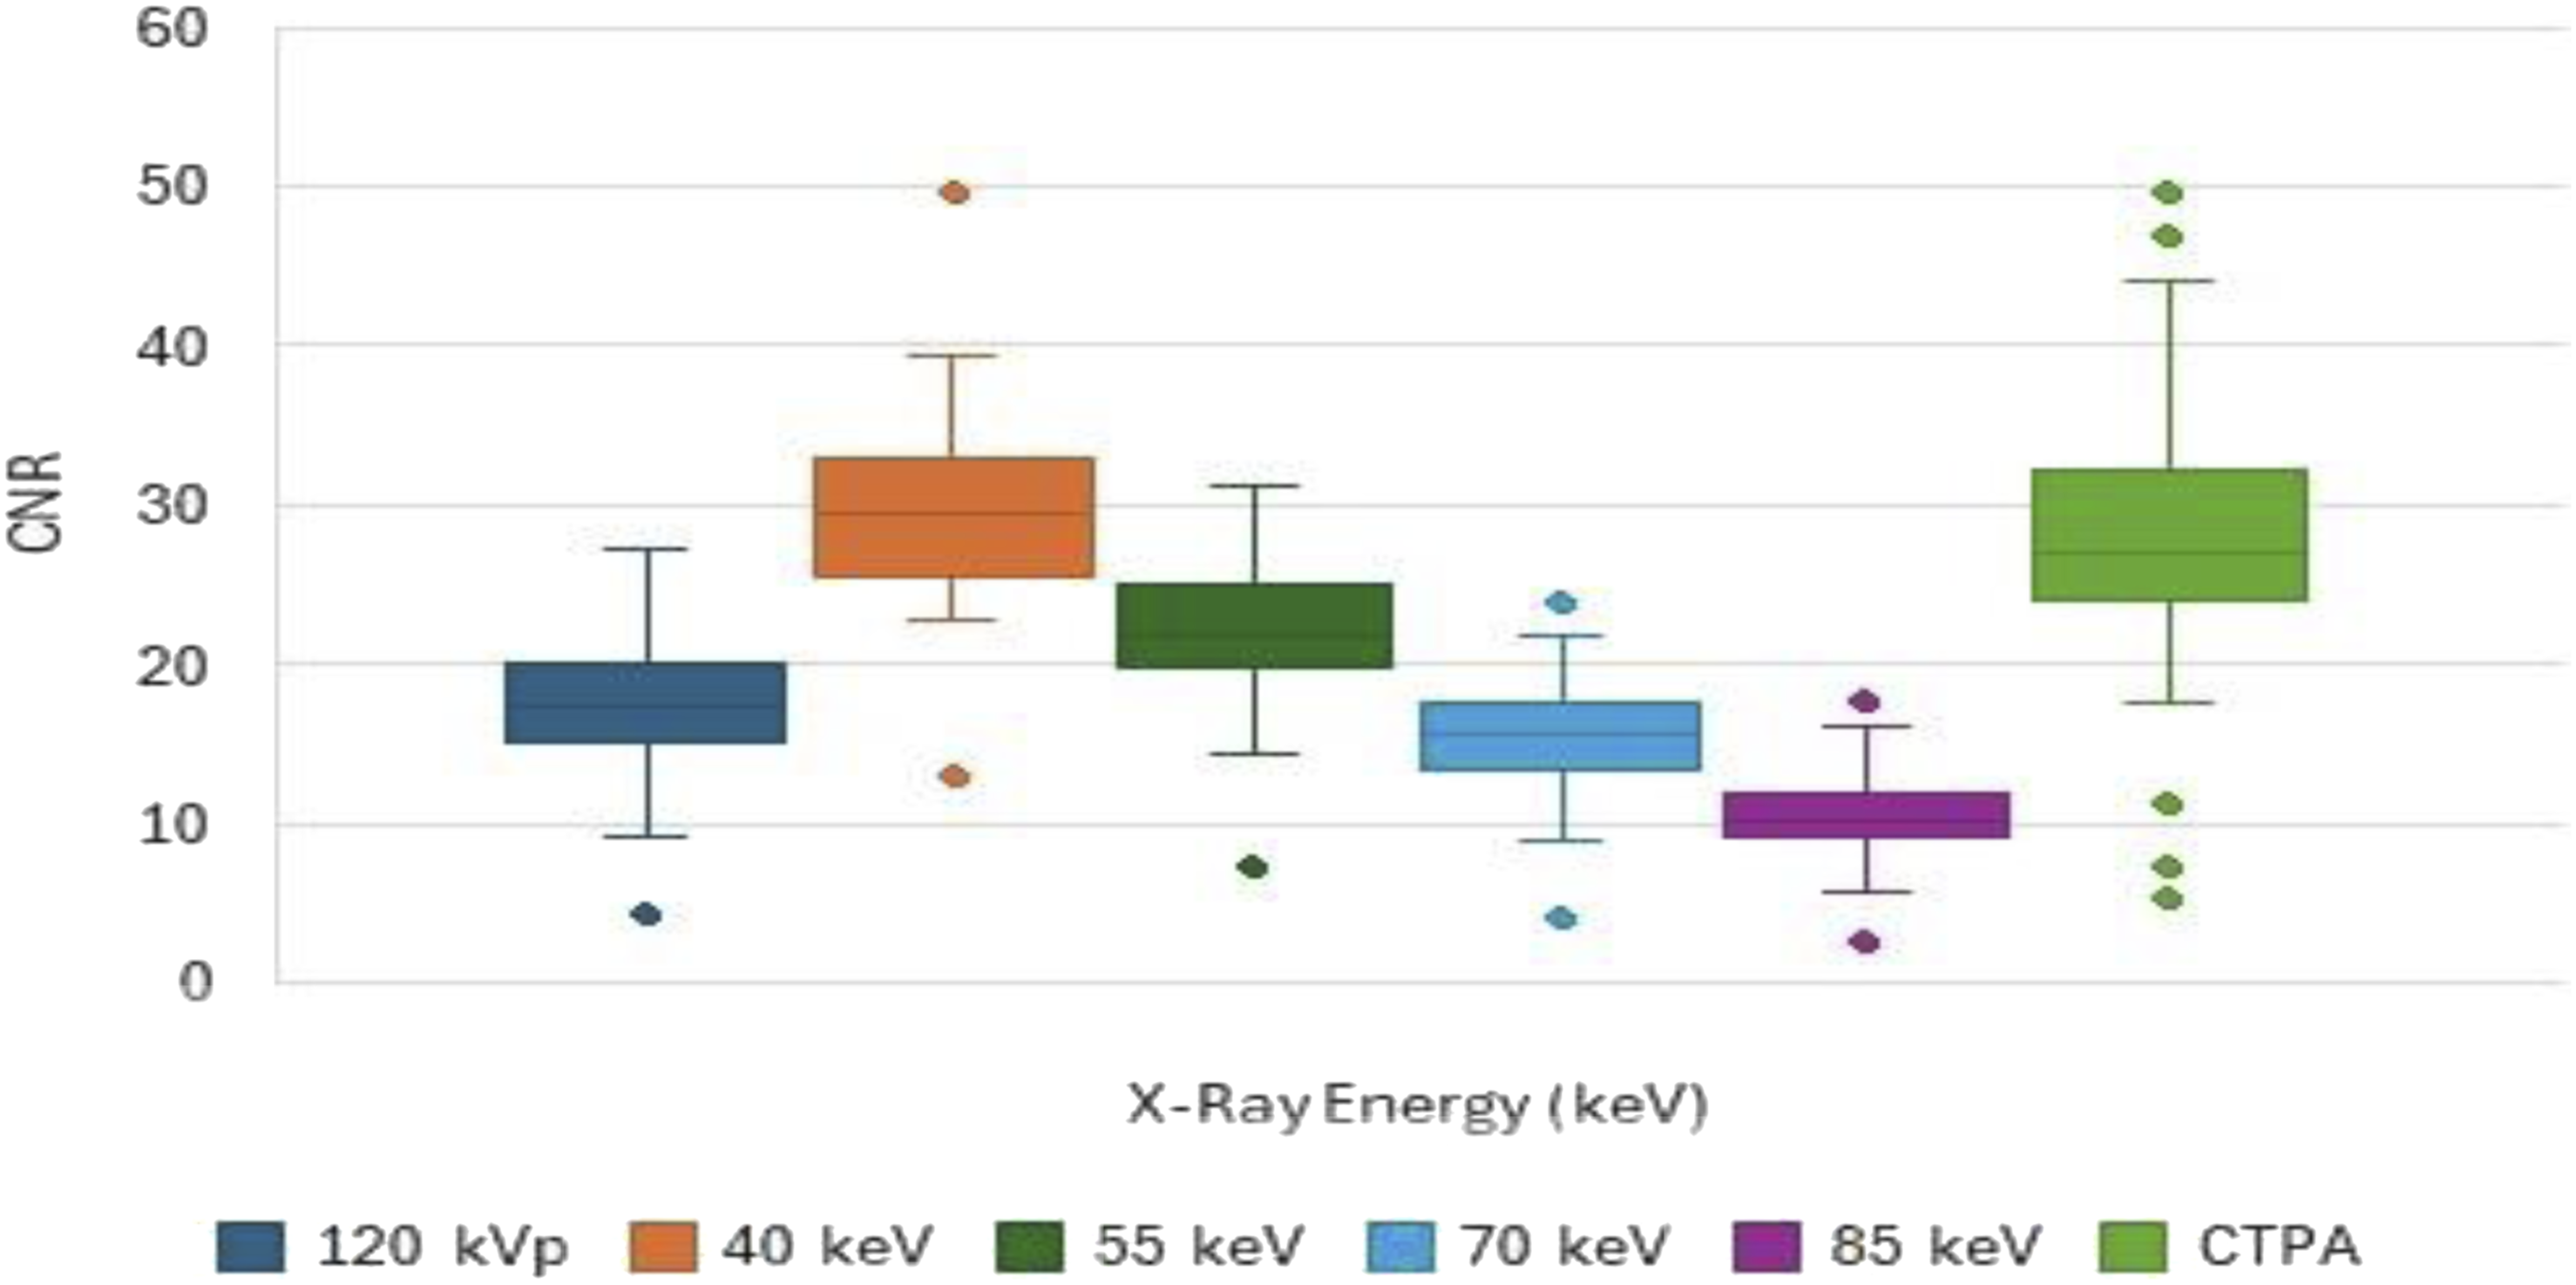
SNR was also highest at 40 keV, and tended to decrease with increasing energy. Mean SNR was lower at 70 and 85 keV than in the conventional 120-kVp images (p < .001). There was no significant difference between 40 keV and CTPA in terms of SNR (p-value = .318) (Figure 3). Graph of the mean signal-to-noise ratio (SNR) of the pulmonary artery at each energy level in 45 patients with pulmonary embolism. Whiskers = ± 1 SD.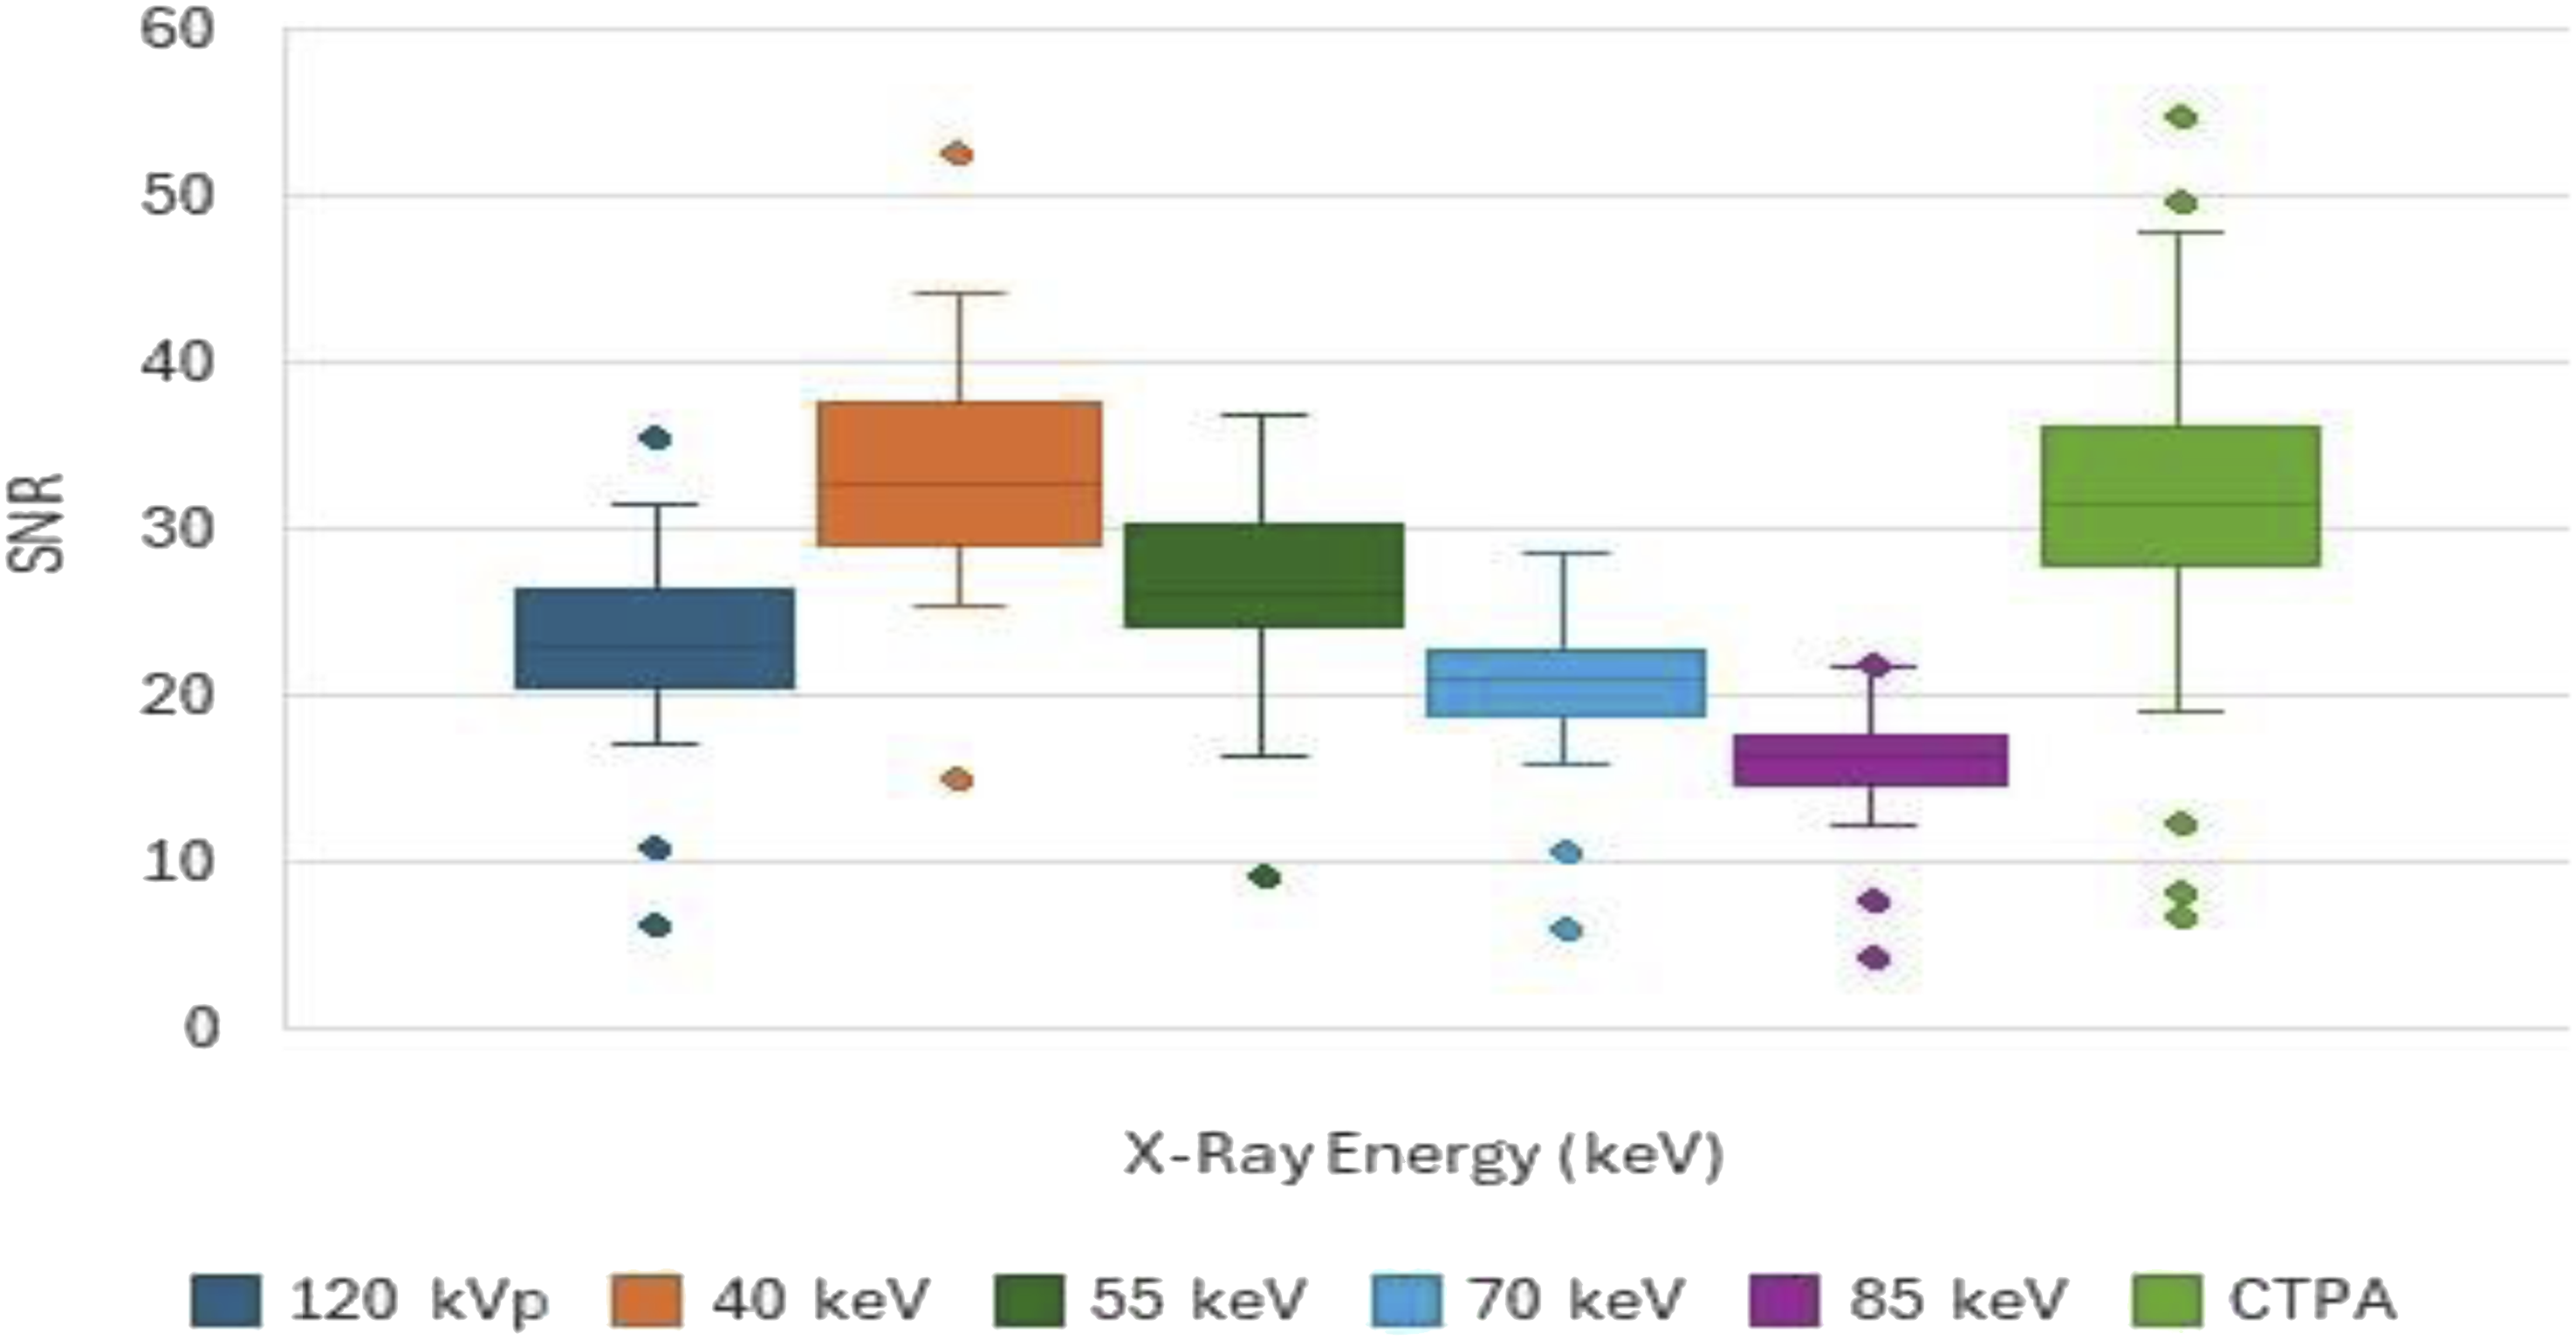
The average BN gradually increased from 10.0 ± 5.9 HU to 18.6 ± 5.6 HU as the energy level decreased. Average BN was significantly higher at 40, 55, and 70 keV than in the conventional 120-kVp images (p < .001), and was significantly lower at 85 keV than in the conventional 120-kVp images (p < .001).
Qualitative image analysis
Performance of Readers 1 and 2 for evaluating images for all patients at conventional 120 kVp and various energies.

Note - Bold indicates the total performance of each energy.
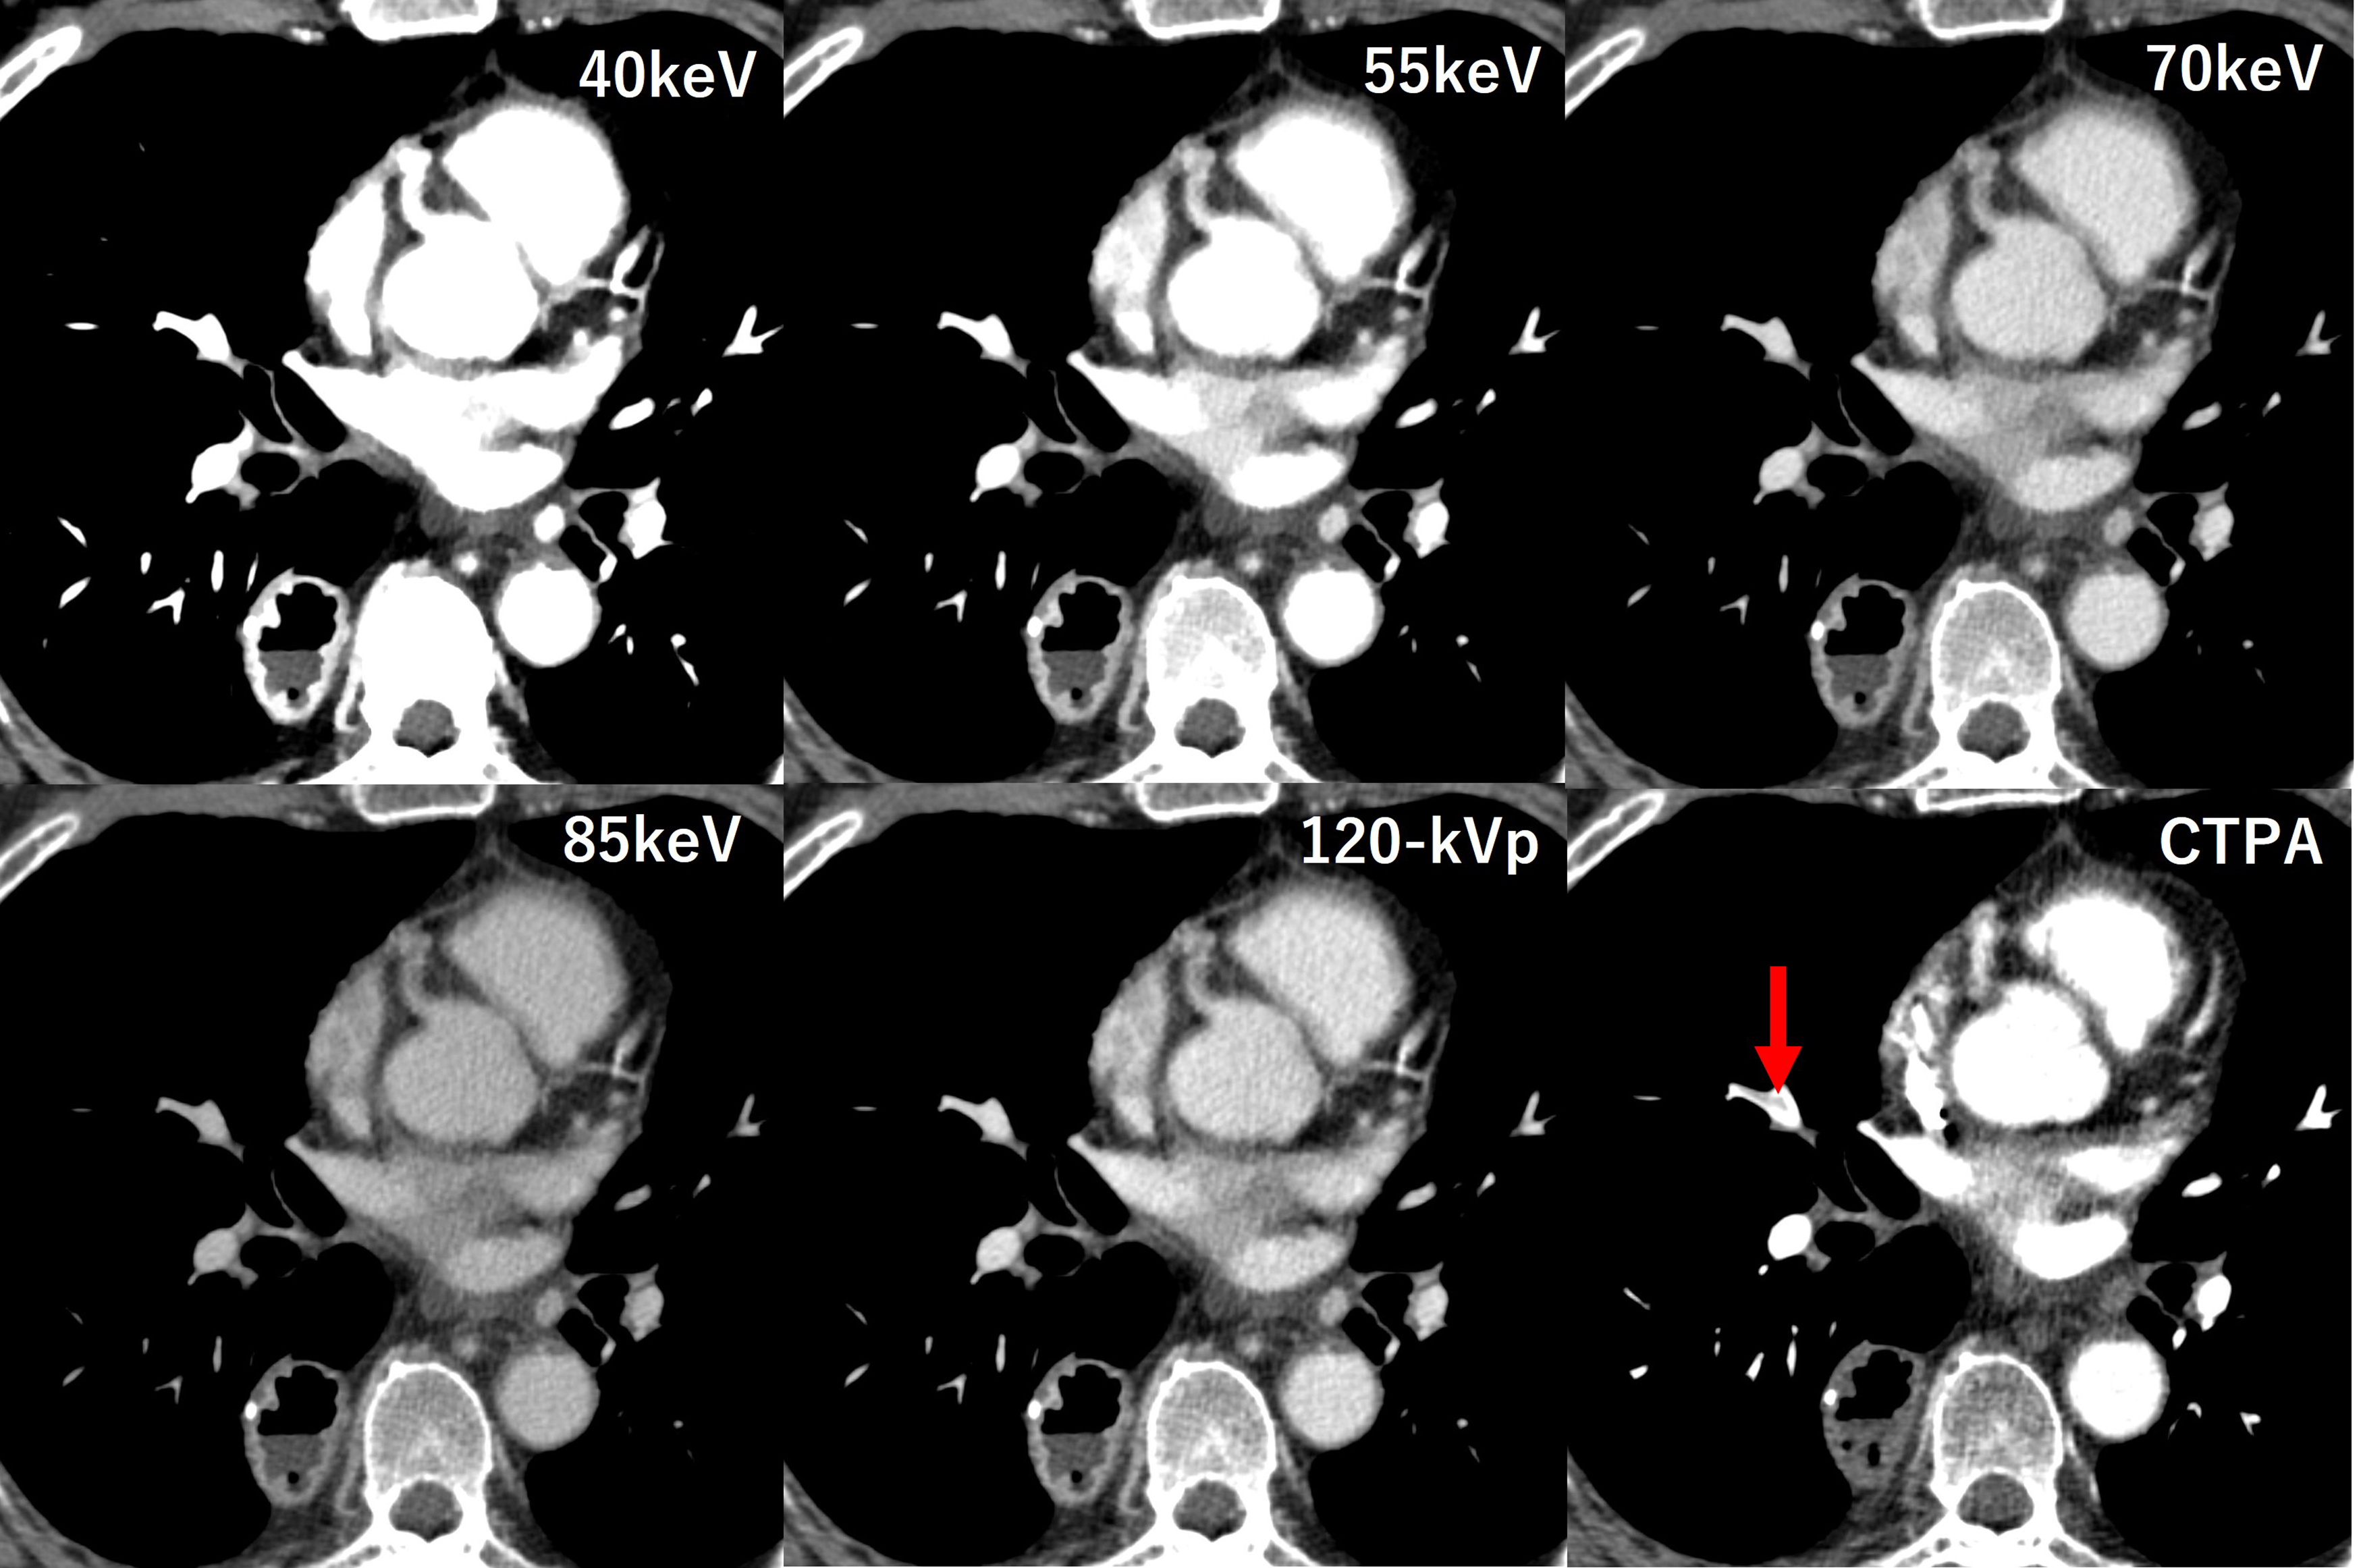
Under the condition of fixed window settings, in one patient the embolism disappeared completely at 40 keV, as shown in Figure 4. Small emboli could not be identified in the portal-venous phase of the original image or at any of the VMI energies (Figure 5). The patient was a 49-year-old woman with ovarian cancer who was asymptomatic. On CTPA, an obvious embolism can be seen in the lower lobe of the right pulmonary artery (arrow in CTPA image). Under the conditions of window width and level (400/70), the emboli can be seen in images other than 40 keV, but they cannot be seen at all at 40 keV. The patient was a 60-year-old man with esophageal cancer who was asymptomatic. A pulmonary embolism is apparent in the right middle lobe on CTPA (arrow in CTPA image), but cannot be visualized on PP-DECT at 120 kVp or any VMIs. Even when the window width and level were changed, the same result was obtained.
Agreement between observers for the entire pulmonary artery was 0.519 at 40 keV, 0.739 at 55 keV, 0.702 at 70 keV, 0.742 at 85 keV; 0.779 for conventional 120-kVp images; and 0.893 at 55 keV with a freely set window width and level.
Discussion
In this study, we conducted a qualitative and quantitative evaluation of VMIs created from PP-DECT and of conventional 120-kVp images, using CTPA images as the standard. Although some previous studies have evaluated emboli using CTPA and VMIs, our study used dual-layer detector spectral CT (DLCT) and divided the pulmonary artery into 14 segments for each patient to provide a more detailed evaluation. In terms of quantitative evaluation of image quality, the highest CNR and SNR were observed at 40 keV, in agreement with the results of previous studies.6–8 Furthermore, for both CNR and SNR, 40 keV was comparable to CTPA, but noise was significantly higher than CTPA. At 55 keV, both CNR and SNR were significantly lower than CTPA, and noise was also higher. Therefore, the results of the quantitative evaluation confirmed that image quality at all VMI energies was inferior to that of CTPA.
In the qualitative evaluation, in both readers the sensitivity and accuracy were highest at 55 keV with a fixed window width and level. However, this finding appears to contradict the fact that CNR and SNR are higher at 40 keV than at 55 keV, for which there are several reasons. First, contrast is higher at 40 keV, but there is more noise at 40 keV than at 55 keV. Second, emboli that can be clearly identified in conventional 120-kVp images may become completely invisible at 40 keV. This has been demonstrated in previous studies and is thought to be caused by “overbeaming,” which may be related to window settings.9–11 We decided to fix the window width and level in the second session of this study to focus on the detection of incidental emboli during the reading of PP-DECT images in routine clinical practice. Overbeaming cannot be completely corrected by adjusting the window settings alone 9 ; however, in the present study, we may have underestimated evaluation of the 40 keV images in particular by using fixed window settings. However, although the number of cases was smaller and the evaluation methods differed from those used in our study, a previous study conducted under conditions where the window could be freely set reported that 55 keV provided the most satisfying subjective image quality compared to 40 keV. Based on the above, we consider 55 keV to be the optimal setting, but we cannot completely rule out the possibility that 40 keV may be optimal. We will consider this as a future task. Furthermore, for other cases, adjusting the window setting did not make it possible to identify the emboli at 55 keV. We consider that this occurred because the similarity of the CT values of the embolus and the surrounding contrast agent in the blood vessel made it difficult to distinguish between the two. In addition, if the contact area with the blood vessel is small, the shape of the blood vessel wall becomes smooth, which can make diagnosis difficult. To summarize, as in previous studies, when the window width and level were fixed, 55 keV was likely to have the highest diagnostic accuracy, but accuracy may have been underestimated at 40 keV. All VMIs were inferior to CTPA in terms of diagnostic accuracy.
In our study, the inter-reader agreement rate was clearly lower at 40 keV than at other energies, perhaps due to the same over-beam as above, or to the narrow diameter of the blood vessels in the segmental and sub-segmental regions. Other studies have also reported low inter-reader agreement and accuracy rates in segmental and subsegmental regions, where blood vessels are thin.12–15 However, worrying about them may not be of much significance. The reason for this is that if there are no thrombi in the deep veins of the lower extremities and only a single or small number of thrombi in these peripheral regions, there is no consensus on whether to treat or not because of the risks associated with treatment.16–18 In other words, there is a possibility of overdiagnosis.
In some cases, neither of the two readers could detect emboli in the lobar region, probably for the reason that the correct anatomical position of the emboli was uncertain. The actual rate of correct diagnosis of embolism in the lobar region may be even higher.
Some limitations of this study need to be addressed. First, subjective evaluation under conditions in which the window width and level could be freely set was performed only at 55 keV. Second, the distribution of the emboli was uneven, and there were few cases in the main pulmonary artery, which is clinically the most important. Third, the study was conducted at a single facility, and all included patients had tumors.
In conclusion, although VMIs obtained from PP-DECT were inferior to CTPA images, by freely setting the window width and level in areas excluding segmental and subsegmental regions it was possible to improve the embolism detection rate to 98% or more, which is 2.9%–4.8% higher than that for conventional 120 kVp portal-venous phase images.
Footnotes
Acknowledgements
We thank Hideki Nakajima for his cooperation in the radiological technology aspects of this project.
Declaration of Conflicting Interests
The author(s) declared no potential conflicts of interest with respect to the research, authorship, and/or publication of this article.
Funding
The author(s) received no financial support for the research, authorship, and/or publication of this article.