
Abstract
Background
Pericoronary adipose tissue density (PCAT) is a parameter that quantifies inflammation and atherosclerosis around the coronary arteries.
Purpose
To investigate the correlation between PCAT and plaque features, stenosis degrees in coronary arteries (LAD, RCA, Cx) with stenotic vulnerable plaques.
Material and methods
A Retrospective study including 103 patients (64M, 39F) who underwent coronary computed tomography was retrospectively examined at a single center. PCAT and high-risk plaques were measured independently and compared to stenosis and coronary artery type. Adipose tissue attenuation, ranging from −180 to −25 HU, was measured along the plaque’s length and in a 0.5-1 mm region around the perilesional coronary arteries.
Results
The PCAT values increases with the degree of stenosis in the LAD, Cx, and RCA (r = 0.9161, p < .001; r = 0.9717, p < .001; r = 0.9315, p < .001, respectively). PCAT values demonstrate a positive pattern when plaque length increases in all coronary arteries (r = −0.6316, p < .001; r = −0.8825, p < .001; r = −0.7529, p < .001; LAD, Cx, RCA). PCAT values differed significantly based on plaque type in all coronary arteries. Calcified plaques showed statistically significant differences compared to both soft and mixed plaques (p < .05). Patients with positive remodeling had PCAT values of −69.43 (±8.76) HU, while cases without positive remodeling had PCAT values of −84.54 (±7.65) HU, indicating a significant difference (p < .05).
Conclusion
The combined evaluation of plaque features, stenosis degree, and PCAT provides a more accurate prediction of possible acute coronary syndrome cases than analyzing stenosis degree alone.
Introduction
Coronary artery disease (CAD) remains a significant cause of mortality despite continuous advancements in treatment modalities. 1 Among the non-invasive techniques used for CAD detection, Computed Tomography (CT) angiography has emerged as a valuable tool, particularly due to its high negative predictive value. 2 However, for effective treatment planning, it is crucial to not only assess the anatomical structure but also evaluate the impact of stenosis on cardiac hemodynamics 3
Inflammation is an important factor in the development and progression of atherosclerosis and plays a major role in the rupture of unstable coronary plaques and in the emergence of serious cardiovascular problems as a result of the progression of coronary artery atherosclerosis. 4
Vascular inflammation has been demonstrated to decrease lipid aggregation in pericoronary fatty tissue and increase fatty tissue density, particularly around the RCA. 5
Numerous studies have demonstrated that elevated pericoronary adipose tissue density surrounding the RCA may indicate the prognosis of unstable plaques and lead to an increase in plaque as a result of coronary plaque inflammation.5,6 Plaque instability produces inflammation by aggregating lymphocytes, neutrophils, and adipocyte-derived macrophages around the coronary artery at the perilesional level, according to histological analysis. 7
Pericoronary fatty tissue attenuation (PCAT) plays an important role in coronary artery calcification, inflammation and plaque vulnerability. 8 CCTA observed a correlation between reduced coronary flow reserve and higher attenuation surrounding the PCAT. 9 Increased perilesional density can indicate endothelial dysfunction in the coronary arteries, atherosclerotic plaque formation and symptoms ranging from coronary artery disease to advanced myocardial infarction.6,8
Our objective is to measure the attenuation of pericoronal adipose tissue surrounding coronary arteries, to assess its association with coronary artery diseases and variations, and to correlate PCAT values with predictors of acute coronary syndrome that may lead to significant stenosis in the future.
Materials and methods
Ethics and study population
This study was conducted with the approval of the [Kırklareli Research and Training Hospital] Ethics Committee. As this was a retrospective analysis, the requirement for informed consent was waived. This single-center, retrospective study included patients with stable angina who underwent coronary computed tomography angiography (CCTA) between 2022 and 2024. A total of 456 patients were initially reviewed for eligibility.
Inclusion and exclusion criteria
Patients who had coronary artery bypass graft surgery, coronary stents, no detectable coronary plaque, systemic inflammatory diseases, or renal dysfunction were excluded. Additional exclusion criteria included patients with insufficient image quality, systemic or local variations affecting peri- and epicardial fat attenuation, patients under 20 years old, and conditions that could influence adipose tissue attenuation. Patients with significant left main coronary artery (LMCA) variations (e.g., tortuosity or short segments) were excluded, and only left anterior descending (LAD), right coronary artery (RCA), and circumflex artery (Cx) were analyzed. The flow chart is shown in Figure 1. After exclusion criteria, 103 patients (64M, 39F) who underwent coronary computed tomography were included in the study and retrospectively reviewed. Flow Chart of patient inclusion and exclusion criteria.
Coronary computed tomography angiography acquisition
CCTA was performed using 128-slice CT scanner (GE Healthcare, Revolution EVO, USA). Patients were administered oral and/or intravenous β-blockers to achieve a target heart rate of ≤70 bpm unless contraindicated (Figure 2). 3D and maximum intensity projection images of the coronary arteries in coronary CT angiography obtained with 128 slices and retrospective ECG gating (a)-(e).
Analysis of coronary artery CTA and plaque characteristics
The assessment focused on vulnerable plaques, positive remodeling, focal calcifications, and low-attenuation plaques. Plaques contributing to stenosis were classified using the CAD-RADS system as follows: minimal: 1%–24% stenosis; mild: 25%–49% stenosis; moderate: 50%–70% stenosis, severe: 71%–99% stenosis (Figure 3). The total length of plaques was recorded. Severe stenoses were excluded from the study. Coronary artery plaques are colored according to stenosis grading and plaque types (a)-(d).
Fat tissue and plaque analysis
Perilesional coronary artery adipose tissue was studied by measuring fat attenuation within 0.5-1 mm of the coronary arteries, with PCAT assessed across the entire lesion by positioning the centerline at a consistent radial distance from the outer vessel wall, corresponding to the fatty area directly adjacent to the plaque.9,10 Adipose tissue was defined as having attenuation values between −180 and −25 Hounsfield Units (HU). A voxel attenuation histogram was generated to determine the fat attenuation index, and the mean density of adipose tissue volume was calculated (Figure 4). Measurement of PCAT values observed in coronary arteries adjacent to plaques (a)-(d).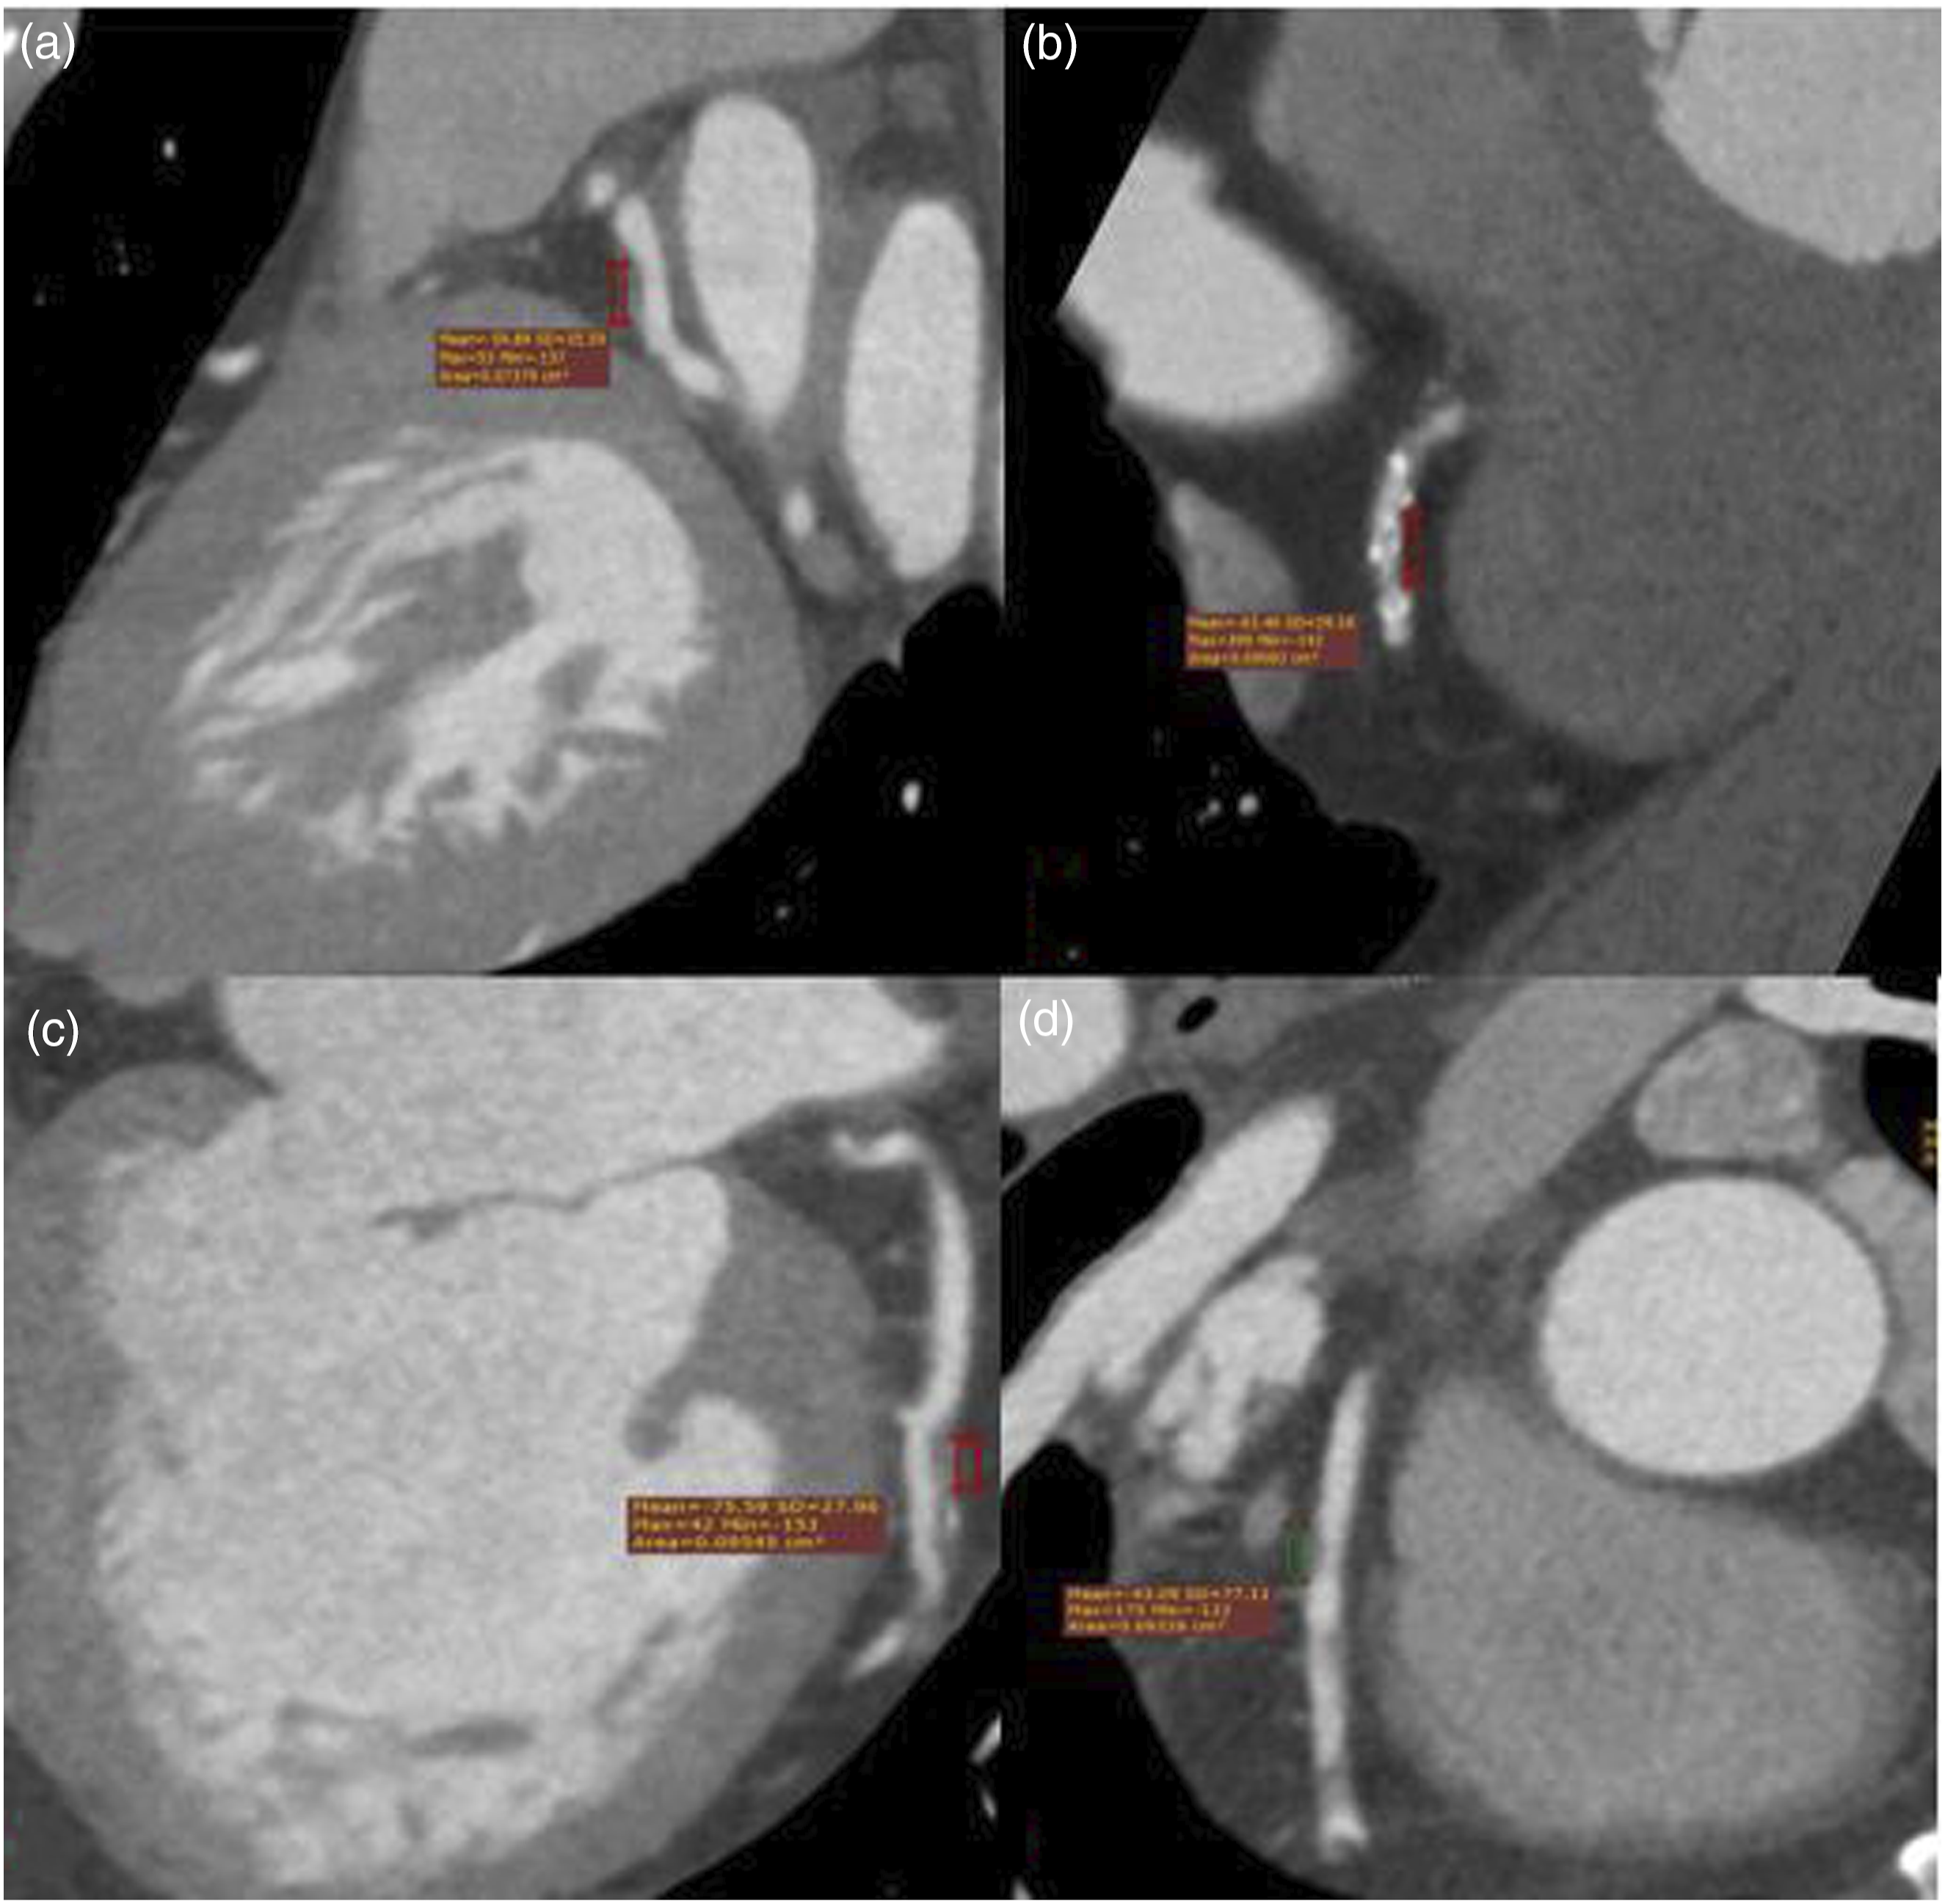
Image analysis
CT images were acquired using CT scanner. The protocol involved the administration of contrast material as described in previous studies. 11 Image quality was optimized by administering β-blockers if necessary to maintain a target heart rate of ≤60 bpm.
Statistical analysis
Continuous parametric variables were expressed as means ± standard deviations, and categorical variables were reported as frequencies and percentages. Data were assessed for normality and homogeneity of variance. For normally distributed data with homogeneity of variance, analysis of variance ANOVA was used to compare groups. For non-normally distributed data, multivariate ANOVA was applied. Correlations between continuous variables were assessed using bivariate analysis, with Pearson’s r or Spearman’s r coefficients calculated as appropriate. Statistical significance was defined as p < .05. All analyses were conducted using SPSS version 20.0.
Results
Coronary CCTA examinations were examined on 105 patients (total 296 vessels) who met the inclusion criteria. The mean age of the patients was 56.2 (±11.13). There were 64 male patients and 39 female patients. The number of normal patients without plaque in their coronary arteries was 170. While 62 patients had LAD plaque, 41 patients did not have LAD plaque. Upon evaluating LAD plaque stenosis rates, mild stenosis was observed in 31 patients, moderate stenosis in 24 patients, intermediate stenosis in seven patients, and severe stenosis in 2 patients. Regarding plaque morphology in the LAD, 27 plaques were classified as calcific, 19 as soft plaques, and 16 as mixed-type plaques. The mean length of LAD plaques was 8.26 mm (range: 6.48–10.04 mm). For the Cx artery, plaques were identified in 30 patients, while 73 patients had no detectable plaques. Among the Cx plaque types, 15 were calcific, 10 were soft, and 5 were of mixed type. The mean length of Cx plaques was 2.85 mm (range: 1.90–3.80 mm). In terms of stenosis severity in the Cx artery, 14 patients exhibited mild stenosis, 10 had moderate stenosis, 6 demonstrated intermediate stenosis, and 2 patients had severe stenosis. In the RCA, plaques were observed in 41 patients, whereas 62 patients had no plaques. The distribution of RCA plaque types included 19 calcific plaques, 12 soft plaques, and 10 mixed-type plaques. The mean length of RCA plaques was measured as 5.63 mm (range: 3.96–7.29 mm). Regarding RCA stenosis severity, mild stenosis was present in 19 patients, moderate stenosis in 18 patients, intermediate stenosis in 4 patients, and severe stenosis in 2 patients. Simultaneous plaque presence in both the LAD and RCA was noted in 25 patients, while 33 patients exhibited concurrent plaques in both the LAD and Cx arteries. Additionally, 12 patients had plaques in all three arteries—LAD, Cx, and RCA. Notably, no cases were identified where plaques were present in both the LAD and RCA but absent in the Cx artery.
Relationship between PCAT values and coronary arteries
While the mean PCAT values of those with plaque in the LAD were measured as −74.43 (±15.83) HU, the mean PCAT values at the level of the LAD without plaque were measured as −120.40 (±17.95) HU. There is a positive, strong, and statistically significant correlation between the PCAT values in the plaques observed in the LAD and the PCAT values in the normal part of the same coronary artery without plaque (r = 0.9161, p < .001). The mean PCAT values of those with plaque in the Cx were measured as −72.90 (±16.52) HU, while the mean PCAT values at the level of the Cx without plaque were measured as −111.20 (±12.68) HU. There is a positive, strong, and statistically significant correlation between the PCAT values in the plaques observed in the Cx and the PCAT values in the normal part of the same coronary artery without plaque (r = 0.9717, p < .001). While the PCAT values in plaques observed in RCA were 36.38 (±38.86) HU, the mean PCAT values in the plaque-free RCA level were measured as −85.23 (±51.90) HU. There was a positive, strong, and statistically significant correlation between the PCAT values in plaques observed in RCA and the PCAT values in the normal part of the same coronary artery without plaque (r = 0.9315, p < .001). No statistically significant difference was found between the mean PCAT values of those with plaque in two or more coronary arteries and the PCAT values of isolated coronary artery plaques (p > .05). The mean PCAT values in plaque-positive RCA arteries were found to be lower in density than those in other coronary arteries. However, no significant correlation was found between the PCAT values of RCA and LAD (r = 0.056, p = .0666). A positive and moderate correlation was found between the mean RCA PCAT value and Cx PCAT values at the plaque level (r = 0.4653, p = .175).
Relationship between plaque stenosis degrees and coronary artery PCAT values
As the severity of stenosis in the LAD, Cx, and RCA plaques increases, an elevation in PCAT levels is noticed. In addition to the statistically significant difference between individuals with and without stenosis, significant differences were found among them based on the degree of stenosis. LAD PCAT values showing mild stenosis were measured as −83.31 (±14.35) HU, LAD PCAT values showing moderate stenosis were measured as −64.33 (±11.94) HU, and LAD PCAT values showing moderate stenosis were measured as −67.57 (±7.43) HU. There were no statistically significant differences between plaques showing moderate and moderate stenosis in LAD (p > .05), and a statistically significant difference was found between mild and moderate stenosis (p = .007). Cx PCAT values showing mild stenosis were measured as −84.07 (±12.30) HU, Cx PCAT values showing moderate stenosis were measured as −63.44 (±11.08) HU, and Cx PCAT values showing moderate stenosis were measured as −58.33 (14.64) HU. There were no statistically significant differences between moderate and moderate stenosis in Cx (p > .05), and a statistically significant difference was found between mild and moderate stenosis (p = .006). There was a positive and strong statistically significant correlation between LAD and Cx PCAT values and stenosis degrees (r = 0.6533, p < .001). RCA PCAT values showing mild stenosis were measured as −86.63 (±12.65) HU, RCA PCAT values showing moderate stenosis were measured as −63.44 (±11.08) HU, and RCA PCAT values showing moderate stenosis were measured as −58.00 (±9.83) HU. There are statistically significant differences between RCA PCAT values and stenosis degrees (mild - moderate - moderate stenosis) (p < .001).
Relationship between plaque characteristics and coronary artery PCAT values
PCAT values (HU) according to coronary artery stenosis and plaque characteristics.

Relationship between plaque length and coronary artery PCAT values
A positive correlation is observed between increasing plaque length and rising PCAT values in all coronary arteries (r = −0.6316, p < .001; r = −0.8825, p < .001; r = −0.7529, p < .001, for LAD, Cx, and RCA, respectively). The graph of plate length and pcat values is shown in Figure 5. Plaque length and PCAT values graphic.
Relationship between myocardial bridging rate of plaques and PCAT values of coronary artery
The number of cases with myocardial bridging (MB) was 32, 24 of which were LAD and 8 were Cx. No MB findings were observed in RCA. Plaque is observed in 32% of the patients after MB. In this case group, no plaque is observed at the MB level. In LAD, the mean PCAT values after MB, regardless of other factors such as plaque type, length, and type, were −110.25 (±9.44) HU; in LAD without MB but with plaque, the mean PCAT value was measured as −92.65 (±8.75) HU, and although it was found to be higher than in lesions after MB, no statistically significant difference was found (p > .05). In addition, there is a negative, strong, and statistically significant correlation between MB length and PCAT values (=-0.7438, p < .001).
Vulnerable plaques
There were 15 patients with positive remodeling. 2 cases showed napkin rings, and the number of low-attenuation plaques was 7. While the PCAT values in patients with positive remodeling were −69.43 (±8.76) HU, the PCAT values in cases without positive remodeling were measured as −84.54 (±7.65) HU, and a statistically significant difference was found (p < .05).
Discussion
The most important outcomes of this study are the early detection of coronary atherosclerosis, hence the PCAT values and their link with coronary illnesses were examined in instances without extensive stenosis. We attempted to quantify the predicted stenotic stenosis of plaques and assess diagnostic accuracy by considering not only plaque stenosis but also plaque vulnerability and case variability. Our findings emphasize the use of non-invasive imaging radiological indicators and parameters in the evaluation of coronary inflammation.
Jia et al. demonstrated the value of PCAT in assessing plaque vulnerability and hemodynamic characteristics. 12 Inspired by this study, our research observed substantial differences in PCAT attenuation values across plaque and non-plaque regions, validating the prognostic potential.
PCAT has also been indicated to be increasing in cases of non-ST myocardial infarction and plaque rupture. 13 Our analysis indicated that PCAT values were greater in patients with stable yet chest pain and in those with plaques. This is in line with the literature and could predict emergencies such as non-ST myocardial infarction. Likewise, we found that PCAT values were higher in those with soft plaques.
On regular coronary CT angiography, Goeller et al reported a significant association between PCAT density and noncalcified plaques, as well as overall plaque burden. 6 The finding is crucial for the early identification of high-risk plaques and the prompt assessment of medical treatment needs. Maddox et al. observed that whereas numerous coronary arteries have less than 50% stenosis, early detection of susceptible lesions in plaques is crucial for preventing cardiovascular symptoms. 14 Along with the literature, we discovered notable increases in PCAT values, particularly surrounding plaques that initiated positive remodeling.
Achenbach et al. revealed that plaques with positive remodeling surrounding the RCA had higher PCAT density. 15 We believe that this is a result of inflammation around the plaque. Another study found that the increase in PCAT in the proximal RCA could suggest pathophysiological alterations in the overall coronary vascular system. 5 The study we conducted showed similar outcomes across all coronary arteries. One study observed that higher fat tissue density surrounding coronary arteries was associated with focal 18F-NaF-PET uptake, which may indicate coronary inflammation. 16 In addition to the advanced degree of plaque, it is critical to predict plaque growth in the future, particularly in cases of moderate to moderate stenosis. In our investigation, we discovered a substantial difference in PCAT ratios between patients with mild stenosis and moderate to moderate stenosis.
Yan et al. found that combining coronary stenosis degree, PCAT, and plaque features might predict plaque-specific ischemia. 17 Yu et al. reported that PCAT should be assessed in conjunction with total plaque volume and stenosis since perivascular PCAT values were considerably greater in flow-limiting lesions than in non-flow-limiting lesions. 18 Consistent with previous research, we also discovered that the degree of stenosis directly correlated with an increase in PCAT readings. Furthermore, in contrast to retrospective investigations in patients with severe stenosis, our analysis primarily identified coronary artery abnormalities that resulted in mild to moderate stenosis. The primary goal of our research was to foresee how these stenoses will develop.
Long et al. noticed that combining the perivascular fat attenuation index and plaque length was useful in predicting myocardial ischemia. 19 Yu et al. discovered an important correlation between PCAT and plaque volume, rather than plaque length. 18 Our findings coincide with those reported in the literature. Although we did not conduct a volumetric assessment of plaque burden, we did quantify plaque lengths in two dimensions in our sample. Notably, we observed a greater PCAT ratio in instances with longer plaque lengths, regardless of other relevant factors. This major association among plaque length and PCAT could indicate an underlying relationship with overall plaque burden.
Myocardial bridging (MB), which has been associated to several conditions such as myocardial ischemia, infarction, and arrhythmia in many examinations, is hypothesized to reduce coronary flow reserve by increasing diastolic flow in response to the degree of coronary artery bridging. 20 In the study we conducted, we measured myocardial bridging in the LAD versus Cx and RCA and assessed the degree of stenosis in these locations. Our results indicate that the frequency of plaques decreases, particularly in distant segments, following myocardial bridging, while the incidence of plaques increases near the bridging level. We consider this condition as plaque buildup at the level of MB and a decrease in plaque formation in distant segments due to the substantially higher flow reserve.
In conclusion, the PCAT values has great potential as a non-invasive diagnostic for evaluating patients with new-onset chest pain, excluding acute myocardial infarction, because it elucidates the link between coronary plaque stenosis and its kinds. Furthermore, integrating PCAT assessment with plaque features and stenosis severity improves the prediction accuracy of acute coronary syndrome cases when compared to analyzing stenosis severity alone. These findings underscore the importance of adding PCAT values into routine coronary CT angiography for better cardiovascular risk assessment and preventative strategies.
Footnotes
Acknowledgments
Thanks to Ömer Kostak for providing support for patient data and images.
Declaration of conflicting interests
The author(s) declared no potential conflicts of interest concerning the research, authorship, and/or publication of this article.
Funding
The author(s) received no financial support for the research, authorship, and/or publication of this article.