
Abstract
Background
Diffusion-weighted imaging (DWI) and dynamic contrast-enhanced magnetic resonance imaging (DCE-MRI) are widely used in the orofacial region. Furthermore, quantitative analyses have proven useful. However, a few reports have described the correlation between DWI-derived parameters and DCE-MRI-derived parameters, and the results have been controversial.
Purpose
To evaluate the correlation among parameters obtained by DWI and DCE-MRI and to compare them between benign and malignant lesions.
Material and Methods
Fifty orofacial lesions were analysed. The apparent diffusion coefficient (ADC), true diffusion coefficient (D), pseudodiffusion coefficient (D*) and perfusion fraction (f) were estimated by DWI. For DCE-MRI, TK model analysis was performed to estimate physiological parameters, for example, the influx forward volume transfer constant into the extracellular-extravascular space (EES) (Ktrans) and fractional volumes of EES and plasma components (ve and vp).
Results
Both ADC and D showed a moderate positive correlation with ve (ρ = 0.640 and 0.645, respectively). Ktrans showed a marginally weak correlation with f (ρ = 0.296), while vp was not correlated with f or D*; therefore, IVIM perfusion-related parameters and TK model perfusion-related parameters were not straightforward. Both D and ve yielded high diagnostic power between benign lesions and malignant tumours with areas under the curve (AUCs) of 0.830 and 0.782, respectively.
Conclusion
Both D and ve were reliable parameters that were useful for the differential diagnosis. In addition, the true diffusion coefficient (D) was affected by the fractional volume of EES.
Introduction
Diffusion-weighted imaging (DWI) and dynamic contrast-enhanced magnetic resonance imaging (DCE-MRI) are widely used throughout the human body, including in the head and neck region. Furthermore, quantitative analyses have proven useful for various purposes, such as differential diagnoses,1–3 metastatic lymph node evaluations and predicting the chemoradiotherapy response.4–6
The apparent diffusion coefficient (ADC) has been widely used in clinical situations. Many reports have shown a negative correlation with the ADC and the absolute number of cells per square millimetre; in addition, a positive correlation has been reported with the percentage area of stroma.7–10 Intravoxel incoherent motion (IVIM) is attractive by virtue of its ability to elucidate both tissue diffusivity and perfusion, which yield the true diffusion coefficient (D), pseudodiffusion coefficient (D*) and perfusion fraction (f).11–17
In the quantitative analysis of DCE-MRI findings, the conventional assessment involves the estimation of parameters based on the time-intensity curve (TIC), such as the time of arrival of contrast agent (CA) (T0), time to peak (TTP), maximum relative enhancement (MAXRELENH) and wash-in rate (WASHIN). However, this does not provide information on the underlying pharmacokinetic parameters in the tissue. Therefore, several different pharmacokinetic analyses have been proposed, 18 with the Tofts and Kermode (TK) model proving to be one of the most popular, as it yields three physiological parameters: the influx forward volume transfer constant into the extracellular-extravascular space (EES) from the plasma (Ktrans), the fractional volume of the EES per unit volume of tissue (ve) and the fractional volume of the plasma per unit volume of tissue (vp).19,20
Given the above, we postulated that ve was correlated with both ADC and D. We further postulated that TK model perfusion-related parameters (Ktrans and vp) were correlated with IVIM perfusion-related parameters. However, only a few reports have described the correlation between DWI-derived parameters and DCE-MRI-derived parameters, and the results have been controversial.21–26
In addition, echoplanar (EPI)-DWI has been widely used. However, EPI-DWI causes signal loss and image distortion due to magnetic inhomogeneity in the orofacial region. Alternative acquisition methods that are less strongly influenced by susceptibility artifacts, such as turbo spin‒echo (TSE)-DWI, have been recommended.27,28 To our knowledge, no reports have evaluated the relationship between parameters obtained from TSE-DWIs and those obtained from DCE MRIs.
Thus, the present study evaluated the correlation between TSE-DWI-derived parameters and DCE-derived parameters and compared them between benign and malignant lesions.
Methods and materials
Study population
The ethics committee of our institution approved this retrospective study (no. 22025-02) and the need for informed consent was waived. The study plans were published on our institutional website. The patients had a right to decline to participate. The inclusion criteria were as follows: (a) all patients who consulted the Department of Oral and Maxillofacial Surgery from January 2021 to May 2023; (b) all patients with orofacial lesions who underwent MRI, including DCE-MRI and TSE-DWI; (c) patients whose lesion was visible on T1- and T2-weighted imaging; and (d) patients whose lesion had not been treated or recurred.
The exclusion criteria were as follows: (a) absence of a final diagnosis; (b) severe susceptibility artifacts; and (c) severe movement artifacts.
Imaging protocol
The MRI protocol was performed using a 3.0-Tesla MRI scanner (Achieva dStream, Ingenia and Ingenia Elition X; Philips Healthcare, Best, the Netherlands) with a 32-channel neurovascular coil.
DWI acquisition used a single-shot TSE protocol with 6 b-values of 0, 75, 150, 300, 500 and 1000 s/mm2. Other parameters were as follows: repetition time (TR) = 3000-3575 ms; echo time (TE) = 77.6-87.4 ms, number of acquisitions = 2; TSE factor = 26; field of view = 230 × 230; slice thickness = 5 mm; slice gap = 1 mm, acquisition matrix = 128 × 105; matrix reconstruction = 224 × 224; parallel imaging acceleration factor = 2; total scan duration = 300−367 s.
DCE-MRI used a three-dimensional T1 fast-field echo sequence. The representative parameters were TR = 6.1 msec; TE = 2.3 msec; flip angle = 15°; field of view = 220 mm; slice thickness = 6 mm; slice number = 11; reduction factor of Compressed SENSE reduction factor = 4.5; acquisition voxel (mm) = 1.72 × 1.84 × 6.00; and reconstruction voxel (mm) = 0.86 × 0.86 × 6.00. Thirty seconds after the start of data acquisition, the operator initiated the injection of CA. We obtained 150 phases with a temporal resolution of 1.97 seconds. Gadobutrol (Gd-DO3A butrol) (Gadovist®; Bayer Healthcare, Berlin, Germany) was administered at a dose of 0.1 mmol/kg at a rate of 1 mL/s, immediately followed by a 20-mL saline flush. A reference precontrast scan was acquired prior to the DCE-MRI scan. The scan parameters were identical to those of the DCE scan, except for the flip angle, which was 5°. The reference scan was also used to estimate the precontrast T1 map using the image data with two different flip angles.
Estimation of DWI-derived parameters
All data obtained via TSE-DWI in the DICOM format were transferred to a personal computer for analyses. The ADC, D, D* and f were estimated. These procedures were performed using the OsiriX MD software program, version 12.5.0 (Pixmeo SARL, Bernex, Switzerland) (Figure 1). A 70-year-old woman with salivary duct carcinoma at the tongue. The ADC, D, D* and f were obtained by TSE-DWI. This lesion had ADC, D, D*, and f values of 1.06 × 10⁻³ mm2/s, 0.772 × 10⁻³ mm2/s, 32.5 × 10⁻³ mm2/s and 0.31, respectively. The T0, TTP, MAXRELENH and WASHIN were obtained by a T1 perfusion analysis. This lesion had T0, TTP, MAXRELENH, and WASHIN values of 51.1 s, 86.4 s, 2.35 and 180, respectively. The Ktrans, ve and vp were obtained by a TK model analysis. Ktrans was 0.226 min−1, ve was 0.252 and vp was 0.068. High perfusion-related parameters (f, Ktrans and vp) and low D values were characteristic of this lesion.
Estimation of the DCE-derived parameters
A nonmodel analysis was first performed, directly analysing the change in the signal intensity during DCE-MRI. The representative parameters (T0, TTP, MAXRELENH and WASHIN) were estimated using an MR T1 perfusion software program in the workstation (Intelli Space Portal version 6; Philips Healthcare). (Figure 1).
A pharmacokinetic analysis based on the TK model was then performed to estimate the three parameters of Ktrans, ve and vp.19,20 These procedures were processed using a software program in the PAR/REC format (PRIDE software; Philips Healthcare). We set the r1 relaxivity of Gadovist to 5.0 mM/sec. (Figure 1).
Region of interest setting
All parameter maps were transferred to a personal computer for the ROI settings. Both the FOVs and matrix size of the DWI-derived parameter maps were matched to those of the DCE-MRI-derived parameter maps. An observer who was blinded to the final diagnosis selected the slice with the maximum area and manually drew a freehand ROI to circumvent the lesions. An observer with 28 years of experience in head and neck radiology set the ROI twice with an interval of at least 1 month.
For DWI scans, the ROI was placed with b = 0 s/mm2 by referencing the T2-weighted images, avoiding large vessels and necrotic areas. The ROIs were copied to all DWI-derived parameter maps. For the DCE-derived parameters, the ROI was placed on a dynamic image that clearly showed the contour of the lesion. The ROIs were then copied to all DCE-derived parameter maps. The ImageJ software program, version 1.5, was used for the ROI setting and measurement of the parameters.
Statistical analyses
The observers recorded the median of all estimated parameters. The intraobserver reliability was assessed by the intraclass correlation coefficient (ICC) with the 95% confidence interval (CI). The quantitative values obtained from two measurements were then averaged for further analyses. The correlation between the parameters was evaluated by Spearman’s rank correlation coefficient. The interpretations of the correlation coefficient (ρ) were as follows: 0.00–0.20, negligible correlation; 0.20–0.40, weak correlation; 0.40–0.70, moderate correlation; and 0.70–1.00, strong correlation. The quantitative values of all parameters were compared between two categories by Wilcoxon’s signed-rank sum test. We also performed a receiver operative curve (ROC) analysis to evaluate the diagnostic performance of three different quantifications (DWI-derived parameter, T1 perfusion-derived parameters and TK model-derived parameters) in differentiating benign from malignant lesions.
We performed all statistical analyses using the JMP Pro software program, version 16.0.0 (SAS Institute, Cary, NC, USA) and the SPSS Statistics software program, version 27.0 (IBM Corporation, Armonk, NY, USA). P values of <0.05 were accepted as statistically significant.
Results
Fifty patients were analysed in this study (male, n = 29; female, n = 21; average age, 59.8 ± 18.3 years old). Of the 50 total lesions, 32 were malignant tumours (squamous cell carcinoma [SCC], n = 25; malignant salivary gland tumours [MSGT] n = 5; adenocarcinoma, n = 1; malignant lymphoma [ML] n = 1). Eighteen lesions were benign (pleomorphic adenoma, n = 6; schwannoma, n = 3; ameloblastoma, n = 2; angioleiomyoma n = 1; vascular abnormality [VA], n = 1 and granulation tissue, n = 5). The final diagnosis was obtained from either a surgical specimen (n = 39), incisional biopsy (n = 10) or image diagnosis and clinical follow-up (VA, n = 1). The lesions were in the tongue (n = 12), buccal space (n = 11), maxilla (n = 9), mandible (n = 6), oral floor (n = 5), lip (n = 2), parotid space (n = 1), submandibular space (n = 1), oropharynx (n = 1) and upper neck (n = 2). The sizes of the ROI on DWI and DCE-1I were 301 ± 209 mm2 and 278 ± 190 mm2, respectively.
The ICCs were excellent for both DWI-derived parameters (ADC = 0.984, D = 0.991, D* = 0.947 and f = 0.968) and T1 perfusion-derived parameters (T0 = 0.990, TTP = .987, MAXRELENH = 0.988 and WASHIN = 0.994). The ICCs for the TK model-derived parameters were also excellent (Ktrans = 0.977, vp = .997, and vp = .993). Therefore, the average values obtained from the two measurements were used in further statistical analyses.
Correlations among DCE-MRI-derived parameters (T1 perfusion analysis vs. TK model analysis)
Correlations between T1 perfusion-derived parameters and TK model-derived parameters.

ρ, Spearman’s rank-order correlations; T0, time of arrival; TTP, time to peak; MAXRELENH, maximum relative enhancement; WASHIN, wash-in rate; Ktrans, the influx forward volume transfer constant into the EES from the plasma; ve, the fractional volume of EES; vp, the fractional volume of plasma.
*statistically significant difference (p < .05).
Correlations between T1 perfusion-derived parameters and DWI-derived parameters
Correlations between T1 perfusion-derived parameters and DWI-derived parameters.

ρ, Spearman’s rank-order correlations; T0, time of arrival; TTP, time to peak; MAXRELENH, maximum relative enhancement; WASHIN, wash-in rate; ADC, apparent diffusion coefficient; D, true diffusion coefficient; D*, pseudo diffusion coefficient; f, perfusion fraction.
*statistically significant difference (p < .05).
Correlations between TK model-derived parameters and DWI-derived parameters
Both the ADC and D showed a moderate positive correlation with ve (ρ = 0.640 and 0.645, respectively) (Figure 2). These results demonstrated that the increase in the EES resulted in an increase in ADC and D. Concerning the perfusion-related parameters, Ktrans showed a weak positive correlation with f (ρ = 0.296, p = .037). The details are shown in Table 3. Two-dimensional plot of the true diffusion coefficient (D) and fractional volume of the extravascular-extracellular component (ve). D had a moderate positive correlation with ve (ρ = 0.645). The black mark shows a malignant lesion, and the red mark shows a benign lesion. Correlations between TK model-derived parameters and DWI-derived parameters. ρ, Spearman’s rank-order correlations; Ktrans, the influx forward volume transfer constant into the EES from the plasma; ve, the fractional volume of EES; vp, the fractional volume of plasma, ADC, apparent diffusion coefficient; D, true diffusion coefficient; D*, pseudo diffusion coefficient; f, perfusion fraction. *statistically significant difference (p < .05).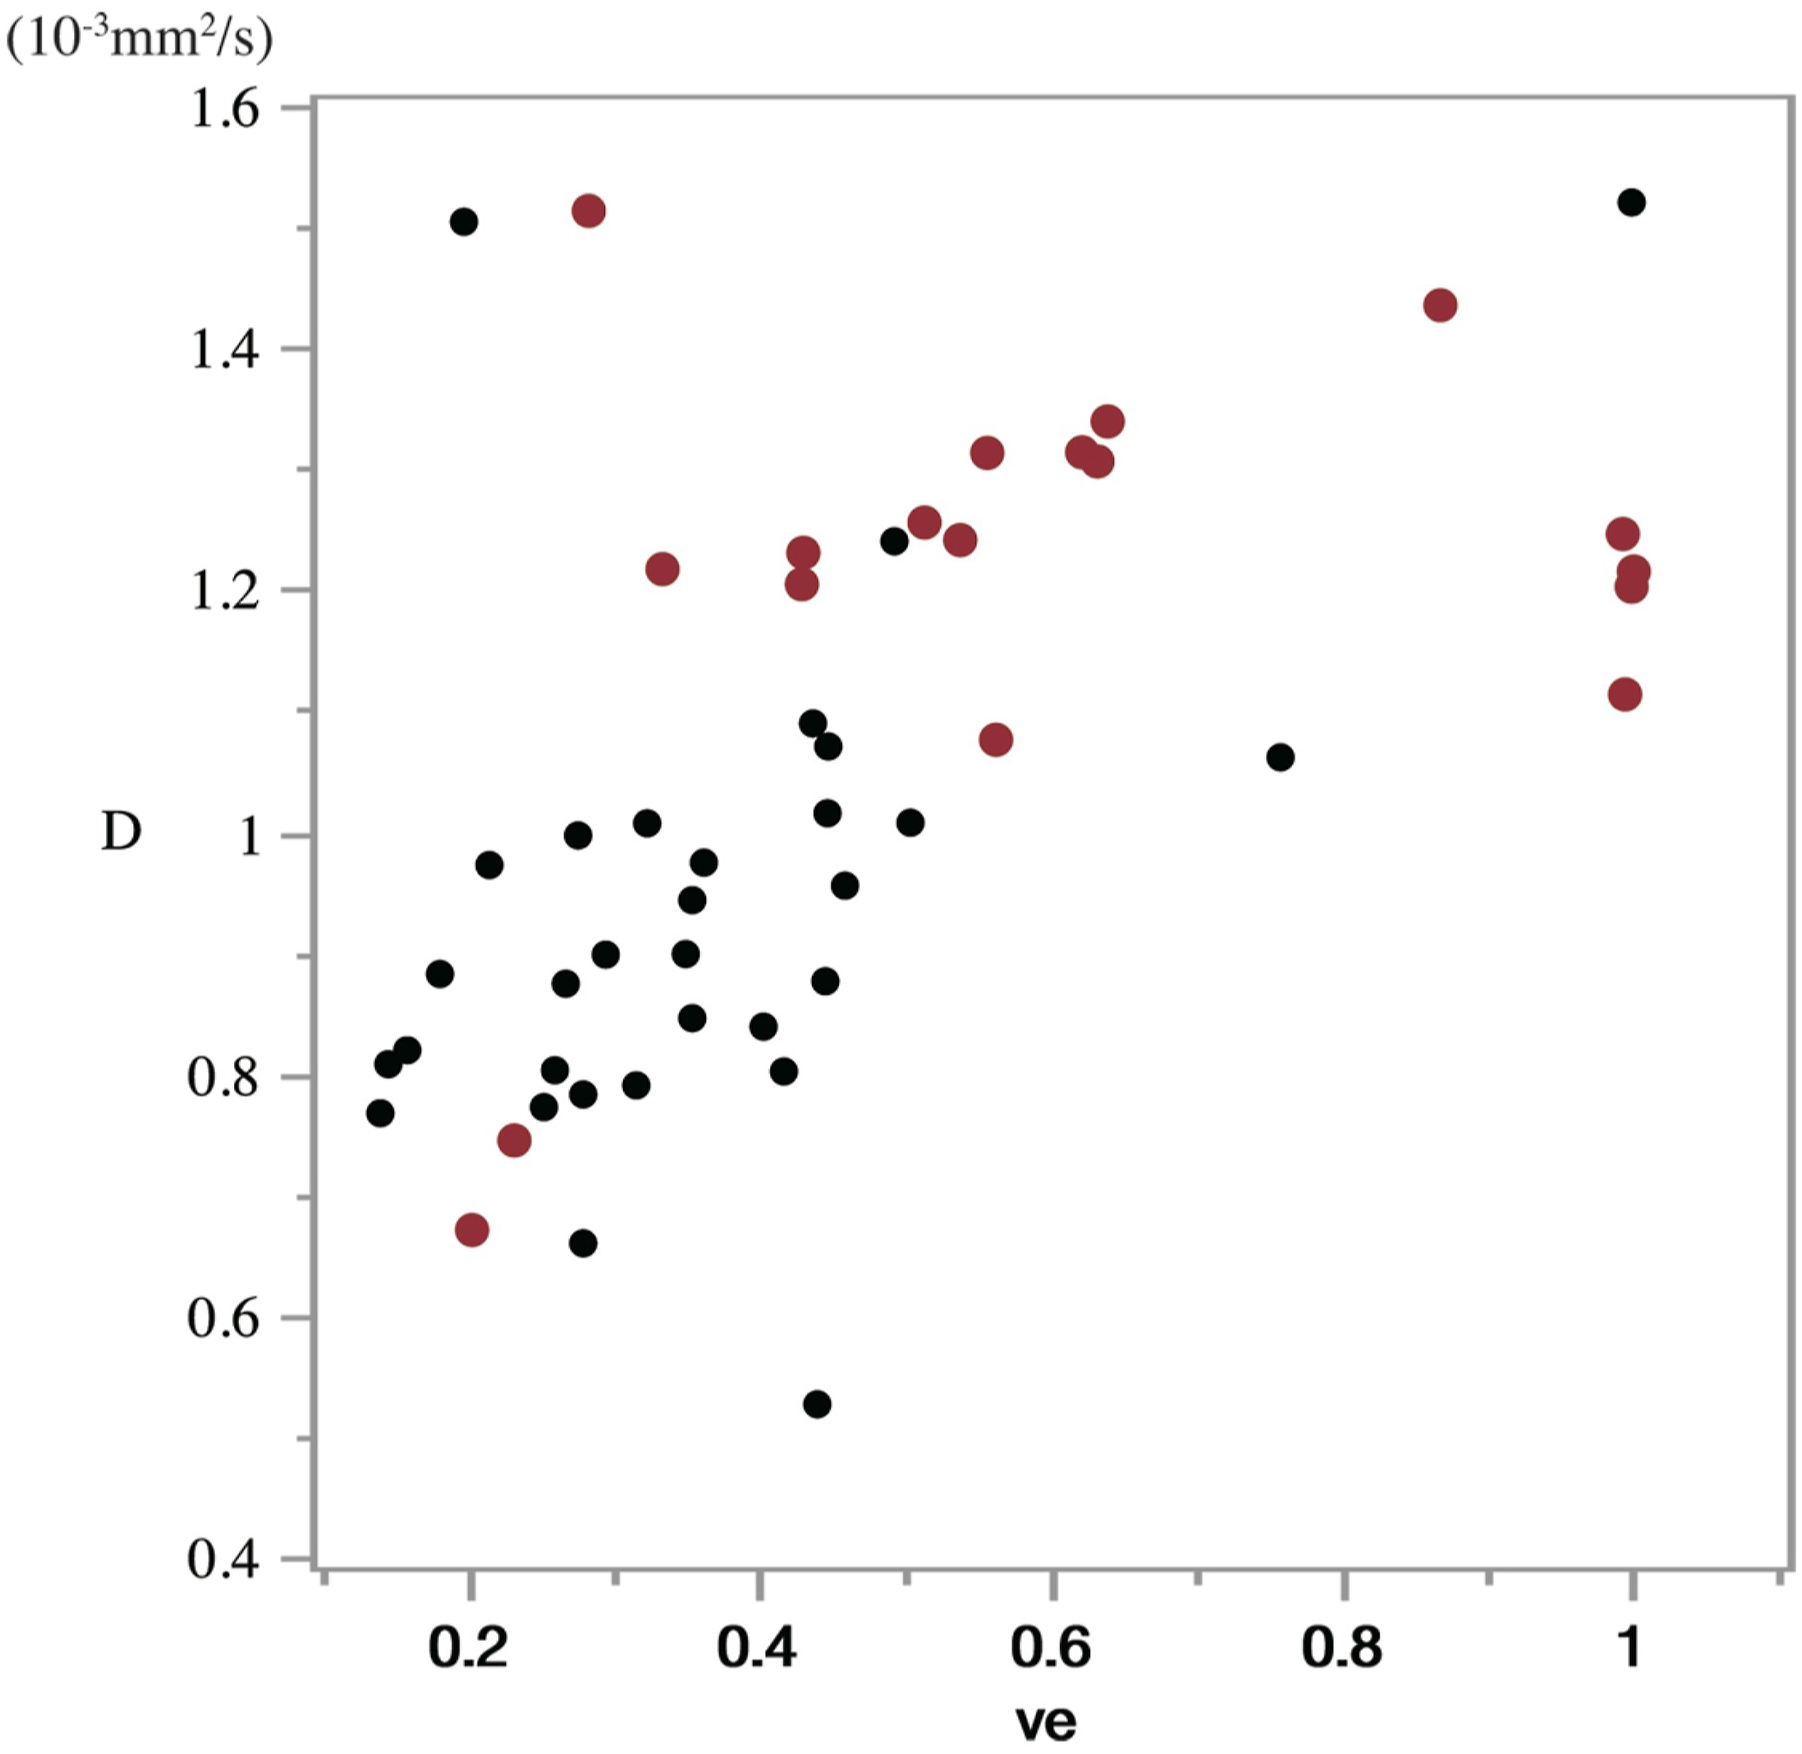

Comparisons of the parameters between benign and malignant lesions
A comparison of the parameters between benign and malignant entities.

ADC, apparent diffusion coefficient; D, true diffusion coefficient; D*, pseudo diffusion coefficient; f, perfusion fraction; T0, time of arrival; TTP, time to peak; MAXRELENH, maximum relative enhancement; WASHIN, wash-in rate; Ktrans, the influx forward volume transfer constant into the EES from the plasma; ve, the fractional volume of EES; vp, the fractional volume of plasma.
Diagnostic performance (AUC) in discriminating benign lesions from malignant lesions.

AUC, area under the curve; ADC, apparent diffusion coefficient; TTP, time to peak; ve, the fractional volume of EES; CI, confidence interval.
Discussion
The present study evaluated the correlations between DWI- and DCE-MRI-derived parameters. First, we evaluated the correlation between T1 perfusion-derived parameters and TK model-derived parameters (Table 1). Immediately after the arrival of the CA, the CA predominantly exists in the intravascular space; however, it leaks into the EES as time passes. Therefore, the negative correlation of the TTP with both Ktrans and vp and its positive correlation with ve is considered reasonable. MAXRELENH showed not only a positive correlation with perfusion-related TK model parameters (Ktrans and vp) but also a correlation with ve. WASHIN showed a significant positive correlation with both Ktrans and vp but a weak negative correlation with ve, and this trend was opposite to that of TTP.
T1 perfusion-derived parameters, except MAXRELENH, were less related to DWI-derived parameters. It was thus very difficult to link the DWI-derived parameters to T1 perfusion-derived parameters that did not directly reflect the underlying physiological condition. These results were in line with those of previous reports.21,22 In contrast, the pharmacokinetic analysis revealed several correlations with DWI-derived parameters. An increase in ve increased the ADC. White demonstrated that the ADC values were inversely correlated with tumour cellularity, showing a Pearson’s correlation coefficient of 0.556. Their study included 24 lesions of the nasal cavity and the paranasal sinuses. 9 Driessen et al. separated digitized haematoxylin-eosin-stained sections of laryngeal and hypopharyngeal carcinoma into nuclei, cytoplasm and stroma using colour-based segmentation. The percentage of stroma area was correlated with the ADC, while the percentage of nuclei area was inversely correlated with the ADC (Spearman’s correlation coefficient = 0.69 and −0.64, respectively). 8 These results were in line with our own findings (Table 3).
In the present study, D also had a significant moderate positive correlation with ve. This result is compatible with the previous report by Li et al., who demonstrated the close negative correlation between the D value and the tumour-to stroma ratio in patients with early cervical carcinoma. 29
Several studies have shown that IVIM perfusion-related parameters correlate with perfusion-related parameters obtained by dynamic susceptibility contrast MRI for the evaluation of cerebral perfusion,30,31 where the leakage of CA into the EES can be considered negligible. However, such leakage cannot be discounted for the evaluation of tumorous lesions. Our research showed that Ktrans had a significant weak positive correlation with f. Most previous research has also failed to demonstrate any strong, straightforward correlation.21–24,32
In a physiological sense, Ktrans reflects the tissue blood flow if tissue perfusion is low relative to the permeability surface area product (PSAP) and conversely will reflect permeability if tissue perfusion is high relative to the PSAP;19,32 therefore, we considered that a weak correlation seems to be reasonable.
Unexpectedly, we noted no significant positive correlation between vp and IVIM perfusion-related parameters. However, this is consistent with the findings of previous reports.24,25,32 The signal intensity from all vessels was included in the DCE-MRI analysis, whereas the IVIM analysis assumed that the perfusion-related parameters were estimated from the signal intensity of the capillaries.13–15 Such conceptual differences might have resulted in the lack of a significant correlation between these parameters.
Both ADC and D were also useful for differentiating benign and malignant lesions, and they were correlated with ve. These findings were in line with much previous research. In general, many studies have reported that the Ktrans and f values of malignant lesions are larger than those of benign lesions; however, there was no significant difference between them, which is probably due to the wide variation in benign lesions. In the present study, we found no improvement in diagnostic ability by combining DWI and DCE-MRI. However, if we focus on diseases of specific organs such as the parotid gland, thyroid gland, 33 paranasal sinus34,35 and so on, we believe that there might be a possibility of improving diagnostic performance by combining them.
Several limitations associated with the present study warrant mention. First, the ROIs of the DWI-derived parameter map were not identical to those of the DCE-MRI-derived map. The slice thickness of 3-dimensional DCE-MRI was 6 mm, whereas that of multislice TSE-DWI was 5 mm with a 1-mm slice gap. This issue might have reduced the correlation between the parameters obtained by the two sequences. Second, cases with severe movement were excluded from the study population; however, the unrecognized artifacts might have influenced the parameters. Third, the lack of standardization for the quantification might have affected the quantification. The TK model used in the DCE-MRI analysis was technically challenging and carried a risk of being confounded by many factors. Fourth, we used TSE-DWI with six b values due to the extended acquisition time; however, the selection of the b values influences the IVIM parameters. In addition, the long acquisition time and complex signal acquisition method associated with TSE-DWI might have influenced the DWI perfusion-related parameters.27,28 However, the optimization of TSE-DWI is beyond the scope of this preliminary study.
In conclusion, both D and ve were reliable parameters that were useful for the differential diagnosis; in addition, there was a significant positive correlation between them. Conversely, IVIM perfusion-related parameters and TK model perfusion-related parameters were not straightforward.
Supplemental Material
Supplemental Material - Correlation between diffusion-weighted image-derived parameters and dynamic contrast-enhanced magnetic resonance imaging-derived parameters in the orofacial region
Supplemental Material for Correlation between diffusion-weighted image-derived parameters and dynamic contrast-enhanced magnetic resonance imaging-derived parameters in the orofacial region by Toru Chikui, Masahiro Ohga, Yukiko Kami, Osamu Togao, Shintaro Kawano, Tamotsu Kiyoshima and Kazunori Yoshiura in Acta Radiologica Open.
Footnotes
Acknowledgements
We used a software program (PRIDE software, Philips) using the interface data language (IDL, RSL).
Declaration of conflicting interests
The author(s) declared the following potential conflicts of interest with respect to the research, authorship, and/or publication of this article: We used a software program (PRIDE software, Philips) using the interface data language (IDL, RSL), which was proprietary software program and has been developed as collaborative research between Philips and Kyushu University. At present, the software program for commercial use has been marketed. Therefore, we were allowed to use PRIDE software without any contrast with Philips. We have got the agreement on it from Philips Healthcare.
Funding
The author(s) disclosed receipt of the following financial support for the research, authorship, and/or publication of this article: This study was supported by a Ministry of Education, Culture, Sports, Science and Technology Grant-in-Aid for Scientific Research (C) 18K09770.
Declaration of generative AI in scientific writing
We declare that we did not use any generative AI or AI-assisted technologies in the writing process.
Supplemental Material
Supplemental material for this article is available online.
References
Supplementary Material
Please find the following supplemental material available below.
For Open Access articles published under a Creative Commons License, all supplemental material carries the same license as the article it is associated with.
For non-Open Access articles published, all supplemental material carries a non-exclusive license, and permission requests for re-use of supplemental material or any part of supplemental material shall be sent directly to the copyright owner as specified in the copyright notice associated with the article.