
Abstract
Background
Low-dose CT (LDCT) chest protocols have widespread clinical applications for many indications; as a result, there is a need for protocol assessment prior to standardization. Dalhousie University and Oslo Metropolitan University have a formally established cooperative relationship.
Purpose
The purpose is to assess radiation dose and image quality for LDCT chest protocols in seven different hospital locations in Norway and Canada.
Material and methods
Retrospective dosimetry data, volumetric CT dose index (CTDIvol), and dose length product (DLP) from 240 average-sized patients as well as CT protocol parameters were included in the survey. Effective dose (ED) and size-specific dose estimate (SSDE) were calculated for each examination. For a quantitative image quality analysis, noise, CT number, and signal-to-noise ratio (SNR) were determined for three regions in the chest. The contrast-to-noise ratio (CNR) was calculated for lung parenchyma in comparison to the subcutaneous fat. Differences in dose and image quality were evaluated by a single-factor ANOVA test. A two-sample t-test was performed to determine differences in means between individual scanners.
Results
The ANOVA test revealed significant differences (p < .05) in dose values for all scanners, including identical scanner models. Statistically significant differences (p < .05) were determined in mean values of the SNR distributions between the scanners in all three measured regions in the chest, as well as the CNR values.
Conclusion
The observed variations in dose and image quality measurements, even within the same hospitals and between identical scanner models, indicate a potential for protocol optimization in the involved hospitals in both countries.
Introduction
Since its introduction, computed tomography (CT) has become the primary diagnostic imaging modality, offering high-precision images for the detection and monitoring of diseases. 1 Its widespread use and accessibility also make CT the most significant contributor of medical radiation to the general public.1,2 Ionizing radiation, even at small doses, is associated with an increased risk of radiation-induced cancers. 3 Any CT exam performed is considered an intentional dose associated with potential harm, and their use must adhere to the principle of keeping radiation risk as low as reasonably achievable (ALARA) and have benefits that outweigh any risks associated with radiation exposure. 4
Techniques, such as Automatic Tube Current Modulation (ATCM), Automatic Tube Voltage Selection (ATVS), and Iterative Reconstruction (IR) algorithms, have been important in reducing radiation exposure while maintaining high-quality diagnostic images.5–7 ATCM and ATVS allow for radiation exposure to be tailored to patient size. 8 Newer generations of IR algorithms, such as hybrid-statistical IR (H/SIR) and model-based iterative reconstruction (MBIR), can selectively reduce image noise even at lower radiation doses and are more effective than the traditional filtered back-projection (FBP) method. 9
Another way of lowering radiation dose is with low-dose CT (LDCT) acquisition techniques. Acquisition parameters are adjusted to reduce dose levels to a fraction of a standard-dose CT (SDCT) protocol, while still preserving high image quality with the use of IR for denoising and artifact reduction. 5 CT provides exceptional visualization of the high-contrast structures of the lungs, making LDCT an invaluable tool in diagnosing lung pathology and the modality of choice for lung cancer screening (LCS). 10 Common indications for LDCT chest protocols include metastases, lung nodules, focal lung pathology, and evaluation and monitoring of chronic lung diseases like emphysema and cystic fibrosis. 11 In some institutions, LDCT has become the preferred protocol for routine chest examinations, rather than SDCT.
There is, however, a lack of standardization when clearly defining the difference between SDCT and LDCT for chest examinations. 12 While there are guidelines with recommended doses for LDCT chest protocols in LCS, there are currently no diagnostic reference levels (DRLs) for LDCT chest protocols.10,13 There is also a lack of clinical consensus for what constitutes an “acceptable” level of noise in LDCT imaging of the lungs.9,14 Considering the volume of CT scans performed, creating and optimizing LDCT protocols for frequently performed CT chest examinations would be beneficial in further reducing patient radiation doses, particularly in LCS.10,15
Data were collected in Norway and Canada due to the similarities of their healthcare systems. This study aims to assess non-contrast LDCT protocols of CT scanners routinely used in clinical settings in Norway and Canada and examine the impact of the scanners and protocols on patient dose and image quality. The aim is to provide data that can inform protocol optimization and dose reduction in the clinic.
Material and methods
Ethical considerations
Dalhousie University and Oslo Metropolitan University have a formally established cooperative relationship including both academic and research activities. This memorandum of understanding has been in place since 2016. In both involved countries, the study was qualified and approved as a quality improvement initiative by the Research Ethics Board (REB) review in Canada and the Patient Protection Office in Norway. No sensitive patient data was recorded in the study, nor was there any exchange of patient data between the involved countries and institutions.
Patient population
Data from LDCT chest exams were collected retrospectively from seven hospitals in Norway and Canada. The study included average-sized adults, defined by an anterior-posterior (AP) thickness of 25 ± 5 cm at the level of the tracheal bifurcation. 16 As this is a retrospective study, and neither weight nor height was recorded for chest examinations at any hospital sites, body mass index (BMI) and patient weight were not considered as inclusion criteria. Patients with medical complications and medical equipment in the scan field-of-view (SFOV) were not included in the data sampling, as it prevented accurate measurement of the Hounsfield unit (HU) in the regions of interest (ROI). Patients scanned with arms in the SFOV leading to image quality reduction and out-of-field artifacts in the scan as well as examinations demonstrating excessive motion or metal artifacts were also excluded.
Dose and image quality data from 240 CT examinations (20 exams per scanner) meeting the inclusion criteria were included in the study, 140 from Norway and 100 from Canada. Most of the scans were performed between 2022 and 2023. Due to insufficient eligible data, two of the 12 scanners included examinations dating back to 2021.
Computed tomography scanners
Characteristics of the CT scanners included in the survey.

aNotation of the detector configuration: the number of active detector rows x the detector element thickness.
Superscript DL indicates a dual-layer detector solution, superscript GSI indicates a gemstone spectral imaging system, and superscript DS indicates a dual-source system.
Acquisition parameters for each scanner.

aDose right index.
bNoise index.
Image quality assessment
Image quality data were collected from reconstructed axial lung series. For each exam, the mean and standard deviation (SD) of CT numbers were measured in three different ROIs: the tracheal bifurcation, peripheral lung parenchyma, and subcutaneous fat. All measurements were taken on the patients’ right side at the level of the tracheal bifurcation (Figure 1). The noise in each region was approximated by measured SD, and the signal-to-noise ratio (SNR) was calculated for each ROI as the mean CT number divided by SD.
17
The contrast-to-noise ratio (CNR) for lung parenchyma in comparison to the subcutaneous fat was calculated as the absolute value of the difference of mean CT numbers measured in lung and fat divided by the SD of the ROI of fat.
17
Placement of ROIs for quantitative analysis: the tracheal bifurcation (a), peripheral lung tissue (b), and subcutaneous fat (c).
Data analysis
Data were collected from the picture archiving and communication system (PACS). The following PACS solutions were employed in Norway and Canada respectively: Carestream Vue PACS version 12.2.20.105 (Philips Healthcare, Best, Netherlands) and Agfa Impax, version 6.6.1.6014 (Agfa HealthCare, Mortsel, Belgium). Volumetric CT dose index (CTDIvol) and dose length product (DLP) were collected from each examination. Size-specific dose estimates (SSDEs) were calculated for each exam based on the recorded CTDIvol values and the corresponding AP chest thickness conversion coefficient.16,18 The effective dose (ED) for each exam was estimated by multiplying the DLP with the conversion factor for the chest (k = 0.014 mSv·mGy−1 cm−1). 19
Descriptive statistical analyses were performed using Microsoft Excel 2020, version 16.72 (Microsoft Corporation, Redmond, WA, USA). A one-way ANOVA test was performed using Excel for all 12 scanners on the collected and calculated dosimetry parameters. ANOVA tests of the SNR and CNR were performed separately for each country. A two-sample t-test was performed for a comparison of CTDIvol on all 12 scanners. Due to differences in image noise level and noise structure acceptable by the facility radiologists, similar t-tests were performed separately for each country for a comparison of SNR and CNR values. A value of p < .05 indicated a statistically significant difference between the mean values of the scanners.
Results
Evaluation of patient dose and quantitative image quality. The mean values are shown with standard deviation.

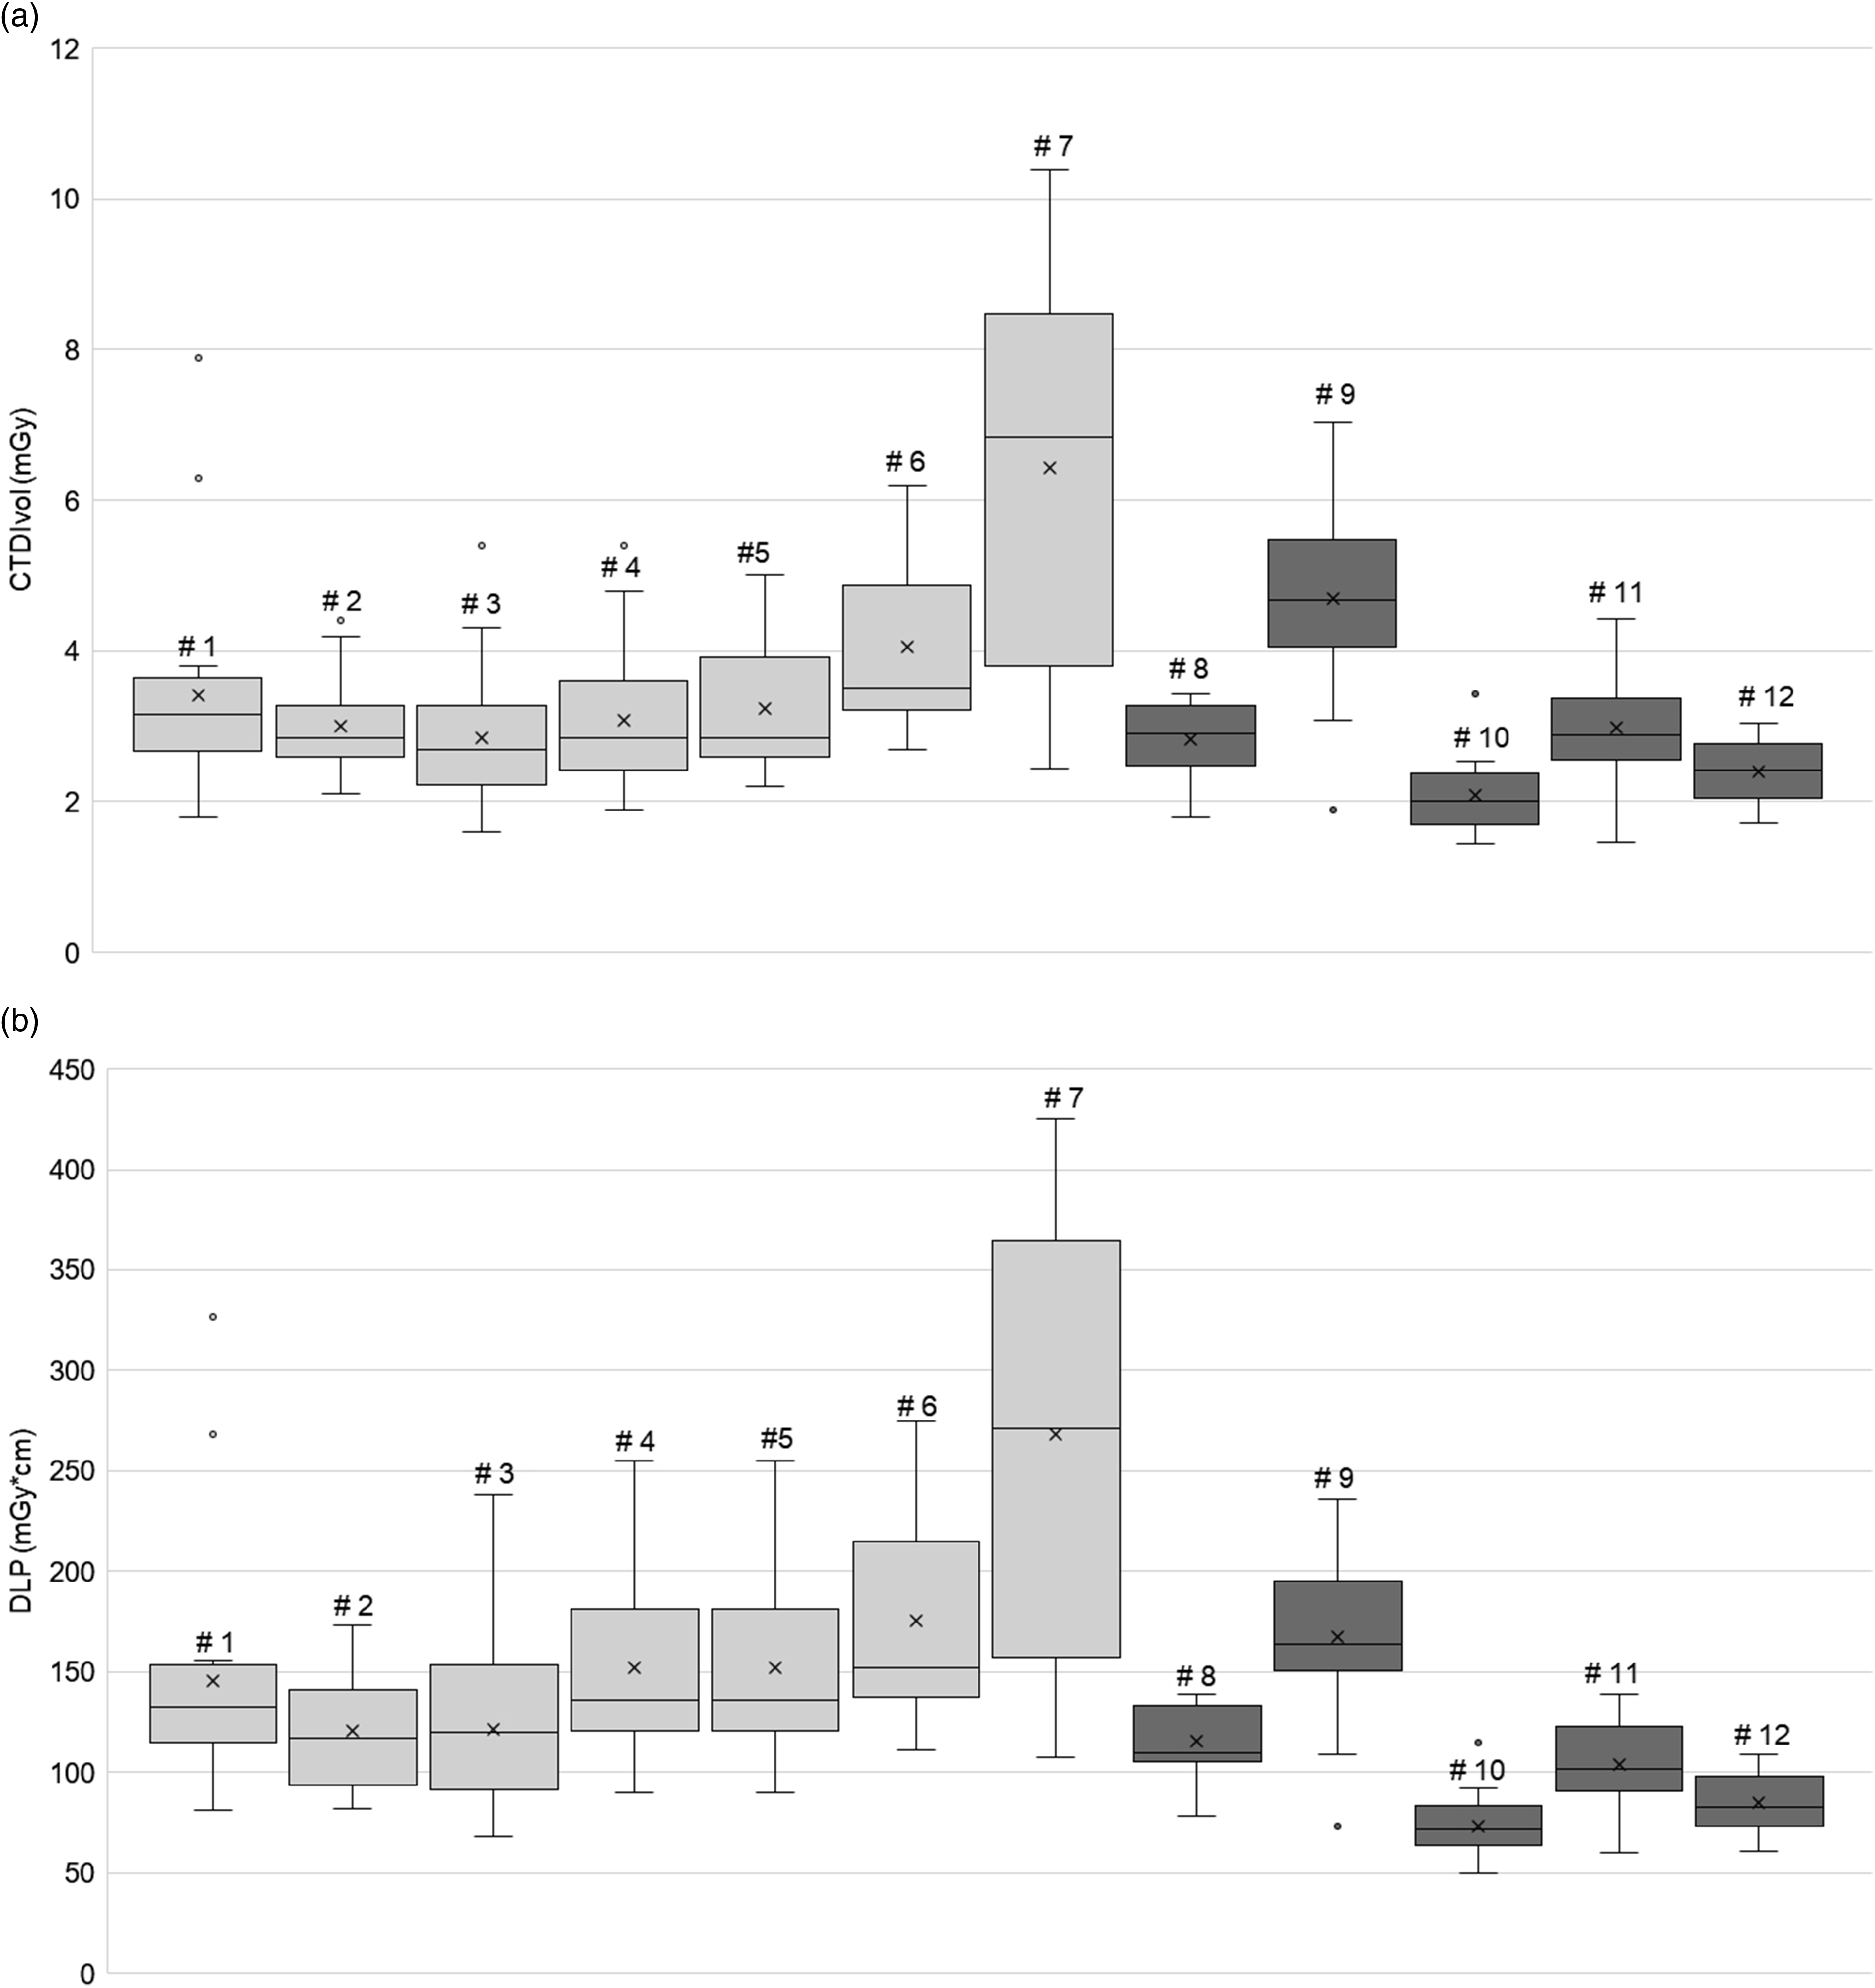
Box-whisker plots of the CTDIvol (a) and DLP (b) values representing all individual scanners. Each box demonstrates the minimum, first quartile, median, third quartile, and maximum values. The central box represents 50% of the data distribution. The data outside the central box represents 25% of the data on each end of the distribution, for a total of 50%. The whiskers represent the range between the minimum and maximum values from each scanner. The mean is indicated by the cross in the middle of the box, and the median is represented by the lines in each box. Outliers in the dataset are shown by dots outside the box-whisker plots.
The ANOVA test revealed significant differences in CTDIvol, DLP, ED, and SSDE values between all scanners (p < .05). The two-sample t-test demonstrated that the differences in CTDIvol for scanners #7 and #10 were statistically significant when compared with the 11 other scanners. Significant differences were also identified between the mean CTDIvol values obtained from two identical scanner models (scanner #3 and #6) with the same protocol but located at different hospitals. Additionally, scanner #9 had a significantly higher mean CTDIvol value than the other Siemens scanners in the study.
The results of the descriptive statistical analysis performed on the image quality measurements, mean CT numbers and noise in each anatomic region, are presented in Table 3, demonstrating higher (approximately factor of 10) noise level measured on Canadian scanners for all ROIs. The highest median SNR value in the trachea was produced by scanner #6 (Figure 3(a)), and scanner #3 had the highest median SNR value in the lung parenchyma and subcutaneous fat (Figure 3(b) and (c)), while scanner #8 produced the lowest median SNR values in all ROIs (Figure 3(a)–(c)). The ANOVA test revealed statistically significant differences in mean SNR values between the seven scanners in Norway, and between the five scanners in Canada in all three regions of the chest. The results of the two-sample t-test indicated that scanner #7 produced significantly lower SNR values in all three ROIs when compared to the other six scanners in Norway. In Canada, scanner #8 produced significantly lower SNR values in all three ROIs when compared to the other four scanners. Additionally, a comparison of the two identical scanners, #3 and #6, revealed a significant difference in the trachea (p = .039) and lung parenchyma (p = .022), but not in subcutaneous fat (p = .697). Box-whisker plots demonstrating the distribution of calculated signal-to-noise (SNR) values in different regions in the chest: trachea (a), lung parenchyma (b), and subcutaneous fat (c).
Similarly, the ANOVA test demonstrated statistically significant differences in the CNR values between the seven scanners in Norway, and between the five scanners in Canada with the highest median CNR determined on scanner #3 and the lowest value on scanner #8, as shown in Figure 4(a) and (b). The two-sample t-test results determined a significantly lower mean CNR from scanner #7 when compared to the other Norwegian scanners. However, the CNR values obtained from the identical scanners #3 and #6 were not significantly different (p = .249). In Canada, scanner #8 demonstrated a significantly lower mean CNR when compared to the other four scanners. Box-whisker plots demonstrating the distribution of the contrast-to-noise ratio (CNR) values for lung parenchyma in comparison to the subcutaneous fat calculated for all scanners.
Discussion
This study assessed non-contrast enhanced LDCT chest protocols utilized by 12 different CT scanners in Norway and Canada and evaluated the impact on patient dose and image quality. Results demonstrated a significant variation in dose indicators among individual scanners. The study also found significant variation in SNR and CNR values between the scanners in Norway and Canada. These findings indicate that many of the scanners may benefit from protocol optimization and dose reduction efforts.
There are currently no DRL guidelines for diagnostic LDCT chest.10,20 In contrast, the American Association of Physicists in Medicine (AAPM) has published a guideline for LDCT chest for the purpose of LCS. 21 For screening of average-sized adult patients (70–90 kg or BMI ≈24) with LDCT, the AAPM recommends CTDIvol of ≤3 mGy 2 21 with appropriate reduction or increase in CTDIvol for smaller or larger-size patients. In the present study, most of the scanners were within the recommended dose from AAPM except for scanners #7 and #9.
The study revealed that identical scanner models also showed variations in dose contributions and image quality. In particular, scanners #3 and #6 show significant differences in mean CTDIvol and SNR values, despite having the same acquisition parameters (Tables 1 and 2). Although they have the same installation year, scanner #3 has the latest software compared to scanner #6. In addition, these scanners are located at different hospitals so scan techniques might differ. Similar findings have been reported by other researchers.22,23 Suntharalingam et al. 24 found that minor differences in patient positioning, scan length, table height, and z-axis scan range could result in great variation in radiation doses for the follow-up examinations of the same patients, even for the same CT scanner running an identical protocol in combination with AEC. Similarly, a phantom study by Marsh et al. 25 demonstrated that patient positioning and table height in the CT gantry can significantly affect estimates of patient size, AEC parameters, and calculated SSDE.
Scanner #10 was the lowest dose contributor of the scanners included in this study (Table 3). Of the Siemens scanners included in the study, only scanners #10 and #11 use fixed kilovoltage (kV) of 100 (Table 2). ATVS technique allows for kV selection based on patient size and body habitus obtained from the topogram and it is associated with dose reduction when compared to fixed kV. 26 However, in this study, this was not the case. This discrepancy may be attributed to the Care kV of the Siemens scanners, which may allow for scanning at higher than the 100 kV used for the fixed voltages. A study by Spearman et al. 27 also found that while ATVS leads to a considerable reduction in dose for most examinations, there are some exceptions, such as unenhanced SDCT chest examinations, where no significant reduction in CTDIvol was observed.
The significant variation in SNR and CNR values observed between the scanners in Norway and Canada may be explained by several complex factors, such as type of IR algorithm, reconstructed slice thickness, and acquisition parameters (Tables 1 and 2). Guleng et al. 28 found that each vendor algorithm exhibits different noise reduction properties and that this must be taken into consideration when comparing the image quality performance of different algorithms. Consequently, all the Philips scanners (# 1–6) used in the present study showed lower noise and higher SNR and CNR values compared to the rest. This is because the Philips scanners utilized a MBIR algorithm (IMR), which has a higher noise reduction potential than H/SIR (ASiR-V and Safire). Yuki et al. 29 showed that IMR demonstrated a higher efficacy in terms of noise reduction in chest CT examination when compared to FBP and H/SIR algorithms, even at low doses and thinner reconstructed slice thicknesses.
It was previously reported in the literature that IR algorithms from different vendors demonstrated not only different noise reduction properties but also variations in the noise power spectrum affecting the visual appearance of noise in the image.28,30,31 As a result, different facilities may adjust the strength of the implemented IR that is sufficient for certain clinical tasks, which may affect quantitative image quality analysis expressed by the SNR and CNR values. None of the included in the survey scanners employed the newer deep-learning reconstruction techniques that were shown to allow for noise reduction without “plastic” or “blotchy noise texture.” 32
There were several other limitations in this study. While a sample size of 20 patients was deemed adequate for this study, a higher number of examinations would have been beneficial for the statistical analysis. The lack of recording patient weight and height for LDCT chest examinations also posed a limitation, as it made it impossible to calculate a BMI. This holds significance since the radiation dose can be influenced by patients’ body habitus when utilizing AEC. The lack of recorded scan length and mean kV for the scanners utilizing Care kV also placed limitations on the dose and image quality analyses. Information about scan length would have been helpful in determining the effect of overscanning on dose impact, and shed light on how varying clinical practices affect overall dose levels. Additionally, information about mean kV would be beneficial in determining if the higher kV selection by the ATVS algorithms could explain some of the observed variations. A qualitative evaluation of image quality would also have added valuable information, however all the images included in this retrospective study were already evaluated by radiologists and were deemed clinically acceptable. In conclusion, the results of this study revealed a significant variation in dose contributions, not only between scanner models from the same vendor but also between identical scanners from different institutions. There was a significant difference in mean SNR and CNR values, both within and between countries. These differences demonstrate the need for standardization of LDCT chest examinations. Lastly, there is a necessity for enhanced training of radiographers regarding the impact of various scanning parameters on radiation dose and image quality. This includes patient positioning and scan length. By raising awareness about these significant factors, radiographers can optimize both the radiation dose delivered to patients and image quality in their daily clinical practice.
Footnotes
Author contributions
Author name: Elena Tonkopi, substantial contribution: designed and supervised the project, drafting: drafted the final manuscript, final approvement: yes, and agreement to be accountable: yes. Author name: Mercy Afadzi Tetteh, substantial contribution: designed and supervised the project, drafting: critically revised the manuscript, final approvement: yes, and agreement to be accountable: yes. Author name: Catherine Gunn, substantial contribution: designed and supervised the project, drafting: critically revised the manuscript, final approvement: yes, and agreement to be accountable: yes. Author name: Haseem Ashraf, substantial contribution: designed and supervised the project, drafting: critically revised the manuscript, final approvement: yes, and agreement to be accountable: yes. Author name: Sigrid Lia Rusten, substantial contribution: designed and supervised the project, drafting: drafted the article, final approvement: yes, and agreement to be accountable: yes. Author name: Perkhah Safi, substantial contribution: designed and supervised the project, drafting: drafted the article, final approvement: yes, and agreement to be accountable: yes. Author name: Nora Suu Tinsoe, substantial contribution: designed and supervised the project, drafting: drafted the article, final approvement: yes, and agreement to be accountable: yes. Author name: Kylie Colford, substantial contribution: designed and supervised the project, drafting: drafted the article, final approvement: yes, and agreement to be accountable: yes. Author name: Olivia Ouellet, substantial contribution: designed and supervised the project, drafting: drafted the article, final approvement: yes, and agreement to be accountable: yes. Author name: Salma Naimi, substantial contribution: designed and supervised the project, final approvement: yes, and agreement to be accountable: yes. Author name: Safora Johansen, substantial contribution: designed and supervised the project, drafting: critically revised the manuscript, final approvement: yes, and agreement to be accountable: yes.
Declaration of conflicting interests
The author(s) declared no potential conflicts of interest with respect to the research, authorship, and/or publication of this article.
Funding
The author(s) received no financial support for the research, authorship, and/or publication of this article.