
Abstract
Background
Risk factors are traits or behaviors that have an influence on the development of breast cancer (BC). Awareness of the prevalent risk factors can guide in developing prevention interventions.
Purpose
To evaluate the correlation between the breast density, body mass index, and the risk of breast cancer development in relation to the menopausal status in a native African-Arab population.
Material and methods
The study included 30,443 screened females who were classified into cancer and non-cancer groups and each group was further sub-classified into pre- and postmenopausal groups. The breast density (BD) was reported and subjectively classified according to the 2013 ACR BI-RADS breast density classification. The weight and height were measured, and the body mass index (BMI) was calculated and classified according to the WHO BMI classification.
Results
A statistically significant difference was calculated between the mean BMI in the cancer and non-cancer groups (p: .027) as well as between the pre- and postmenopausal groups (p < .001). A positive statistically insignificant correlation was calculated between the breast density and the risk of breast cancer in the premenopausal group (OR: 1.062, p: .919) and a negative highly significant correlation was calculated in the postmenopausal group (OR: 0.234, p < .001).
Conclusion
BMI and BD are inversely associated with each other. The current studied population presented unique ethnic characteristics, where a decreased BD and an increased BMI were found to be independent risk factors for developing breast cancer.
Introduction
Despite the recent advances in the detection and management of breast cancer (BC), the incidence rate is rising. 1 This means that there is a great need to find alternative ways to reduce BC. This might be achieved through applying prevention protocols and through confronting some risk factors (RFs). 2
RFs are traits or behaviors that have an influence on the development of BC and they can make some individuals more susceptible. The RFs for developing BC are comparable across all regions of the world. However, their prevalence and their genuine impact can vary remarkably from one region to the other. Awareness of the prevalent RFs can guide in developing prevention interventions. Many women may have multiple risk factors; some of which are confounders and some of which are synergistic. Increased body mass (BMI) index and breast density (BD) are two of the most prevalent RFs for breast cancer although they are inversely related.3–5
An increased BMI is considered an important modifiable risk factor for the development of BC. There is no comprehensive universal agreement on the relationship between BMI and BC.6–8 The results of the observational studies that have examined the correlation between the BMI and BC are contradictory. Some researchers believe that an increased BMI may increase the risk of BC development in the pre- and postmenopausal periods9–11 whereas others assert that an increased BMI may reduce the risk of BC during premenopausal period and increases it in the postmenopausal period.12–14 Other researchers have suggested that the geographical site or some genetic factors may influence the relationship between BMI and BC.15,16
BD refers to the amount of epithelial and connective tissue stromal tissue elements compared with the amount of adipose tissue within the breast. 17 According to published literature, increased BD is considered an independent RF for BC18,19 In addition to its impact on breast cancer risk, BD reduces the accuracy of mammography resulting in an increased number of interval BC. 17
Most published literature assess the impact of BD and BMI on the development of BC individually, yet only a few investigators have focused on how these inversely related RFs interact and whether this interaction is affected by the woman’s menopausal status or not.20–22 The majority of these studies have been carried among white women or among American African population. To our knowledge, no similar studies have been performed on any native African or Arab female population. In both the Arab and African female population, BC exhibits unique epidemiological features which differ from those described in Western countries. The median age at presentation is one decade younger than in Europe and North America and the patients are mainly premenopausal. Tumors are comparatively advanced at presentation. However, these unique features have not been thoroughly investigated raising concerns about the impact of exposure to the different RFs.23,24
In this work, we studied the complex relationship between the BMI and BD as RFs for developing BC in relation to the menopausal status in a native African-Arab screened female population.
Material and methods
This retrospective analytical case-control study included 30, 433 asymptomatic Egyptian women who underwent routine screening mammography at the Egyptian National Breast Cancer Screening Program: “The Women’s Health Outreach Program” during the study period. Women with symptomatic breast cancer or beyond the legible age for screening (40 years) were excluded as they were exempted from the screening program.
The epidemiologic data were obtained on the same visit of the screening mammogram by a face-to-face interview of the participants with the administration staff and the technologists. Epidemiologic data included the participants’ age, residence, phone number, age at menarche, age at menopause, parity, lactational history, history of hormonal intake, past history and family history of breast cancer. Based on the epidemiologic data, we stratified the participants according to their menopausal status into pre- and postmenopausal groups.
Anthropometric measurements were computed on the same visit of the mammography screening. The height (in cm) and weight (in kg) were measured by the technologist using a Stadiometer with a fixed scale. The BMI was then calculated (the weight divided by the height squared) and the participants were then classified according to the World Health Organization Classification of BMI.24,25 For statistical analysis, we grouped the BMI into normal/underweight (<25) and overweight/obese (≥25) subgroups.
Assessment of the breast density on mammograms was performed by two blinded readers with different experience levels. If the two readers gave discordant results, a third independent reader was brought in. BD was subjectively assessed by estimating the proportion of fibro glandular tissue in the breast, relative to fat. BD was classified using the American College of Radiology Breast Imaging Reporting and Data System (BI-RADS) Breast Density Classification (A: fatty, B: scattered density, C: heterogeneously dense, and D: extremely dense). 26 For statistical analysis, we grouped the BD into predominantly fatty (A and B) and predominantly dense (C and D) subgroups.
Collected data was fed to a comprehensive structured report and was exported to a statistical program (IBM, Statistical Package for Social Sciences (SPSS) software version 21.0, IBM Corp., Chicago, USA, 2013).
Descriptive statistics were done for quantitative parametric data as mean ± SD (standard deviation), and for qualitative data as number and percentage. Inferential analyses were performed for quantitative variables using independent t-test. For qualitative data, inferential analyses of independent variables were done using chi square test for differences between proportions. Correlations were evaluated using Pearson correlation for numerical parametric data. Tests for trend were performed to calculate odds ratio (OR) and 95% confidence interval (CI) as a measure of relative risk. Logistic regression model was then used to evaluate independent risk factors. The p-value is a statistical measure for the probability that the results observed in a study could have occurred by chance. The level of significance was considered as following: at p value < .050 is significant, p value < .010 is highly significant and p value ≥.050 is non-significant.
Results
The study included 30,443 screened females. According to the results obtained from the program’s registry 275/30,443 (0.9%) participants had pathologically proven BC (cancer group), while 30,168/30443 (99.1%) participants had normal or benign breast mammographic findings (non-cancer group). These women were re-classified into premenopausal (13, 857/30, 443, 45.5%) and postmenopausal (16, 586/30,443, 54.5%) groups.
The correlation between the BMI and the risk of BC development
Cross tab showing the number and percentage of the female participants in the two body mass index groups in both cancer and non-cancer groups as regards their menopausal status.

BMI: body mass index.
When considering the distribution of the BMI in the cancer and non-cancer groups considering their menopausal status, we found that 263/275 (95.7%) of the cancer group and 28,140/30,168 (93.3%) of the non-cancer group were overweight and obese.
An independent T-test was performed to compare the means of the BMI in the cancer and non-cancer groups as well as in the pre- and postmenopausal groups. The mean BMI was significantly higher in the cancer (p value: 0.027) and postmenopausal groups (p value: < .001).
The estimated risk of body mass index among the pre- and postmenopausal groups.


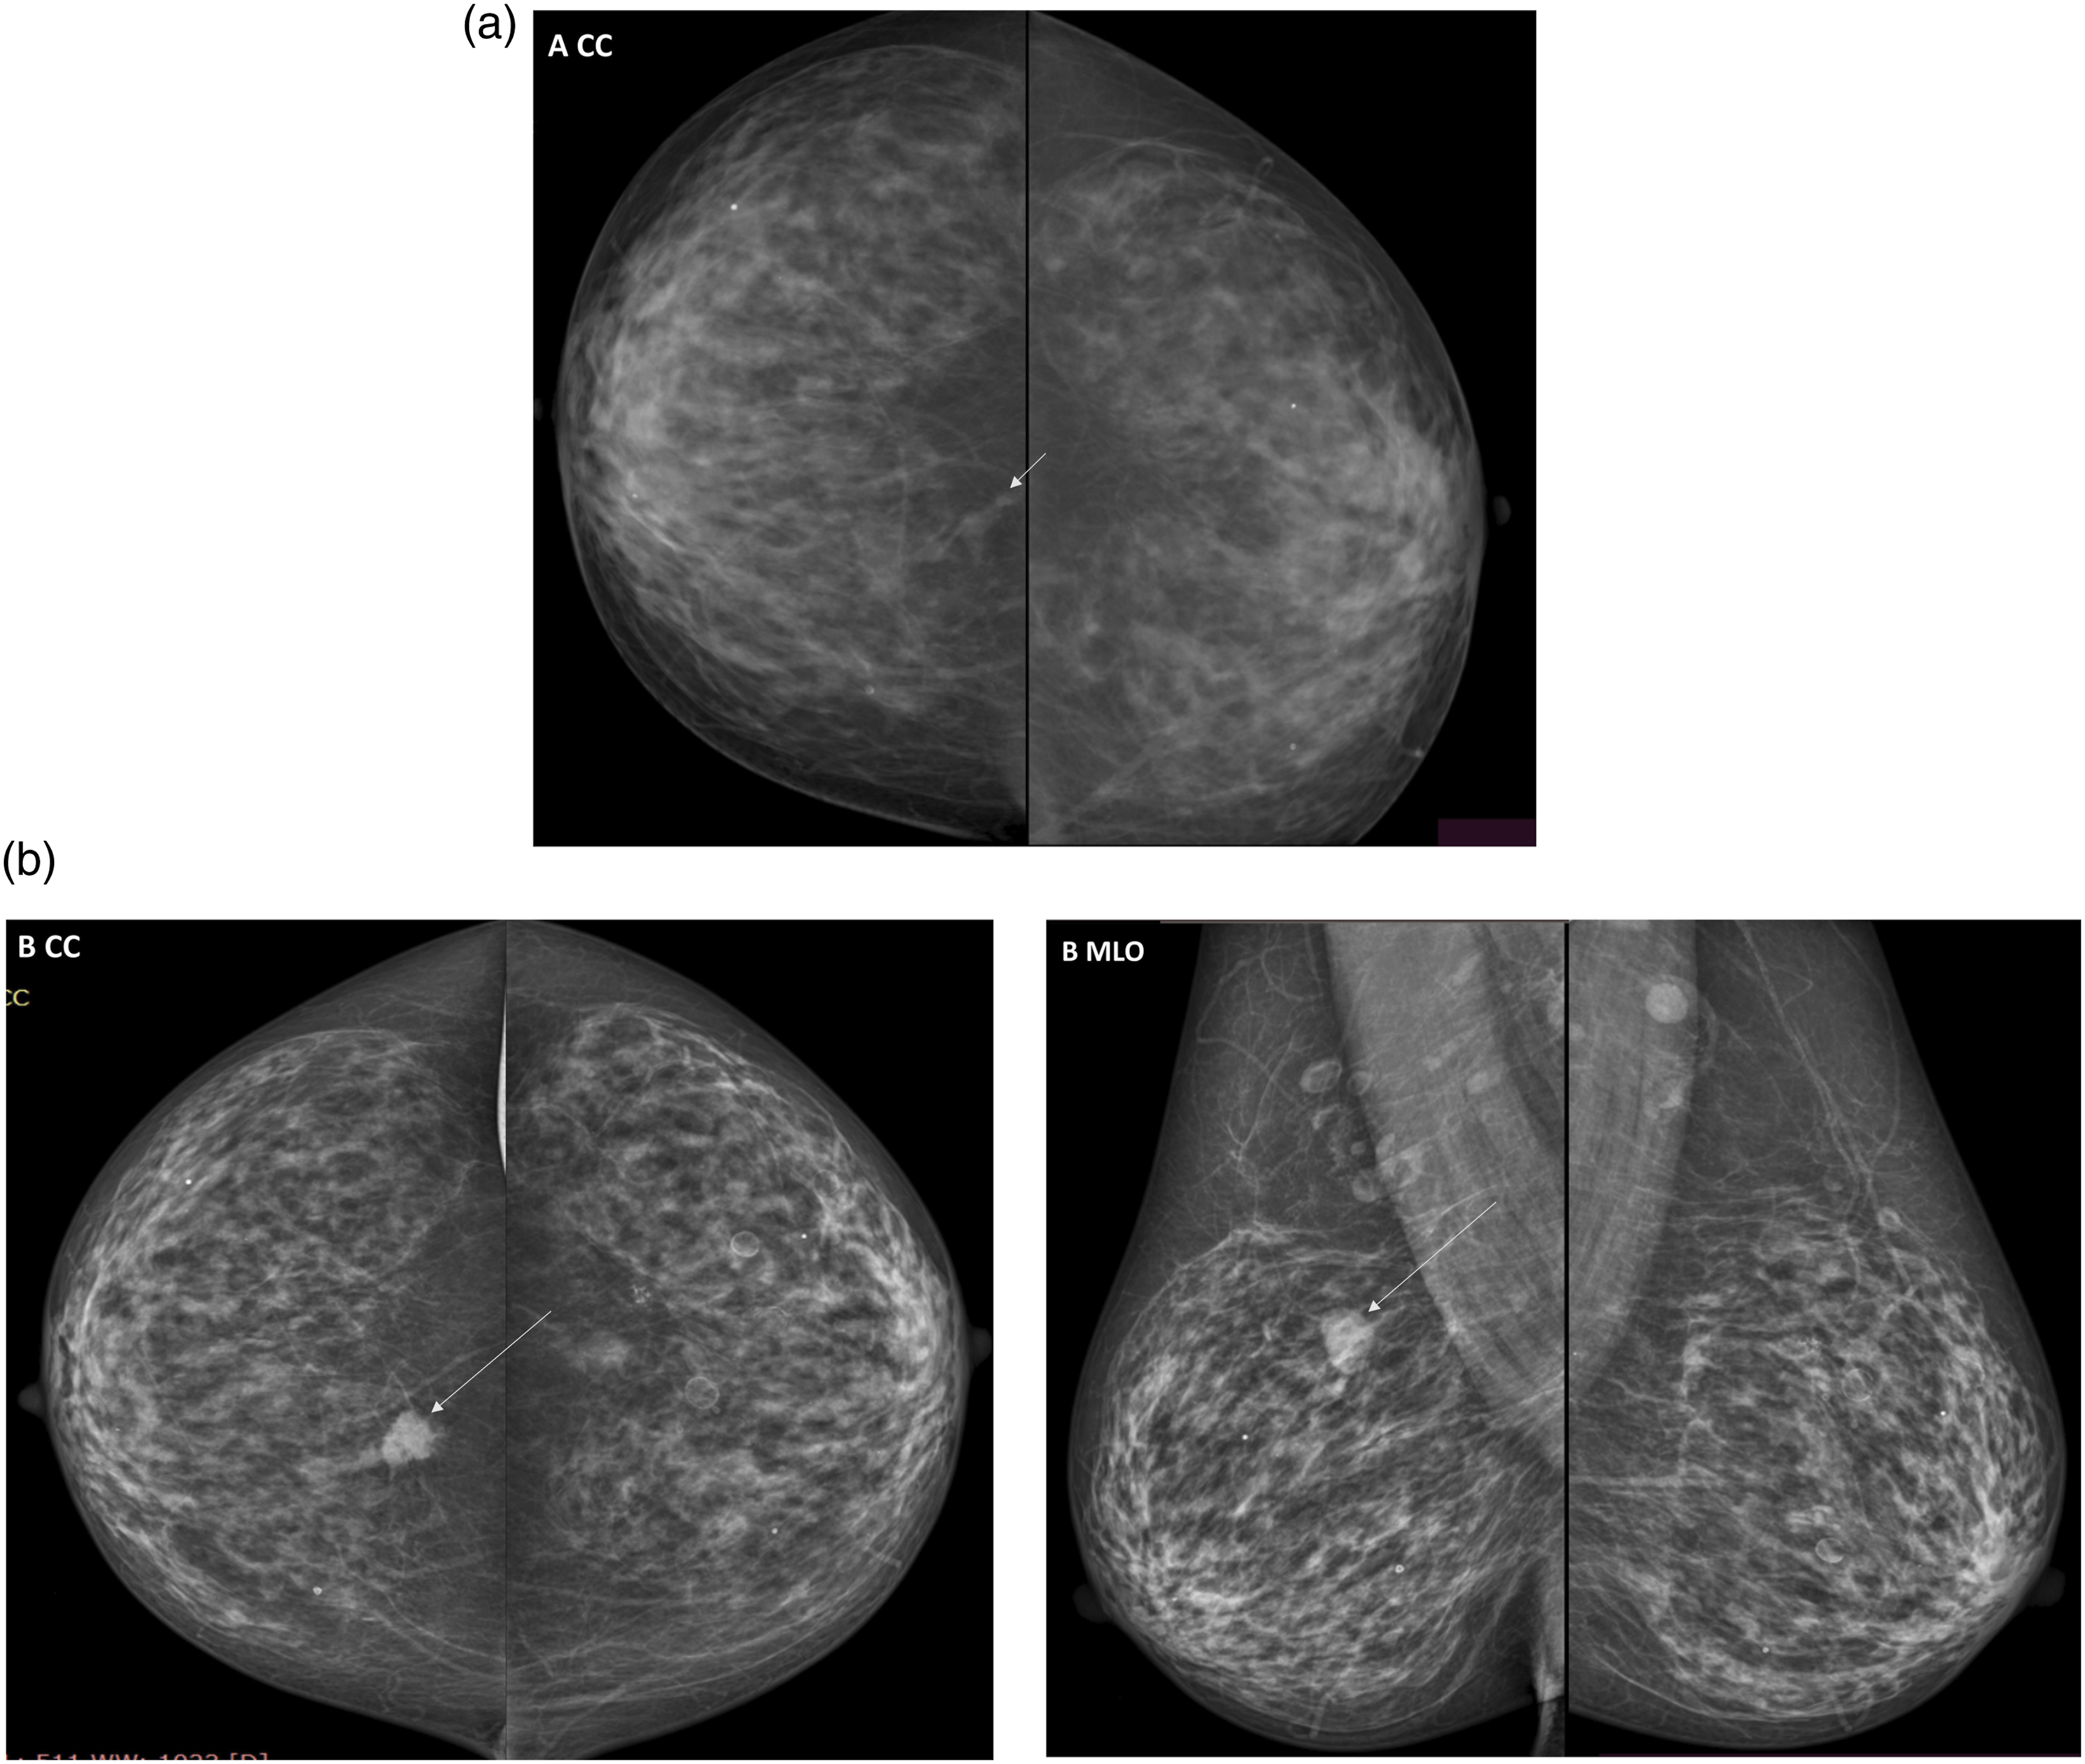
(a and b): Screening mammogram of a 43-year-old premenopausal female. Her calculated BMI is 38.7 (obese). It is matching a predominantly fatty breast parenchyma (ACR B). Her mammogram shows a right UOQ focal asymmetry with grouped microcalcifications (arrows in (a)). They are more appreciated in the magnification view (b). Core biopsy revealed high grade DCIS.

Screening mammogram of a 66-year-old postmenopausal female. Her calculated BMI is 33.8 (obese). It is matching a predominantly fatty breast parenchyma (ACR B). Her mammogram shows a right LIQ malignant mass lesion (arrows).
The correlation between the BD and the risk of BC development
Cross tab showing the number and percentage of the female participants in the two breast density groups calculated in both the cancer and non-cancer groups as regards their menopausal status.

Considering the distribution of the BD in the cancer and non-cancer groups considering their menopausal status we found that 265/275 (96.4%) of the cancer group and 29,518/30,168 (97.8%) of the non-cancer group had a predominantly fatty breast. Out of the 10/275 (3.6%) cases diagnosed with breast cancer in dense breasts, 8 cases were diagnosed upon re-call and three were diagnosed on subsequent screening (Figures 3 and 4). (a, b, and c): Screening mammogram of a 49-year-old premenopausal female with a dense breast parenchyma (ACR D). Her mammogram shows a left LIQ oblong shaped, obscured mass lesion (short arrows in (a)). Patient was recalled and contrast mammography was performed. The lesion showed negative contrast enhancement denoting a cystic nature (short arrow in (b)) which was confirmed on complementary ultrasound (c). An enhancing malignant lesion was incidentally identified in the left UOQ (long arrows in B) and was identified on retrograde revision of the mammography films (long arrow in (a)). (a and b): Screening mammogram of a 64-year-old postmenopausal female Her calculated BMI is 31.8 (obese). It is mismatching with a predominantly fibroglandular breast parenchyma (ACR C). Her mammogram shows a right UIQ malignant mass lesion (long arrows in (b)) that was missed in older studies (short arrows in (a)) due to the small lesion size and the dense breast parenchyma.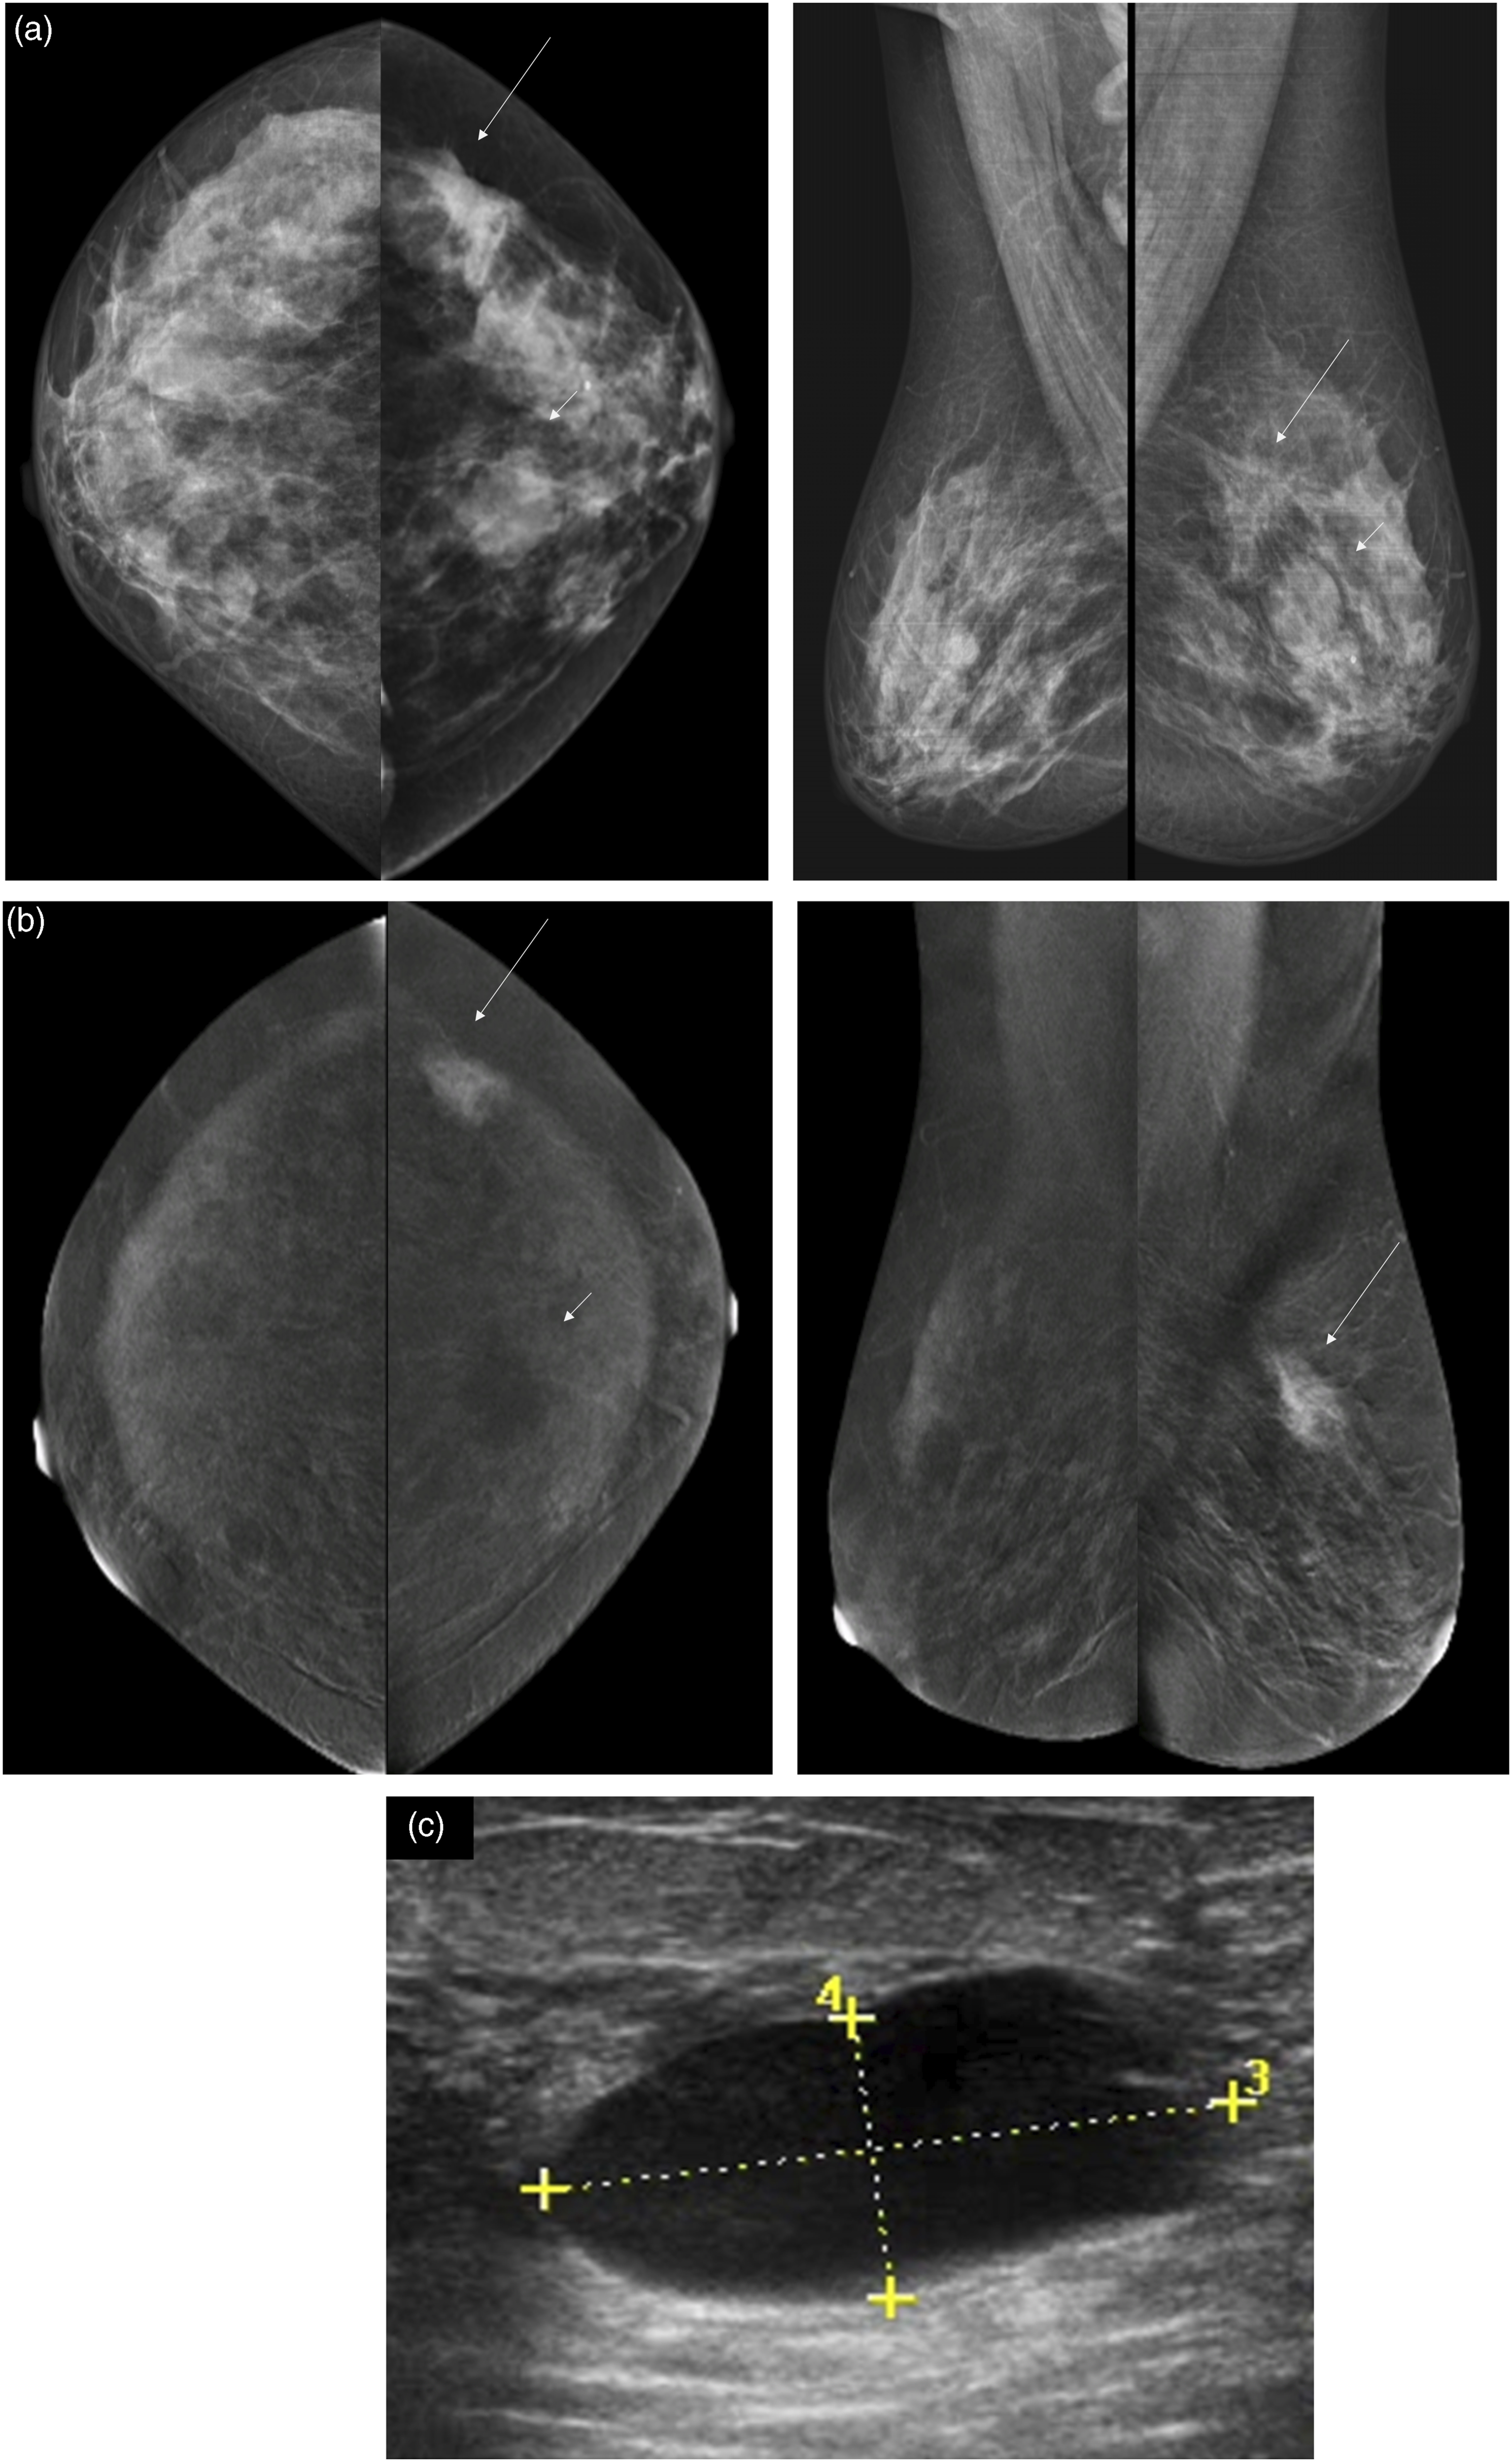
The estimated risk of the breast density among the pre- and postmenopausal groups.

The correlation between the BMI and BD
Correlation between BMI and BD in both the cancer and non-cancer groups
Cross tab showing the number and percentage of the participants in the body mass index groups and the breast density groups regarding their menopausal status.

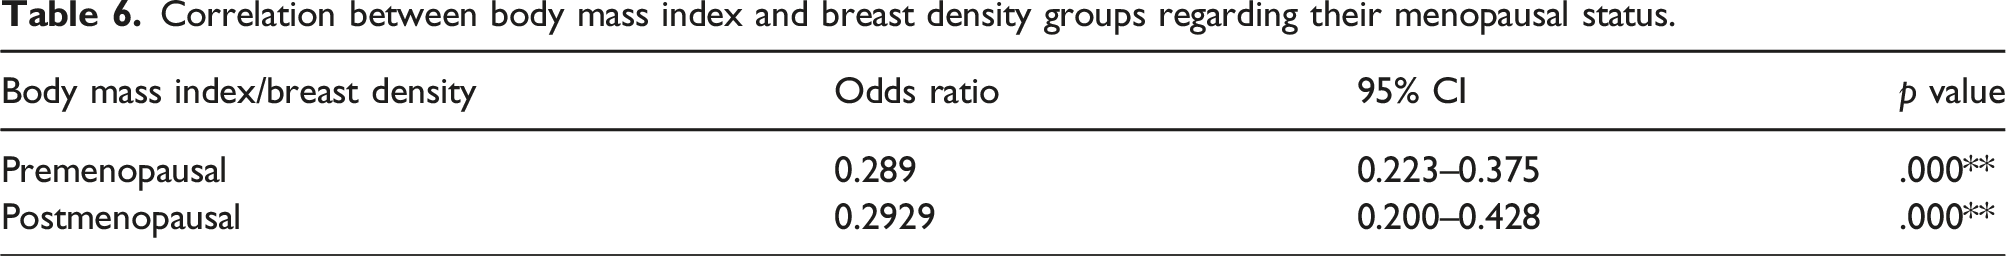
Correlation between body mass index and breast density groups regarding their menopausal status.
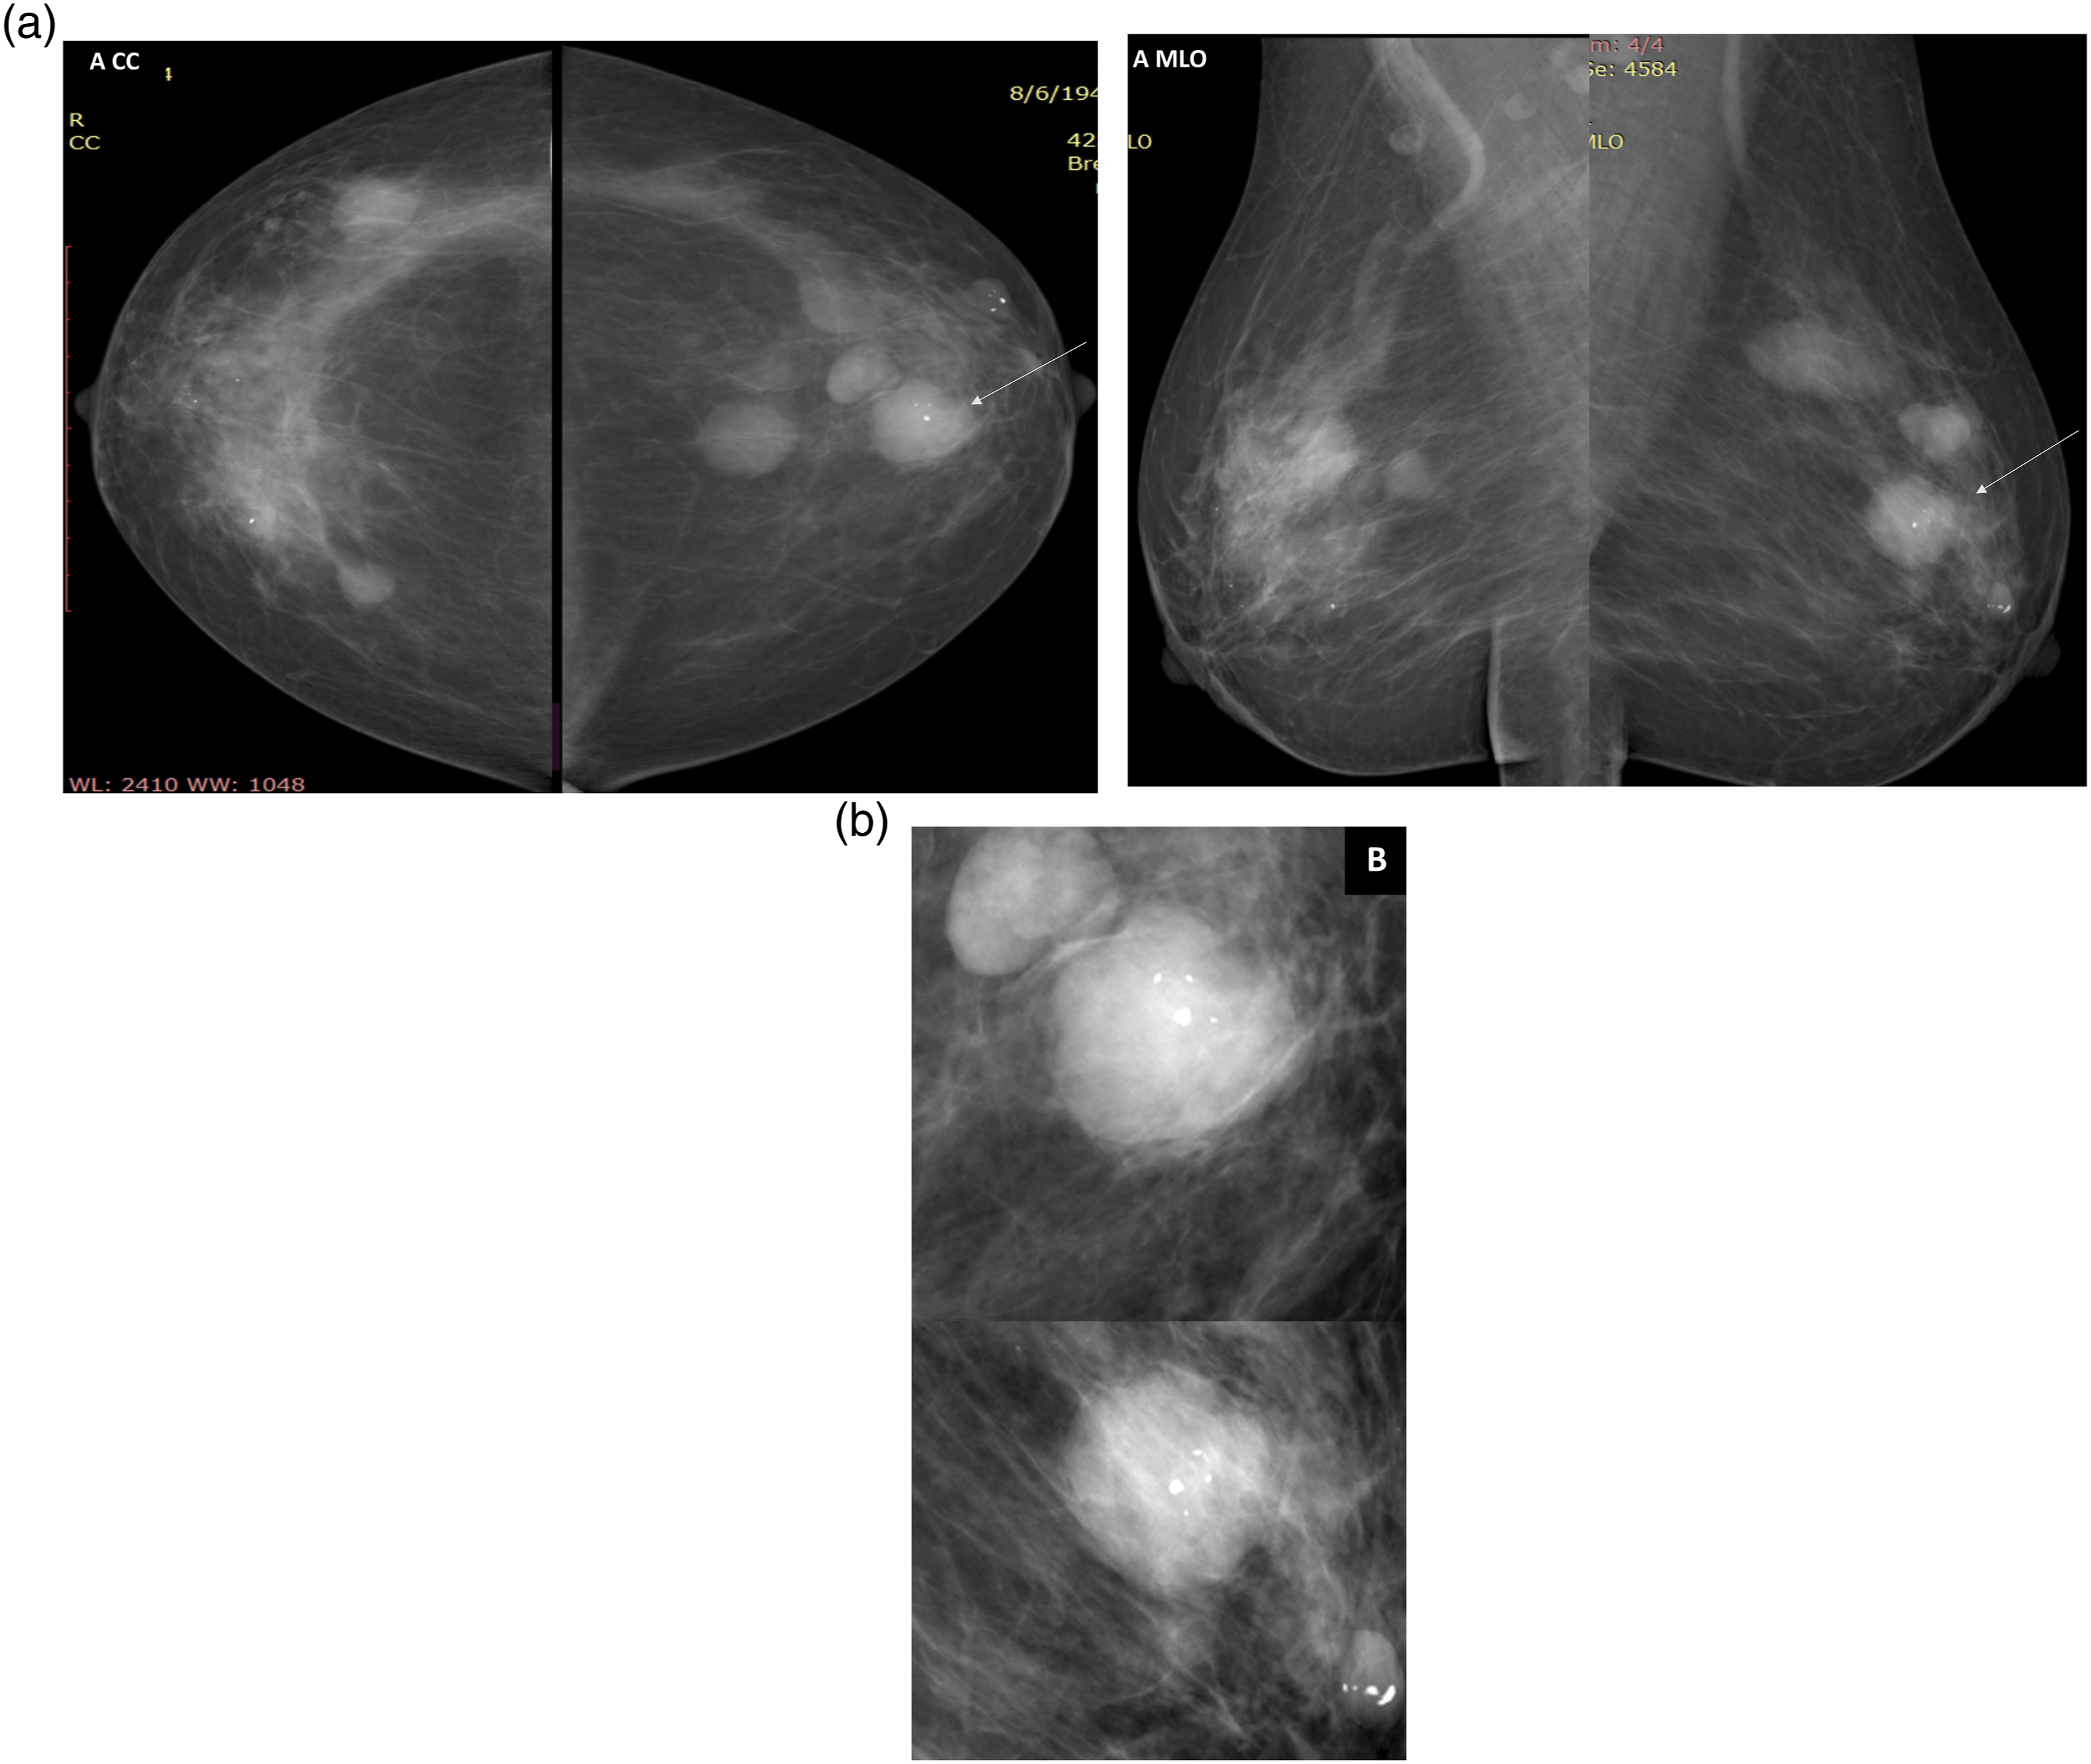
(a and b): Screening mammogram of a 63-year-old postmenopausal female. Her calculated BMI is 24.7 (normal weight). It is inversely related to a predominantly fibroglandular breast parenchyma (ACR C). Her mammogram shows bilateral partially obscured mass lesions proved to be cysts on ultrasound except for a single mass showing microcalcifications seen in the left retro-areolar region (arrows in (a)). It is more appreciated in the magnified images (b). Core biopsy was performed, and it proved to be an IDC grade 2.

Screening mammogram of a 59-year-old postmenopausal female. Her calculated BMI is 38.8 (obese). It is matching a predominantly fatty breast parenchyma (ACR B). Her mammogram shows a left LIQ malignant mass lesion (long arrows) and a right UOQ intra mammary non-specific node (short arrows).
Correlation between BMI and BD in the cancer group
Cross tab between body mass index and breast density groups in the cancer patients regarding their menopausal status.
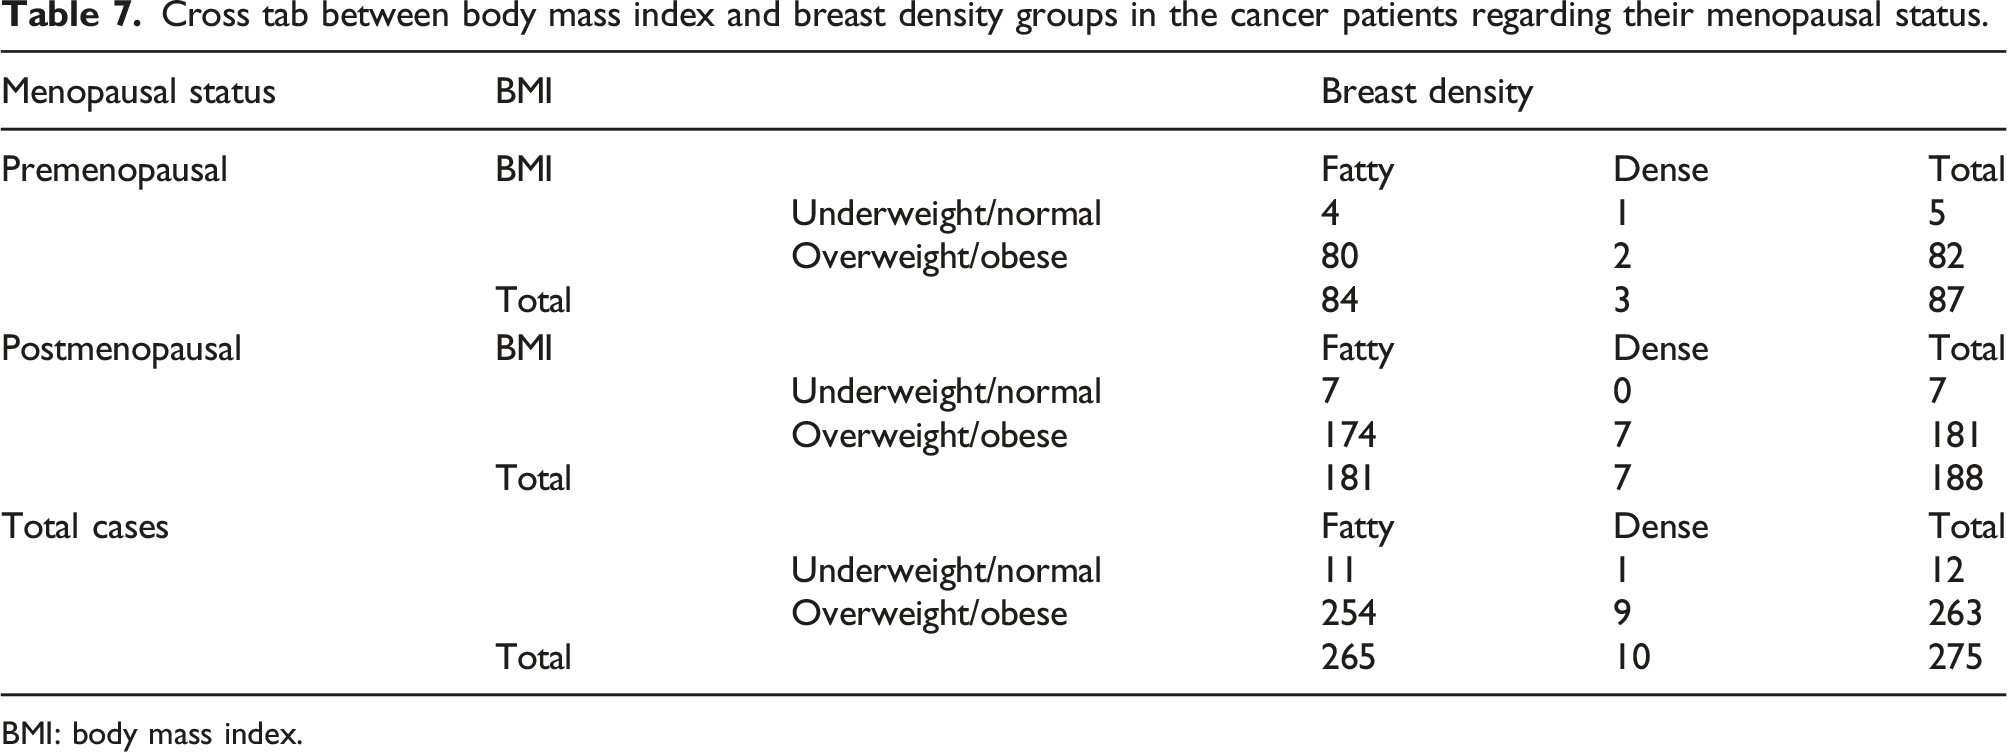
BMI: body mass index.
On the other hand, an insignificant negative correlation was calculated between the BMI and the BD density in the premenopausal group (p value: .12) and a significant correlation was calculated in both the postmenopausal group (p value: .035) and in the total cancer patients (p value: .01)
Logistic regression analysis
A logistic regression analysis was performed to evaluate the independence of each risk factor in the development of breast cancer apart from other risks.
BMI showed a high positive statistical significance (p value: .001 and OR: 1.034), i.e., an increase in BMI causes an increase in BC risk by an odds of 1.034 (3.4%).
Breast density was of high negative statistical significance (p value: .009 and OR = 0.419), i.e., a decrease in breast density results in an increase in BC risk.
Discussion
Although BC is the most common female cancer all over the world, its incidence, mortality, and survival rates vary significantly among different parts of the world. This may be attributed to the unique population structure, genetic and environmental factors. Another reason behind these variations is because the prevalence rates of some common RFs for BC differ according to the race and ethnic group. 27 Numerous RFs have been implicated in the rising incidence and mortality rates of BC; therefore, more emphasis is needed for personalized risk prediction and control strategies.28,29
In this study two of the commonest potentially modifiable risk factors have been evaluated. We sought to study the complex relationship between the BMI, BD and the risk of BC development in relation to the menopausal status in 30,433 African-Arab screened population who have joined the “Women’s Health Outreach Program.” Knowing that there is a paucity in literature discussing the risk factors in the native Arab and African female population, we also looked at the ethnic variations based on comparing the results of the current study with the previously published literature. The changes in the prevalence and nature of the studied potentially modifiable RFs amongst the enrolled African-Arab female population have highlighted unique ethnic traits for African and Arab women.
The evidence in literature discussing the link between BMI and BC is complex and is still unclear. It is believed that adipose tissue of obese women generates excessive estrogen which promotes the development of BC. Although there is an established relationship between the increased BMI and the increased risk for BC among postmenopausal women,8,15,30,31 this relationship is still inconsistent in the premenopausal women. Some studies have shown a negative correlation,32–34 while others have suggested no association.31,35 In this study, the mean BMI was 34.5 ± 5.8 in the cancer group and 33.7 ± 6.06 in the non-cancer group. A statistically significant difference (p value: .02) was found between the cancer and non-cancer groups in the postmenopausal subgroups with a direct correlation between BMI and BC (OR: 2.280). In the premenopausal group the difference was insignificant (p value: .776) with an inverse correlation between the BMI and BC (OR: .877). After performing the logistic regression analysis, the results showed that BMI is an independent highly significant risk factor contributing to an increase in breast cancer risk by an odds of 1.034 (3.4%). The results of the current study are concordant with the meta-analyses performed by Xia and colleagues
According to the Egypt Health Issues survey conducted in 2015
Most previous studies have shown that BD is an important breast cancer RF with a reported two- to 6-fold increased risk of developing BC in women with dense breasts. In addition to its role in the increased BC risk, BD reduces mammographic accuracy.39,40 In a meta-analysis performed by McCormack, et al. they found that the relative risk of BC is collectively 2.92 for women with heterogeneously dense breasts and 4.64 for women with extremely dense breasts when compared to women with an entirely fatty breast. 41 Lee, et al. and Sickles, et al. have commented that these figures may be misleading since they resulted from comparing relative risks for women with dense and entirely fatty breasts; the latter comprising only 10% of the screening population. They stated that when replacing the entirely fatty breast (ACR A) with the scattered fibro glandular densities (ACR B), the relative BC risk associated with BD would be much smaller and was estimated to be about 1.2 for women with heterogeneously dense breasts and 2.1 for women with extremely dense breasts.42,43 The variable density comparison groups used in different analyses has led to uncertainty regarding the actual magnitude of cancer risk associated with dense breasts and it is even stated in some studies that BD is a much lower risk than other RFs. 42
The current studied female population showed unique ethnic characteristics as regards the BD as a RF. Upon studying the correlation between the BD and BC risk according to the menopausal status, it was found that in the premenopausal females, the BD was of direct statistically insignificant relation (p value: .919, OR: 1.062), while in the postmenopausal females, BD showed an inverse highly significant relation to breast cancer (p value:<.001, OR: 0.234). After performing the logistic regression analysis, it was found that in this unique studied population, decreased BD is an independent RF for breast cancer and this was of high statistical significance (p value: .009) (OR: 0.419).
Several researchers have investigated the relationship between the dense and the non-dense areas on mammograms (representing the fibro glandular and fat components respectively) and the BC risk. Some researchers have found that both the dense and non-dense areas are independent RFs and have reported a positive association with the dense area and an inverse association with the non-dense area.44,45 A few researchers, as Lokate et al., have found a positive association between the non-dense area and the risk of BC development. 46 They referred this to experimental studies that suggested that fat tissue produces estrogen and specific proteins which could enhance the proliferation of malignant cells. An insignificant correlation between the non-dense area and the risk of BC was reported by Torres-Meija et al. and Stone et al.47,48
The observed discrepancies remain controversial but could be caused by important variations in technique of BD assessment, the adjustments performed in the analyses and, to a certain extent, the differences in the nature of the population under study, including ethnicity, lifestyle variations and menopausal status. In the current study, the largest percentage of the studied population were postmenopausal and were overweight and obese.
In the studies performed by Harris et al. and Boyd et al., they both found that percent density and BMI are inversely linked and act as confounders of each other’s effects. Evaluations of the relationship among body size, mammographic density, and BC risk have shown that the positive association between obesity and breast cancer becomes stronger with an adjustment for mammographic density, particularly measures that reflect percent dense area. On the other hand, the positive association between mammographic density and breast cancer becomes stronger with an adjustment for obesity in both premenopausal and postmenopausal women. These findings suggest that obesity and mammographic density independently play a role in the association with BC, rather than a role as a mediating factor.49,50
When comparing the pre- and postmenopausal groups of the cancer patients, no statistically significant difference was found as regards the BMI in both groups (p value: .877) while a statistically significant difference was found as regards the BD in both groups (p value: .001) where a much larger number of obese women were postmenopausal. A statistically insignificant number of women (9/275, 0.003%) were both obese and had a dense breast parenchyma in both groups.
In conclusion, ethnic variations influence the potential impact of the different RFs for developing BC. The current studied population presented unique ethnic characteristics, where a decreased BD was found to be an independent RF for BC. On the other hand, BMI was found to be a significant RF for developing BC especially during the postmenopausal period. This together with the alarming number of obese and overweight females in the studied population signals the importance of applying strict weight control strategies as a preventive measure against BC in this unique African-Arab population.
Footnotes
Declaration of conflicting interests
The author(s) declared no potential conflicts of interest with respect to the research, authorship, and/or publication of this article.
Funding
The author(s) received no financial support for the research, authorship, and/or publication of this article.