
Abstract
Background
Geographical variations in the use of outpatient imaging can reveal inappropriate use of radiological services. Knowledge about these variations is crucial in the strive for appropriate and improved services.
Purpose
To investigate the geographical variations in outpatient diagnostic imaging and analyze variations for main groups of examinations and for specific examinations.
Material and methods
Data on outpatient radiological procedures registered at the Norwegian Health Economics Administration in Norway for 2019 were accessed with county-based population rates for age adjustment accessed through Statistics Norway. Age-adjusted rates were used to calculate high/low ratios, means, standard deviations, and coefficients of variation were calculated per 10,000 inhabitants.
Results
There is high geographical variation for PET/CT and PET/MRI and moderate variation for neuroradiological outpatient examinations in Norway in 2019. Variations for the musculoskeletal systems and of thorax, abdomen, and vessels are almost 50%. We find high high-to-low ratios in CT—face (9.7), MRI—elbow joint (8.5), CT of the neck, thorax, abdomen, and pelvis (6.5) as well as MRI—prostate (6.2). Comparing with data from 2012–5, we find a reduction in variation for some examinations, such as MRI of the hip and MRI of the entire spine, and an increase in variations for others, such as CT of the face and MRI of the elbow joint.
Conclusion
Despite much attention to the problem, we demonstrate substantial variations in radiological services in Norway raising concern with respect to appropriateness, quality of care, equity, and justice. The findings provide important input for quality improvement in radiological services.
Introduction
Geographical variations in the use of diagnostic imaging can indicate inappropriate care and are therefore of interest to everyone aiming to improve radiological services.
Geographical variations have been documented internationally for a wide range of imaging examinations.1–12 Some studies from Norway indicate variations in specific fields of imaging,13–16 and a recent report from the Office of the Auditor General of Norway identified geographical variations for outpatient examinations between 2012 and 2015, as well as substantial use of examinations with unclear benefit. 17
The appropriateness of diagnostic imaging procedures has gained international attention, for example, by European radiation protection authorities 18 and by the Choosing Wisely Campaign, 19 which recently has a Norwegian branch where the association of Norwegian radiologists as well as the Norwegian association of (referring) General Practitioners (GPs) has played an active role.
The aim of this study was to investigate geographical variations in outpatient diagnostic imaging for 2019 and compare them with previous results from the Office of the Auditor General of Norway.
Unwarranted variations pose problems for the justification of health services as they violate professional appropriateness criteria 20 as well as ethical principles (equity, justice). Documenting variations in care is a crucial step in addressing these issues.
Materials and methods
The data for this study is the total number of imaging examinations in terms of Norwegian Classification of Radiological Procedures (NCRP) codes registered at the Norwegian Health Economics Administration (HELFO) in 2019. HELFO registers data of outpatient examinations performed at public hospitals and private institutions but does not include inpatient examinations and examinations covered by insurance or paid in full by the patient. There were 1215 NCRP codes in 2019 that cover main modalities such as conventional radiography (CR), magnetic resonance imaging (MRI), computed tomography (CT) and ultrasound (US). Examinations were grouped in five groups: neuroimaging; musculoskeletal imaging; imaging of the thorax, abdomen, and vessels; PET/CT and PET/MRI examinations; and miscellaneous (i.e., CT of the sinuses, mammography, and other examinations that do not fit in the four other groups). For the purpose of comparison, the examinations analyzed in this study are the same as in the report by the Office of the Auditor General of Norway which showed a high degree of geographical variation.
The data was provided by HELFO in the form of excel-sheets containing raw data on examinations performed in all 18 counties in Norway during 2019 and contained information about the treatment institution, the patient’s county of residence, type of examination, and the 10-year age group for the patient (spanning from 0–9 years of age up to 100+ years of age). 16
A direct age adjustment was performed using the Norwegian 2019 population as the standard population, since the entire population being examined (usually a country) is recommended as a standard population in direct age adjustments. 21 The population data was extradited from Statistics Norway using the same 10-year age groups as in the data from HELFO for the purpose of age adjustment, and all counties were included. 16
The direct age adjustments are performed through three steps. Step one is calculating age specific rates as the number of examinations per 10,000 inhabitants for the different age groups. In the second step, this age specific rate was used to calculate an estimated number of examinations performed per 10,000 inhabitants for the age group, if they were hypothetically the standard population, to counteract the effect of an aging population may have on the use of medical imaging Such estimates were made for all age groups, giving a total estimated number for the population of interest. In the last step, we calculated the age-adjusted rates, presented as the number of examinations performed per 10,000 inhabitants. See also Ref. 16.
The total estimated number for the population of interest was then applied to the standard population. For example, the total estimated number of examinations (the number of examinations that would have been performed if all counties had the exact same population, and in this case, the sum of the estimated number of examinations for all age groups), providing an age-adjusted rate. 22 Following small-area-analysis (SAA), these calculations were based on the patients registered county of residence, rather than the treatment institution. This means that even if a patient residing in Bergen underwent an examination elsewhere in the country, the examination was registered and counted for in Bergen.
Variation in the utilization of the specific examinations between counties of residence was calculated as the ratio between the highest and lowest consuming county of residence, as the analysis performed by the Office of the Auditor General of Norway. 17 A ratio of one indicates equal consumption rates, a ratio between 1.5 and 1.9 was considered a moderate variation (highest user had a <50% higher consumption than the lowest), and a ratio of two or higher was considered a high variation (highest user had < twice the consumption of the lowest). The coefficient of variation (COV, ratio of the standard deviation to the mean) was calculated to give a better insight into the actual variation for the different groups.
Additionally, the mean and standard deviation were calculated, and histograms, boxplots, and scatter diagrams were made for all five main groups of examinations. To address outliers, such analyses were also performed for the three specific examinations with the highest high/low ratios for three groups (public hospitals, private institutions who had deals with the public hospitals, and both together). Outliers were kept but explained instead of excluded.
To get an insight into how the variation may have changed over time, the results from this study is compared to the results from the report of the Auditor General in Norway, who did a similar study to this where the variation in the use of outpatient MRI and CT examinations between 2012 and 2015.
All the analysis of the data was performed in Microsoft Excel 2016. 23
Results
A total of 2,994,092 outpatient radiological examinations performed in Norway in 2019.
Musculoskeletal imaging was the most frequent type of examination, followed by imaging of the thorax, abdomen, and vessels. The imaging category least frequently used was PET/CT and PET/MRI imaging (this is also where the highest variation was found: high/low ratio of 2.3, COV 24.49). The number of musculoskeletal imaging ranged from 3596.5 to 2520.0, while imaging of the thorax, abdomen, and vessels ranged from 1305.5 to 1020.0. Last, the number of PET/CT and PET/MRI ranged from 38.7 to 16.8
The most frequently used examination was CT of the head, while the least used examination was MRI of the thoracic spine. The examination with the highest variation was CT—thorax and abdomen (high/low ratio of 6.1, COV 42.27). The number of CT examinations of the head ranged from 110.0 to 35.0, and MRI examinations of the thoracicspine ranged from 8.4 to 2.8. CT examinations ranged from 166.2 (CT—thorax, abdomen, and pelvis) to 5.4 (CT—lumbar spine).
See Figure 1 for the variations for the different examination groups for the various counties. See Table 1 for the specific numbers and the minimum and maximum number of normalized examinations as well as the high/low ratio, mean, SD, and COV. Figure 2 shows the number of examinations performed per 10,0000 inhabitants for major modalities from 2012-2015 and 2019. Total number of examinations outpatient examinations in Norway 2019 for each county. The numbers are age-adjusted and normalized to each 10,000 persons. Number of outpatient examinations per year per 10,000 for each county for the five different categories, minimum and maximum, high/low ratio, mean, SD, and COV for major examination groups. Numbers are age-adjusted. Since the maximum, minimum, high/low ratios, means, SDs, and COV correspond to the different categories, they are listed beneath the list of counties. The number of examinations performed per 10,0000 inhabitants for major modalities in the period 2012-2015 as reported by The Office of the Auditor General,
17
and the number of examinations performed per 10,000 inhabitants in 2019 (data from the current study). For the category of Nuclear Medicine (NM) and PET there is only data for NM from 2012-2015, and not for the current study.


Number of examinations per year and high/low ratio for the counties comparing 2012–2015 and 2019 for specific examinations selected to be able to compare with. 17 In addition, the high/low ratio for the use of these examinations in the public sector (radiological departments in public hospitals) and the private sector (privately run radiological institutions) are shown separate.
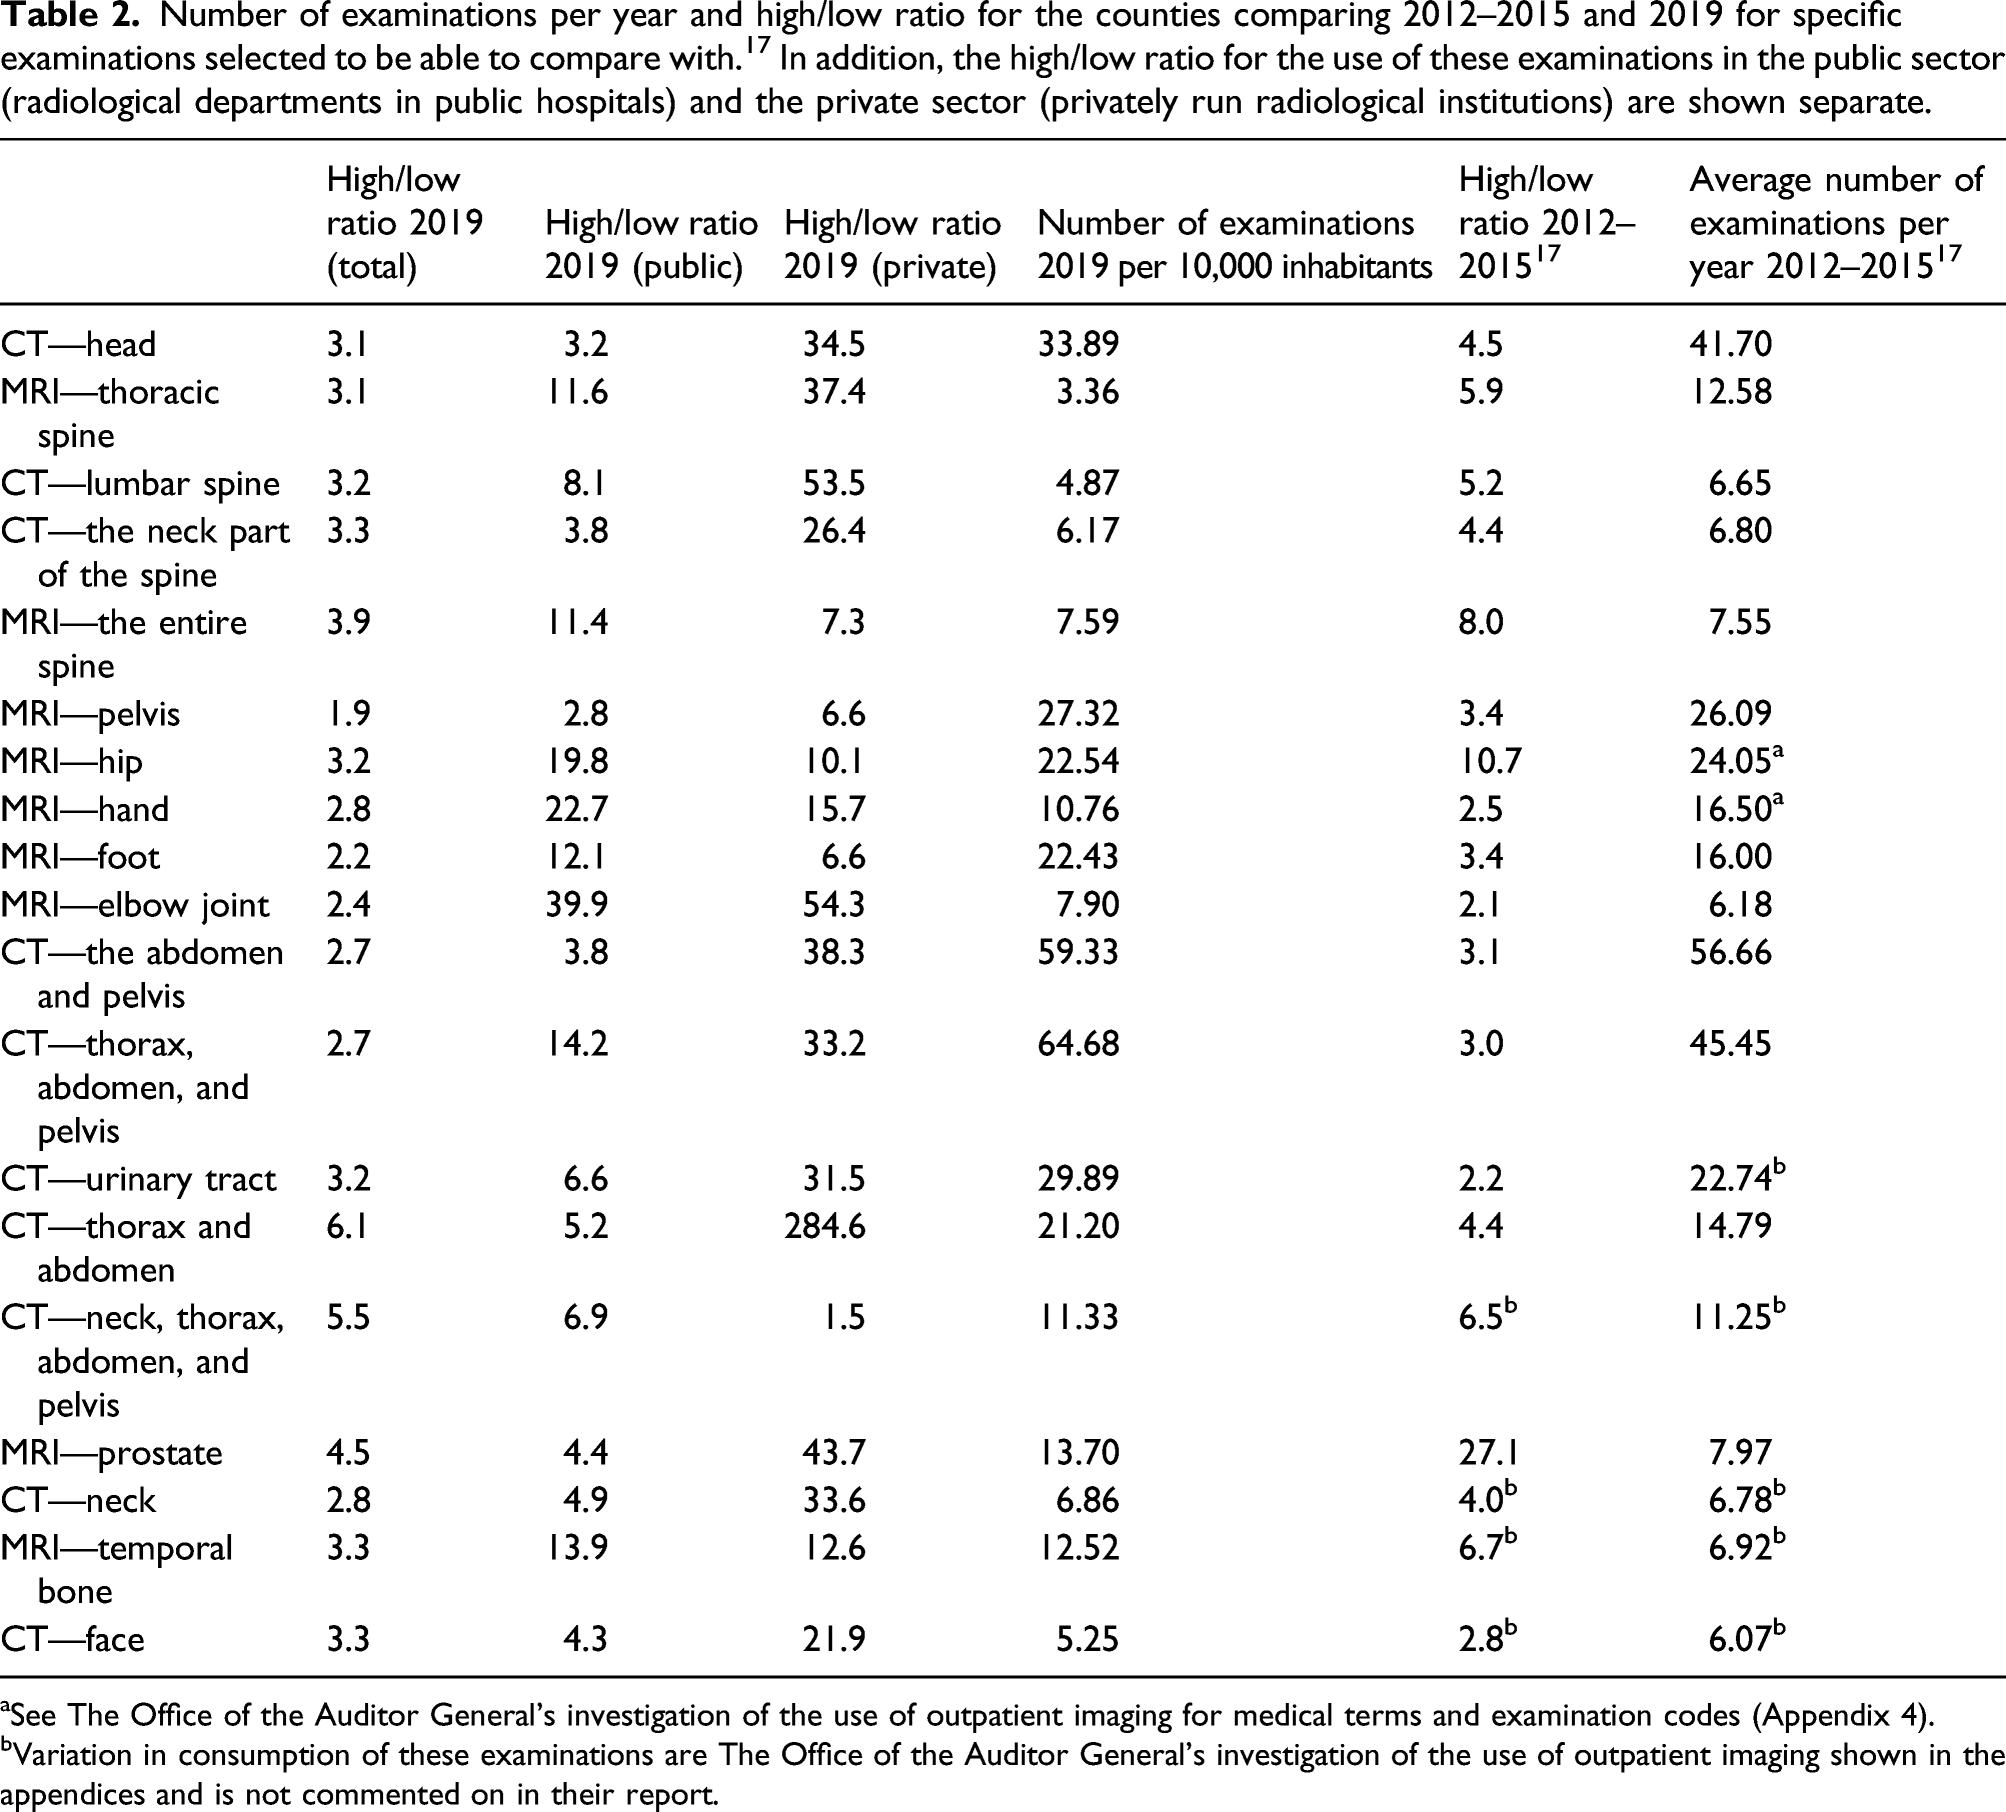
aSee The Office of the Auditor General’s investigation of the use of outpatient imaging for medical terms and examination codes (Appendix 4).
bVariation in consumption of these examinations are The Office of the Auditor General’s investigation of the use of outpatient imaging shown in the appendices and is not commented on in their report.
The mean value of age-adjusted number of examinations performed per 10,000 inhabitants in 2019, the standard deviation for each examination, as well as the COV. These numbers are shown for the total, the private sector and the public sector separately.


The total variation in the specific examinations as per 2019 for the various counties. Rates are age adjusted rates per 10,000 inhabitants.
Two outliers were identified: one in the neuroimaging group, and one in the musculoskeletal imaging group. The outlier in the neuroimaging group indicated one county with especially low use of these kinds of examinations, while the opposite was true for the outlier in the musculoskeletal imaging group. See Figure 4 for more information about these outliers. No such outliers were found for PET/CT and PET/MRI, which can be explained by the fact that higher variance in the data leads to outliers needing to be more extreme to be found. Boxplots and scatterplots with trendlines showing the outliers found in the material making up the five main examination groups. The left-hand side of the panel (a and b) shows the outlier found in the neuroimaging group, and the right-hand side of the panel (c and d) shows the outlier in the musculoskeletal imaging group. The boxplot shows the outlier as a circle either below (neuroimaging) or above (musculoskeletal imaging) the main box plot. The blue square in the boxplots shows where most of the values lie, and the line that goes through shows where the extremes in either end lie. The blue circle shows outliers that are outside the extremes in either end of the data. The scatterplot shows the outlier as the value furthest away from the trendline.
The specific examinations with the highest variations also revealed outliers: one clear outlier was the examinations of the MRI—elbow joint, and two others were CT—thorax and abdomen. All were in the private sector. See Figure 5 for a visual representation of these outliers. Boxplots and scatterplots with trendlines showing the outliers found in the material for the specific examinations with the highest variation. The left-hand side of the panel (a and b) shows the outlier found for MRI—elbow joint, and the right-hand side of the panel (c and d) shows the outliers for CT—thorax and abdomen. The boxplot shows the outlier as a circle, or circles, above the main box plot. The blue square in the boxplots shows where most of the values lie, and the line that goes through shows where the extremes in either end lie. The blue circle(s) shows outliers that are outside the extremes in either end of the data. The scatterplot shows the outlier as the value(s) furthest away from the trendline. Geographical variations in Norway 2019 Tables.
Discussion
This study documents high geographical variation for PET/CT and PET/MRI and moderate variation for neuroradiological outpatient examinations in Norway in 2019. The variation in PET/MRI is most likely due to differences in access, as this modality was only found in three major cities. Variations for the musculoskeletal systems and of thorax, abdomen, and vessels are almost 50%.
High variations (with a high/low ratio of approximately two or higher) are found for a wide range of specific examinations. The highest variation was seen in CT—thorax and abdomen (high/low 6.2, COV 42.27), CT—neck, thorax, abdomen and pelvis (high/low 5.5, COV 34.77), and MRI prostate (high/low 4.5, COV 26.16). Much of this variation may be due to the differences in use of private services, where the highest variations were seen overall (high/low ratios of 1.5–284.6), and the absolute highest variation were in CT thorax and abdomen. The variation seen in the use of public services were somewhat lower (3.2–39.9), and the highest variation was seen in MRI-elbow joint.
Our results correspond with the findings with the Office of the Auditor General of Norway, although it is worth noting that their report did not analyze the use of CR and US, 17 which is done in the present study. Compared to their report we document a decrease in the variation for most of the examinations, except a small increase in variation in the use of MRI‐hand and MRI—elbow joint, and an increase in variation in the use of CT—urinary tract and CT—thorax and abdomen. Our results are also compatible with a Norwegian study from 2002 with respect to high-rate and low-rate counties, 15 except from some extreme variations in some examinations in the study from 2002 (MRI knee, head, and cervical spine and US of the pelvis). It is worth noting that the aim of the 2002 study was the total number of radiological procedures, whereas this study only includes outpatient procedures. Moreover, there has been a change in codes where the NCRP codes used in this study are adapted as they are more suitable for dose calculations. Additionally, the 2002 study mainly used data from the institutions where the examination was performed, rather than the patient’s registered county of residence.
The results also correspond with international studies investigating geographical variations (for CR, CT, and MRI).4–11 In particular, our results correspond to high/low ratios in geographical variations for many examinations observed in the USA. 10 Differences between countries may be due to different practice patterns, healthcare service structures, availability and costs of the services, as well as differences in guidelines.
The highest COVs were found in CT of thorax and abdomen (COV 42.27), MRI—temporal bone (34.80) and MRI—the entire spine (34.71). This indicates that the high variation found in the total use of thorax and abdomen is correct. It is interesting however, that the two next highest variations differ with respect to the high/low ratio (CT—neck, thorax, abdomen and pelvis and MRI prostate) and the COV (MRI—temporal bone, and MRI entire spine). This could indicate that the variations seen with the high/low ratio in the cases of the second and third highest variations represent extremes in either end of the data, and that the COV may represent a more accurate picture of the actual variation in these examinations due to representing the spread around the mean. This is supported by the fact that the range for these two examinations are high (7.1–39.3 and 7.3–32.7), but not as high standard deviations compared to the means (means: 20.95 and 24.32 and SD: 7.29 and 6.36), while CT—thorax and abdomen has both a high range (12.2–74.3) and a high SD compared to the mean (mean: 39.47, SD: 16.86).
Much of the variation in the private sector may be due to differences in the accessibility of private services, where the access is much higher in some counties such as Oslo than in most rural counties such as Finnmark. This in turn may indicate that at least part of the variation demonstrated in this study can be explained by accessibility of service, since some will resort to private services (this is especially the case for musculoskeletal examinations).
The most challenging outlier to explain for the main examination groups (neuroimaging and musculoskeletal imaging) is in the neuroimaging group. For these examinations, there is a high wait time in the public system (up to 52 weeks), and access to private services appears to be low. The neuroimaging outlier county lies at the mean when it comes to head injuries, but below the mean for mortality of strokes and accidents. These two factors combined could explain this outlier.
The outlier for the musculoskeletal system is easier to explain, since the outlier county is a previously known high user of musculoskeletal imaging, 24 and with quite short wait times in the public system (up to 14 weeks). The county also has a higher portion of the population than the country’s mean for musculoskeletal diseases, obesity, and the portion of the population who exercise less than once a week. 24 Combined these factors could explain why this county has such a high use musculoskeletal imaging.
All the specific examinations’ outliers with the highest variation were in the private sector. The absolute highest variation was found in the use of CT—thorax and abdomen, with a high/low ratio of 284.64, and a COV of 141.24. Two clear outliers were identified in the material making up this category, and one probable outlier. When these are removed, the high/low ratio is reduced to 112.55, and the COV to 117.65, which indicates that there is still a great deal of variation (when the three outliers are removed the data still ranges from 0.12 to 13.88).
One potential explanation for these extreme outliers is that the counties in question all have long wait times in the public system for diagnostic imaging (up to 52 weeks), while there is high availability of private services with lower wait times (up to 12 weeks). However, the strength of this explanation is reduced by the fact that these counties do not have the highest use in most of the other examinations. Nonetheless, they have a somewhat high use of private services when the other examinations are taken into consideration.
When we look at different socioeconomic factors for these different counties, they have a few things in common. Among these are that they are below the country’s mean for the portion of the population with higher education, even though they are over the country’s median income. They are somewhat over the country’s mean when it comes to the proportion of smokers among women, and they are also somewhat over the mean for use of alcohol among youths. They are also over the country’s mean when it comes to the number of patients using medications to treat Chronic Obstructive Pulmonary Disease (COPD) and asthma, the number of patients that have been in contact with primary care because of cardiovascular disease. Last, they also are over the country’s mean when it comes to newly registered cancers. All these factors, in combination with the long wait times and high availability of private services mentioned earlier may help explain why these counties have such a high use of CT—thorax and abdomen in the private sector. The large variations found in some examinations in the private sector, that are not found in the public sector or when the private and public sector are combined, can be due to variations in background variables, such as access. As pointed out, the access to private services may be low in more remote parts of Norway. However, as most private services are contracted by the public healthcare system, these differences may be of less relevance than in other countries. Moreover, when the variations in the private sector are for examinations with low frequency, they may be due to natural (spurious, or variation that cannot be avoided) variations that are canceled when combined with public sector examinations.
There is a wide range of factors that can influence the geographical variations, such as differences in morbidity associated with age and socioeconomic factors. However, we hope that age-adjustment has reduced such effects. Moreover, the socioeconomic differences in the high-rate and low-rate counties are minimal.
One potential major drawback of this study is that it includes only data for outpatient examinations. Although the data include emergency visits and (secondary) follow-up examinations after surgery, the study does not include inpatient examinations and out-of-pocket examinations. The reason is that these data are not available. However, outpatient examinations represent a large proportion of all examinations in Norway. According to the report on strategy for rational use of diagnostic imaging, 8.7% of examinations performed in the Unilabs organization in 2017 were paid either fully by the patient or by health insurance (or 50,925 examinations out of a total 580,097). 25 The rest of the examinations performed in this organization were paid through HELFO (approximately 90% of examinations). When they looked at the same for Aleris the proportions were approximately the same. 25 There exist other private organizations that offer diagnostic imaging (such as Volvat) which were not mentioned in the report; however, it can be assumed that the proportions were similar there as well.
Moreover, many of the mechanisms behind geographical variations are the same for outpatient and inpatient examinations. Where there are specific factors contributing to outpatient variations, separate attention to such examinations is warranted. Additionally, geographical variations in outpatient examinations represent challenges with respect to appropriateness and quality of care. Hence, studying geographical variations in outpatient examinations is warranted on its own right.
Another limitation of this study is the number of examinations and temporal variability. Given the time span (12 months sample time) and for a wide range of examinations, arbitrary variations may be avoided (or filtered out). Moreover, the long sample time and local shifts in coding practices could have occurred. However, there are no known structural incentives for such changes during the study and many such shifts would be spread out equally in the country.
As this is a study from a specific country, the results certainly cannot be extrapolated or generalized to other countries. However, the results are of interest for comparison in other countries and other types of healthcare systems. While the data are certainly most relevant for comparison in the Nordic countries, they can be of great interest to other countries, such as Canada and the Netherlands, which have healthcare systems that are similar to the Nordic countries.
As acknowledged, a wide range of factors can affect the variability in diagnostic imaging, and documented variations do not say anything about the right number of examinations in an area. However, unexplained variations indicate that over- or underuse is relevant hypotheses to test. Moreover, great variation may indicate lack of adherence to appropriateness criteria and the use of low-value examinations. Further studies are needed to investigate this.
It may also be argued that the statistical analysis ought to be performed using dedicated statistical software and not Excel, as Excel is known to introduce some automatic data conversions. However, the calculations are simple, and we have checked the data format to avoid errors.
In conclusion, this study demonstrates high-to-moderate geographical variations for key fields such as PET/CT and neuroradiological outpatient examinations in Norway. High-to-low ratios are very high for CT of the face as well as MRI of the elbow joint, CT of the neck, thorax, abdomen, and pelvis as well as MRI of the prostate. Much of this variation can be explained by the variation seen in the private sector, which again indicates that at least part of the variation demonstrated can be explained by accessibility of services. Geographical variations also vary with time. Unwarranted geographical variations are concerning with respect to appropriateness, quality of care, equity, and justice. The findings provide important input for quality improvement in radiological services.
Footnotes
Acknowledgments
The authors are most thankful to the Norwegian Health Economics Administration (HELFO) for providing data for the study.
Author contributions
BMH and AMG designed the study. BMH retrieved the data, and AMG analyzed the data. A1 wrote the first draft and both authors have revised several versions of the article. Both authors approve of the submitted article.
Declaration of conflicting interests
The authors declared no potential conflicts of interest with respect to the research, authorship, and/or publication of this article.
Funding
The authors disclosed receipt of the following financial support for the research, authorship, and/or publication of this article: This work was supported by the Norges Forskningsråd grant number 302503 IROS.
Informed consent
Both authors give their consent to publishing this article.
Data availability
The datasets used and/or analyzed during the current study available from the corresponding author on reasonable request.