
Abstract
Background
Apparent diffusion coefficient (ADC) values achieve promising results in treatment response prediction in patients with several types of cancers.
Purpose
To determine whether ADC values predict neoadjuvant chemoradiation treatment (nCRT) response in patients with locally advanced rectal cancer (LARC).
Material and Methods
Forty-four patients with LARC who underwent magnetic resonance imaging scans before and after nCRT followed by delayed surgery were enrolled retrospectively. The sample was distributed as follows: responders (R), n = 8; and non-responders (Non-R), n = 36. Three markers of treatment response were considered: post-nCRT measures; ΔADC; and Δ%ADC. Statistical analysis included a Wilcoxon test, a Mann–Whitney U test, and a receiver operating characteristic (ROC) analysis in order to evaluate the diagnostic accuracy for each ADC value marker to differentiate between R and Non-R.
Results
Both minimum and mean ADC values were significantly higher after nCRT in the R group, while non-significant differences between basal and control ADC values were found in the non-R group. In addition, ΔADC and Δ%ADC exhibited increased values after nCRT in R when compared with non-R. ROC analysis revealed the following diagnostic performance parameters: post-nCRT: ADCmin = 1.05 × 10⁻³ mm2/s (sensitivity 61.1% and specificity 66.7%), ADCmean = 1.50 × 10⁻³ mm2/s (sensitivity 72.2% and specificity 83.3%), ΔADC: ADCmin = 0.35 (sensitivity 66.7% and specificity 83.3%), ADCmean = 0.50 (sensitivity 72% and specificity 83%); and Δ%ADC: ADCmin = 44% (sensitivity 66.7% and specificity 83.3%) and ADCmean = 60% (sensitivity 83% and specificity 99%).
Conclusion
Our findings suggest that post-treatment rectal tumor ADC values, as well changes between pre- and post-treatment values, may be biomarkers for predicting treatment response in patients with LARC who underwent nCRT.
Keywords
Introduction
Colorectal cancer is the third most common cancer in men and the second most common in women around the world. In Mexico, it represents the third leading cause of new cases of cancer and cancer-related deaths in both men and women (1). The standard of care to manage locally advanced rectal cancer (LARC; stage II–III) consists of neoadjuvant chemoradiation therapy (nCRT) and total mesorectal excision (TME), followed by adjuvant chemotherapy (2). After nCRT, most LARCs demonstrate variable degrees of tumor response, including pathologic complete remission, in 4%–31% of patients. Patients with complete remission by nCRT can achieve excellent local tumor control and a better quality of life with organ-preserving treatments such as local excision or even watch-and-wait management (3,4).
To facilitate such personalized treatment planning, there is now an increased demand for a more detailed evaluation of radiological response after nCRT. Magnetic resonance imaging (MRI) is one of the main tools used to assess the response of patients with LARC (5). However, whether post-nCRT MRI evaluation for tumor response can inform treatment strategies remains controversial. In fact, surgeons are often reluctant to perform sphincter preservation given insufficient reliability for differentiating between residual tumors and nCRT-related changes, such as edema, necrosis, and fibrotic changes. Therefore, radiologists should be aware that their interpretation might result in a faulty decision when selecting an organ-preserving treatment or performing unnecessary radical surgery, which compromises the quality of life of patients (3).
One of the latest advancements in MRI technology, the apparent diffusion coefficient (ADC), which is obtained from diffusion-weighted imaging (DWI), has been proposed to increase the specificity of MRI in the evaluation of treatment response after nCTR (6–11).
DWI allows for the visualization of random (Brownian) water molecules driven by their internal thermal energy (12). The diffusion in biological tissues is quantified by means of an ADC, which could be affected by barriers such as cell membranes, intracellular organelles, macromolecules, etc. that interfere with the free movement of water molecules (13,14).
It has been reported that solid tumors have a mean ADC value of around 1 × 10⁻³ mm2/s. After the intervention of a therapeutic agent that results in cell killing, the extracellular space increases as the intracellular space diminishes. This results in a shift towards higher ADC values (15). Several authors have shown, in a variety of tumors, including rectal and colon cancer, that the addition of DW to standard T2-weighted (T2W) sequences improve the performance of MRI in differentiating between patients with cancer with a complete tumor response and those with residual tumor (16–21). These capabilities, once validated, could provide for an important opportunity to individualize therapy thereby minimizing the unnecessary systemic toxicity associated with ineffective therapies with the additional advantage of improving overall patient healthcare and associated costs (22).
In the present study, the clinical data of patients with LARC treated with nCRT and TME in our hospital were collected and retrospectively reviewed. The aim of the present study was to determine whether changes in ADC values obtained six weeks after completing nCRT correlated with the tumor histopathologic response in terms of a complete response versus a non-complete response.
Material and Methods
Patients
This study retrospectively evaluated 44 patients (23 men, 21 women; median age = 60.5 years; age range = 29–82 years) who were treated for LARC between 2015 and 2018. Patient characteristics and clinical data were retrieved from database and electronic medical records. The inclusion criteria were as follows: (i) histologically (biopsy) proven rectal adenocarcinoma; (ii) tumors defined on primary staging T2W MRI by an experienced gastrointestinal radiologist as rectal lesions with variable signal intensity on T2 in comparison to the hyperintense mucosa and the hypointense muscular layer; (iii) T3 or T4 tumors without lymph node involvement and an absence of distant metastases, or any T with N1 or N2 and an absence of distant metastases; (iv) patients with treatment consisting of a long course of preoperative nCRT (50.4 Gy radiation/28 fractions + capecitabine [825 mg/m2 twice daily for five days over five weeks]) followed by surgical resection and the availability of pre- and post-nCRT MRI including DWI.
Patients with non-resectable and/or metastatic disease were excluded. Patients who refused surgical treatment were also excluded. It is important to mention that mucinous tumors were not included in the present study.
MRI protocol
Patients did not receive bowel preparation or a spasmolytic. Imaging was performed at 3.0 T (Discovery MR 750w GEM®, General Electric Healthcare, Milwaukee, WI, USA) using a phased-array body coil. All patients underwent a pre-treatment MRI for primary tumor staging, and a second restaging MRI for response evaluation six weeks after the completion of nCRT. The imaging protocol consisted of standard T2W spin-echo sequences (FSE) in orthogonal directions (axial, coronal, and sagittal), which were planned perpendicular to the longitudinal axis of the tumor, a T1-weighted (T1W) spin-echo sequence in an axial direction, and axial DWI acquired with a b-value of 1100 s/mm2. Fat-suppressed contrast T1W sequences (axial, coronal, and sagittal) were used to suppress the bright signal from fat. The sequence parameters are displayed in Table 1.
MRI sequences and data acquisition parameters.

DWI, diffusion-weighted imaging; FOV, field of view; FSE, fast spin echo; GD, Gadolinium; MRI, magnetic resonance imaging.
Image analysis
Two radiologists (JARP and MEJ, with 10 and 5 years of experience, respectively) reviewed the imaging studies, performing tumor ADC measurements on the pre- and post-chemoradiation images. At the initial review, each radiologist was blinded to the other radiologist’s opinion. In addition, they were blinded to the clinical response and pathology data. Mean and minimum ADC measurements of the tumor were executed on an ADC map on the monitor using GE Advantage Workstation 4.6 software with the READYVIWER application (2006–2010). On the pre-nCRT b1100 diffusion images, the tumor was defined as a focal mass with high signal intensity in comparison with the signal of the normal adjacent rectal wall. On DWI after nCRT, the tumor was defined as focal areas of residual high signal on the b1100 images within the location of the primary tumor bed and/or corresponding with the residual tumor on T2W MRI. Another feature was the hypointensity of the tumors on ADC maps.
Each reader manually drew a region of interest (ROI) including the entire tumor on the ADC map and measured the ADC values in the consecutive ROIs throughout the whole tumor. The mean ADC of each ROI was determined, and an average ADC was calculated for each tumor. When the measurements were >10% different between the two reviewers, another series of measurements was performed by the same two reviewers to reach a consensus. Differences ≤10% were considered negligible and the average was reported (23). Moreover, the data obtained by each observer were used to calculate the intraclass correlation coefficient (ICC) and the inter-observer agreement. To compare and identify the location of the tumor, the pre-treatment images were at the readers’ disposal when analyzing the post-treatment images.
Histopathologic review
Specimens were evaluated according to an established protocol described by Suárez et al. (24) as follow: fresh surgical specimens were examined to assess the quality of the mesorectal excision and, afterwards, fixed in 4% formaldehyde 24–48 h before sectioning. After fixation, the mesorectal margin was inked and the specimens serially sectioned (in slices of 1 cm). When the residual tumor was visible, a minimum submission of four blocks was recommended, but if it was not confirmed, the whole suspicious area was submitted. All mesorectal lymph nodes were submitted for their histologic examination and the circumferential resection margin (CRM) involvement was evaluated. If no residual tumor cells were found, three level sections were further performed of each block; additionally, immunohistochemistry for keratin was performed (24). An experienced pathologist (EHB, with 15 years of experience examining rectal cancer) reviewed all hematoxylin and eosin slides.
The pathologic response of the primary tumor was estimated using Ryan’s classification as follows: grade 0 = no viable cancer cells; grade 1 = single cells or small groups of cancer cells; grade 2 = residual cancer outgrown by fibrosis; and grade 3 = residual cancer outgrown by fibrosis or no fibrosis with extensive residual cancer. Only patients classified as Ryan 0 were considered responder patients.
Statistical analyses
The level of agreement between the ADC values provided by the two readers was assessed following a Bland–Altman analysis. Moreover, we evaluated the ADC’s variability in test–retest data using an ICC for absolute agreement, with a test–retest interval of one month. ICC estimates and their 95% confidence intervals (CIs) were calculated based on a single measurement, absolute agreement, and two-way mixed effects. Three markers of treatment response were considered: post-nCRT measures; ΔADC = ADCpost-nCRT −ADCpre-nCRT; and Δ%ADC = 100 × ΔADC/ADC pre-nCRT, considering the minimum and mean of the ADC values. Comparisons of these markers between responders and non-responders were performed using the non-parametric Mann–Whitney U test. On the other hand, the Wilcoxon test was used for the comparison of related samples. The diagnostic performance of ADC in predicting the response to nCRT was evaluated by means of receiver operating characteristics (ROC) analysis. For each marker, the area under the ROC curve (AUC) and the optimal cut-off were derived, and the corresponding indices of diagnostic performance were calculated. The data were analyzed with SPSS version 23.0 (IBM Corp., Armonk, NY, USA). Two-sided P < 0.05 was considered to indicate a statistically significant difference.
Results
Pathologic examination of the entire surgical specimen showed eight patients with complete tumor regression after nCRT; they were subsequently classified as responders (R). The remaining 36 patients showed a residual tumor (non-responders [Non-R]). The clinical characteristics of the studied patients are summarized in Table 2. Both readers demonstrated a good inter-observer correlation for ADCmin measurements for both basal and control MRIs (Table 3). For ADCmean, the ICC was excellent for the two readers before and after nCRT (Table 3). During the Bland–Altman analysis, a scatter plot was constructed in which the differences between the paired measurements were plotted on the y-axis and the average measurements of the two readers were plotted on the x-axis. It is important to mention than only one pair of measurements was taken to construct the Bland–Altman plots. The mean differences are exposed in Fig. 1 and significant biases between observers were not detected in our analysis. Regarding the ADC measurements, differences > 10% were found in six patients during the first evaluation. These differences became < 10% when remeasuring all patients.
Clinical and pathological characteristics of participants.

nCRT, neoadjuvant chemoradiation treatment.
ICC and 95% CIs.

Based on the 95% CI of the ICC estimate, values <0.5, 0.5–0.75, 0.75–0.9, and >0.90 are indicative of poor, moderate, good, and excellent reliability, respectively.
ADC, apparent diffusion coefficient; CI, confidence interval; ICC, intraclass correlation coefficient.
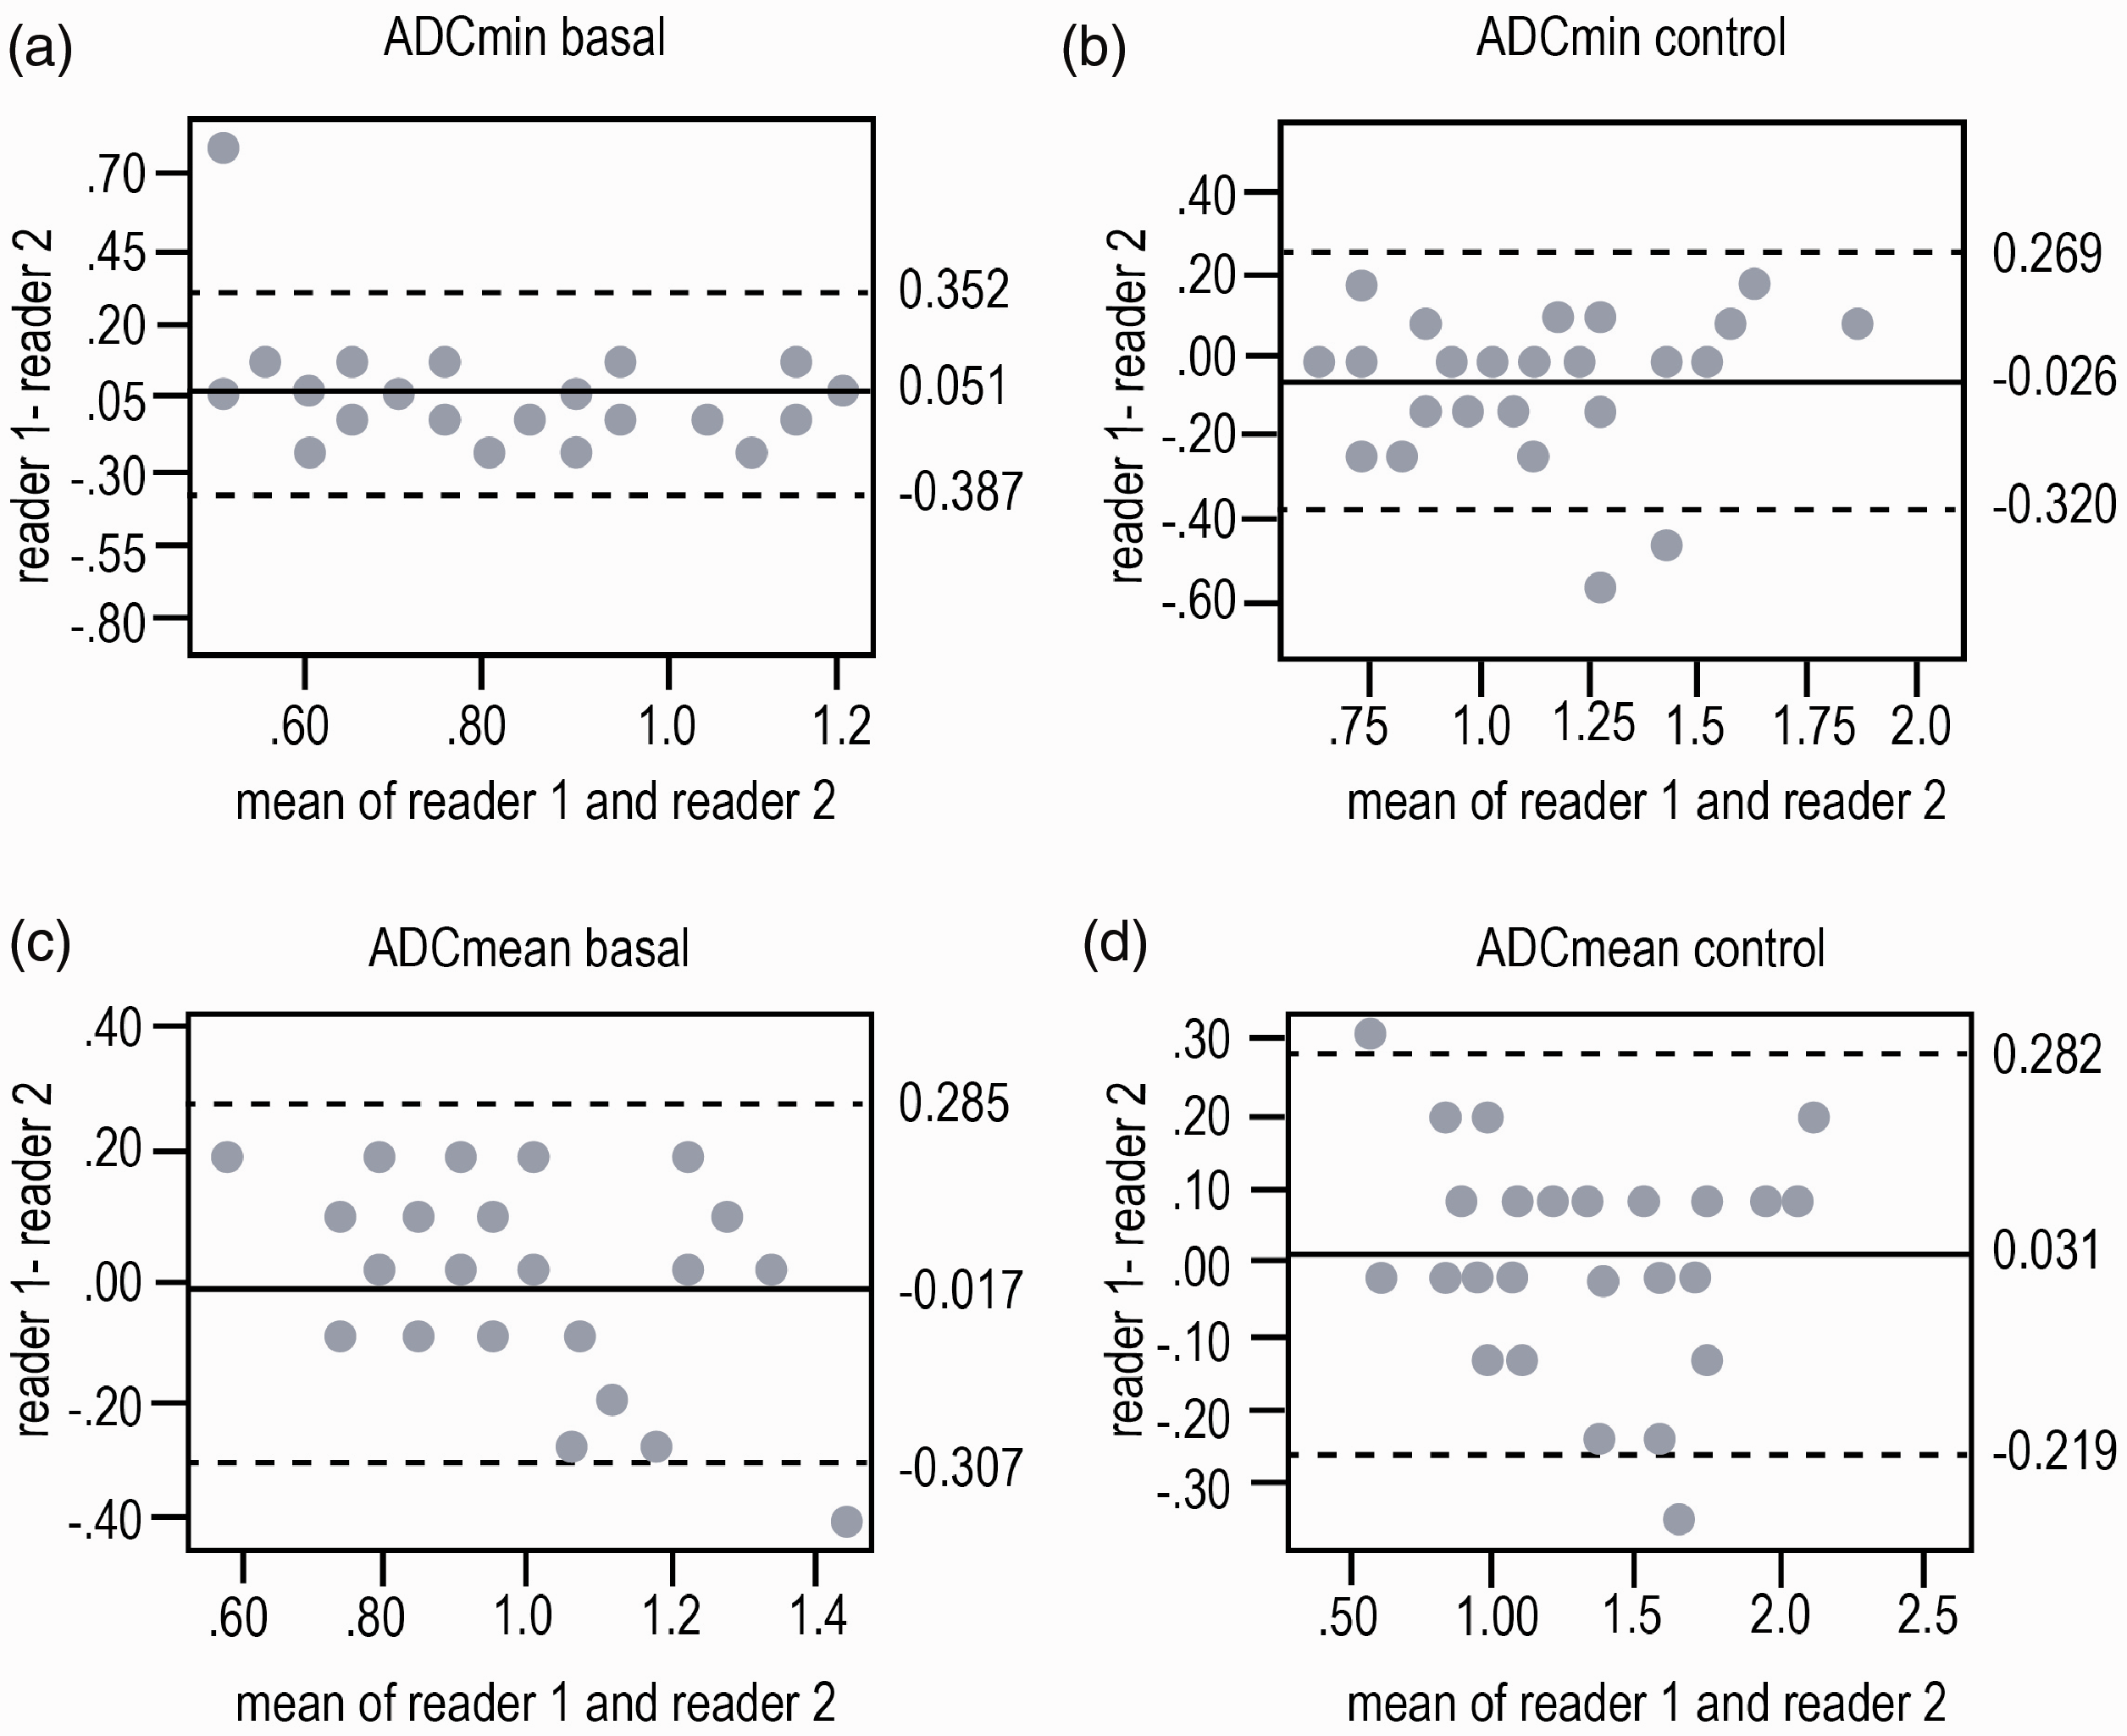
Bland–Altman plots showing the limit of agreement (bias ± 2 SD) between readers across both minimum and mean ADC values before (basal, (a) for ADCmin and (c) for ADCmean) and after nCRT (control, (b) for ADCmin and (d) for ADCmean). A comparison of the two readers’ interpretations indicated that the level of agreement was good in all cases. ADC, apparent diffusion coefficient.
The association between the minimum and mean ADC values and the pathological response to therapy is shown in Fig. 2. Fig. 2a shows that in Non-R patients there were non-significant differences between baseline and follow-up ADCmin values (P = 0.428). Meanwhile, in the R group, we found a significant increase in ADCmin values after nCRT (P = 0.008). The results obtained from the ADCmean values also showed non-significant differences (P = 0.478) between basal and control measurements in non-responders, while the ADCmean values increased after nCRT in the R group (P = 0.001) (Fig. 2b).

Changes in ADC values in response to nCRT in patients with LARC. Box plot summarizing minimum (a) and mean (b) ADC value changes to nCRT in non-responders and responder patients. Differences between basal and control ADC values are exhibited in their absolute manner (ΔADC) in (c) (minimum ADC) and (d) (mean ADC). Meanwhile, the relative changes of ADC (Δ%ADC) are exposed in (e) (minimum ADC) and (f) (mean ADC). For all plots, the circle represents outlier values. *P < 0.05, **P < 0.01, ***P < 0.001. ADC, apparent diffusion coefficient; nCRT, neoadjuvant chemoradiation treatment; Non-R, non-responders; R, responders.
The magnitude of change in ADC values (ΔADC), both minimum and mean, induced by nCRT, is shown in Fig. 2c and 2d. Of note, the absolute change in ADC values was significantly higher in R than in Non-R patients (P = 0.038 and P = 0.020 for ADCmin and ADCmean, respectively). To normalize the effect of absolute ADC differences, the percentage change in ADC values before and after treatment was also calculated for each patient. The analysis of Δ%ADC values also exhibited significant differences between R and Non-R (P = 0.001 for mean and minimum ADC values), indicating that changes in ADC values after nCRT are higher in patients with a complete pathological response than in non-responder patients (Fig. 2e and 2f). Mean values and standard deviations of the mean for each group of the graph results from Fig. 2 are summarized in Table 4.
Pre- and post-nCRT ADC values (minimum and mean), ΔADC, and Δ%ADC considering the responder and non-responder patients.

ADC, apparent diffusion coefficient; nCRT, neoadjuvant chemoradiation treatment.
Finally, the ROC curves comparing the ability of post-nCRT ADC, ΔADC, and Δ%ADC values in identifying the response to nCRT are displayed in Fig. 3a and 3b for the minimum and mean ADC values, respectively. The corresponding AUCs and the indices of diagnostic performance based on the estimated optimal cut-offs are reported in Table 5. As no significant differences were found in pre-nCRT ADC values, the ROC analysis was not performed for this parameter. Our results showed that the optimal cut-off points for post-nCRT measurements were 1.05 mm2/s and 1.5 mm2/s for the ADCmin and ADCmean values, respectively. For ΔADC, we found an optimal cut-off point of 0.35 for ADCmin values and 0.50 for ADCmean values. Finally, for Δ%ADC, our analysis exhibited an optimal cut-off of 44% for ADCmin values and 60% for ADCmean values. The diagnostic performance was similar across the three measures. However, Δ%ADC showed a modest increase in sensitivity and specificity in comparison with post-nCRT values and ΔADC.
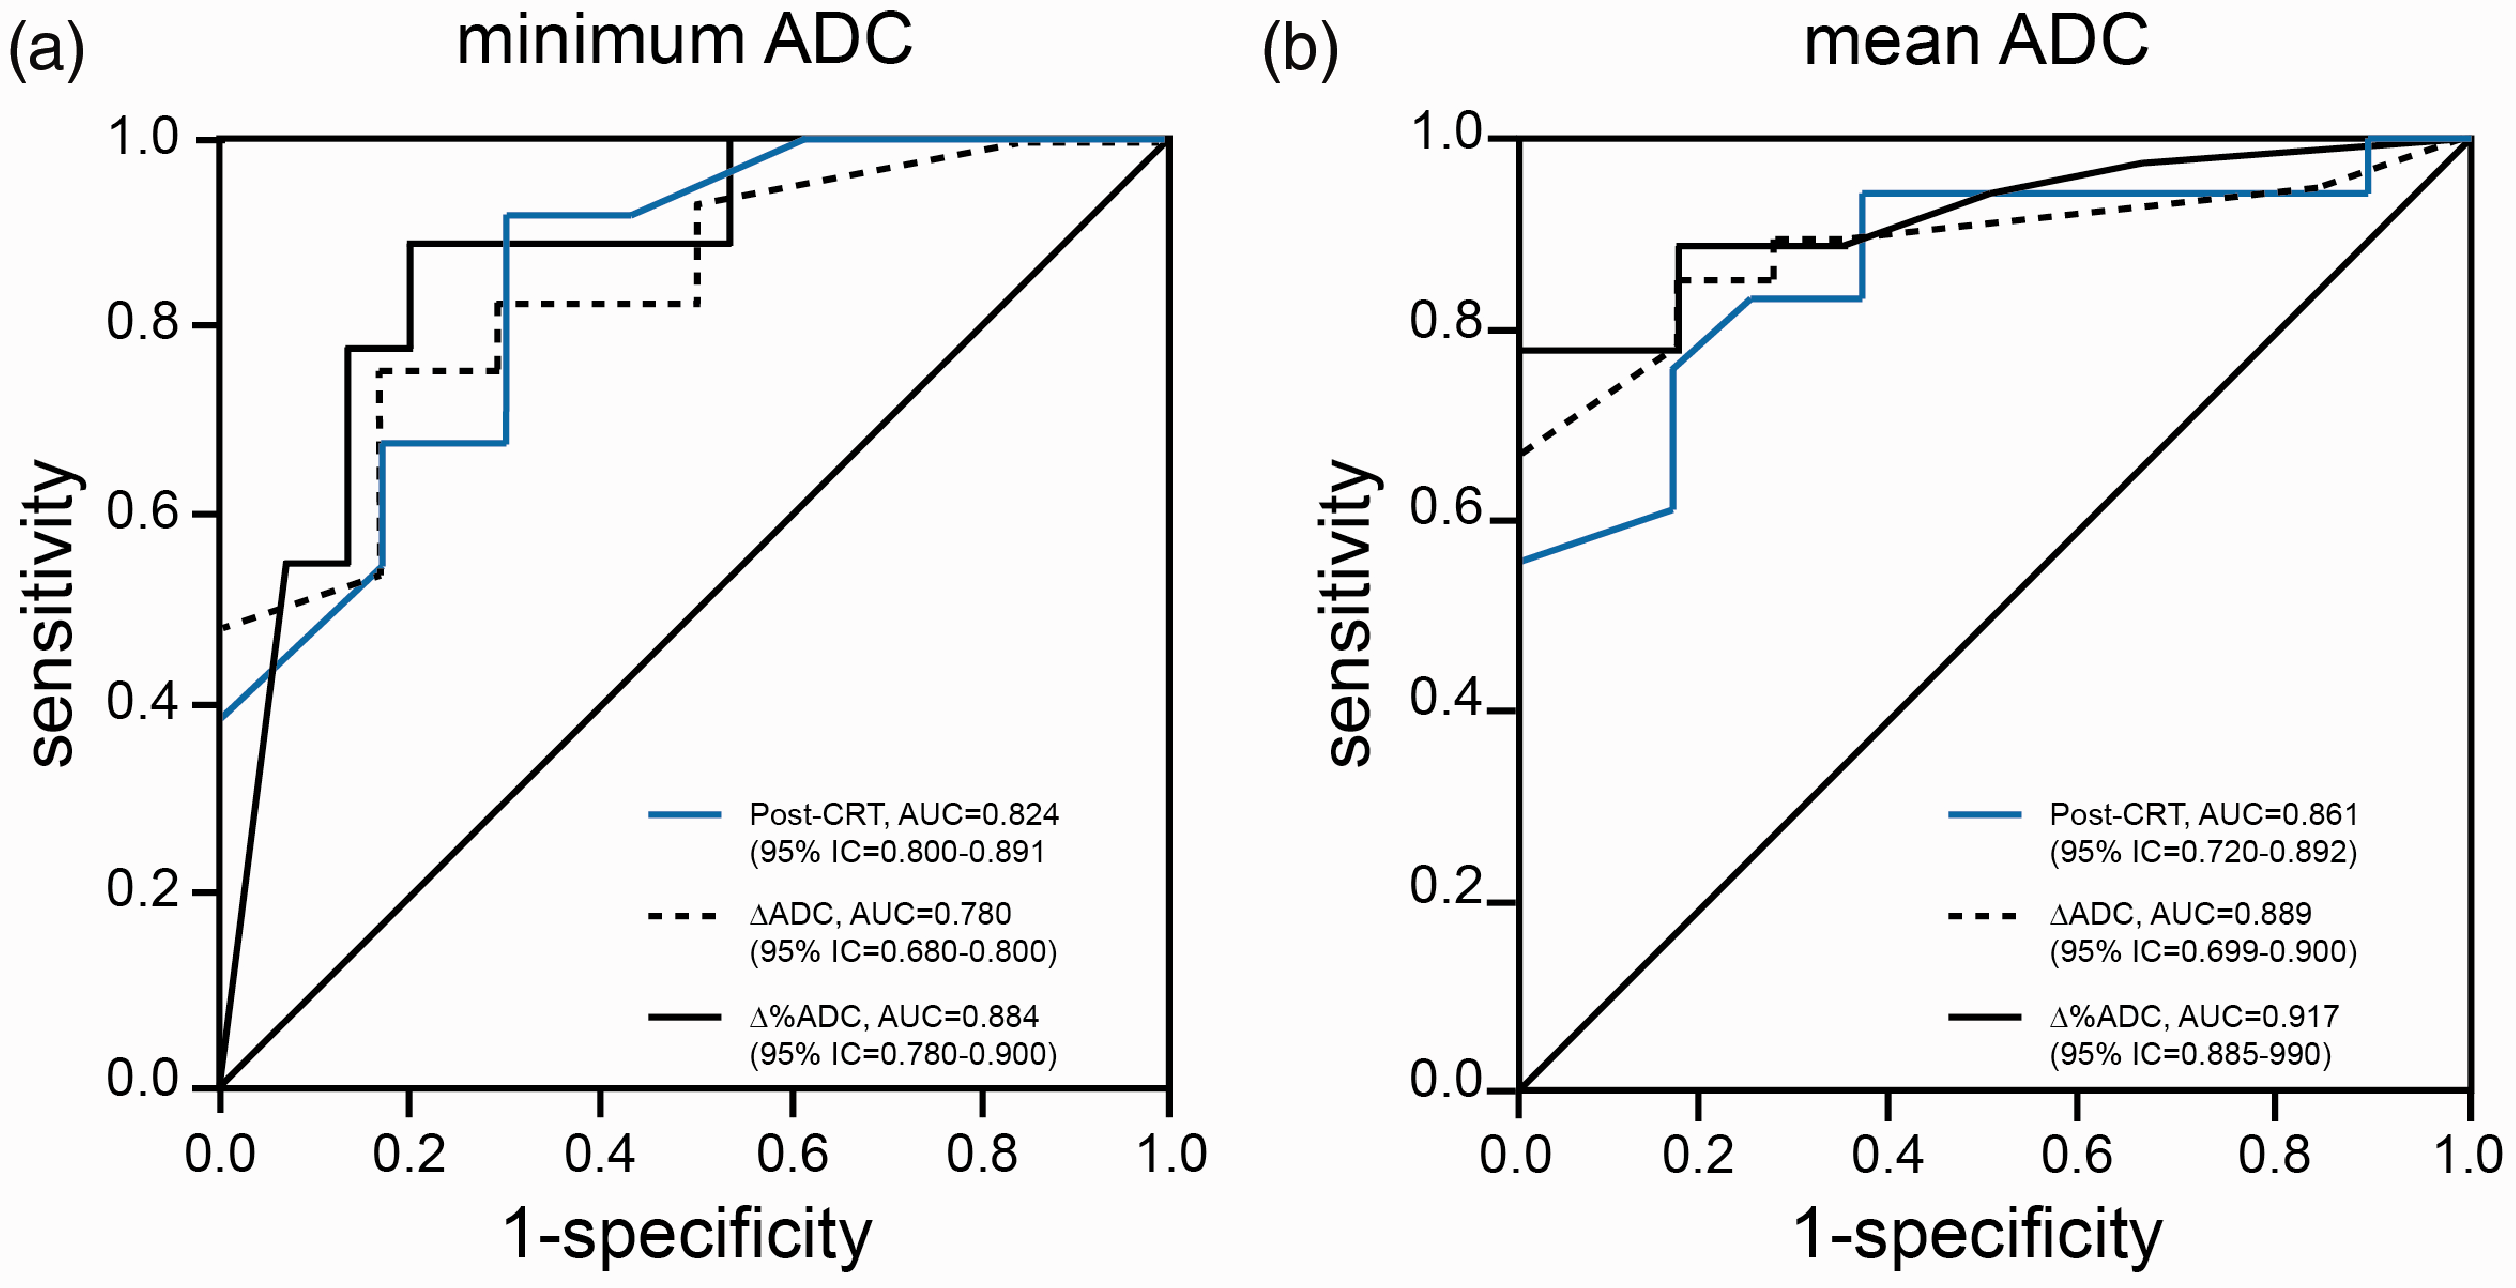
ROC curves displaying the diagnostic performances of the three ADC-based markers (Post-CRT, ΔADC, and Δ%ADC) in the identification of responders to nCRT. (a) Analysis of the minimum ADC values; (b) analysis of the mean ADC values. ADC, apparent diffusion coefficient; nCRT, neoadjuvant chemoradiation treatment; ROC, receiver operating characteristic.
Diagnostic performance of ADC values to predict nCRT response in patients with LARC.
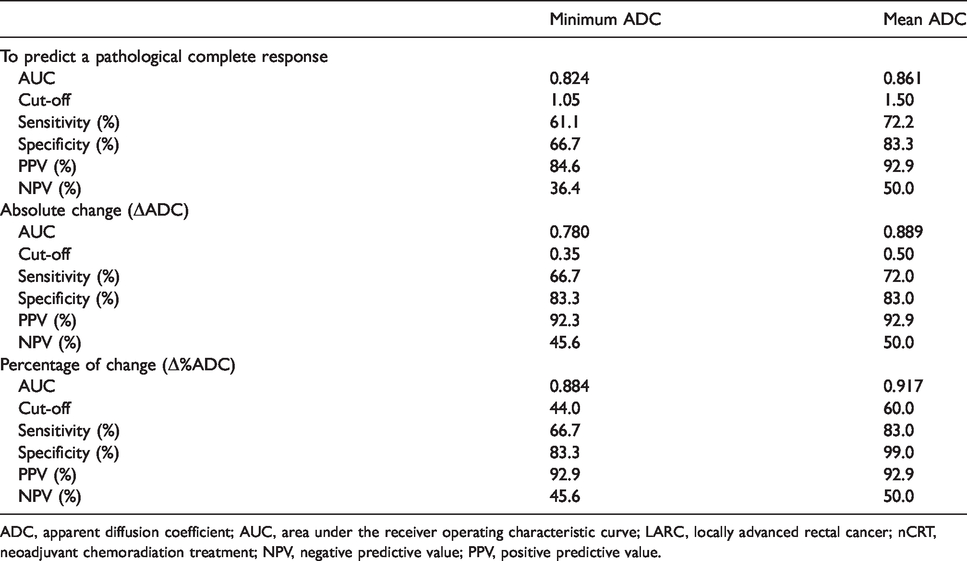
ADC, apparent diffusion coefficient; AUC, area under the receiver operating characteristic curve; LARC, locally advanced rectal cancer; nCRT, neoadjuvant chemoradiation treatment; NPV, negative predictive value; PPV, positive predictive value.
Discussion
By measuring the ADC values, DWI was shown to be more valuable when monitoring tumor response than morphologic MRI. The focus of this study was to determine the diagnostic performance of pre- and post-nCRT ADC values (minimum and mean), together with their absolute and relative changes (ΔADC and Δ%ADC).
In recent years, increasing numbers of reports have focused on quantitative imaging approaches to assess the response to nCRT in rectal cancer. The most commonly investigated approach is to quantitatively measure the tumor ADC and determine the change in ADC as a result of nCRT (25–30). Both the final ADC post-nCRT and the ΔADC have repeatedly been reported to be significantly higher in patients with LARC who demonstrate a good response when compared with non-responders (26–29).
From a histopathological point of view, we divided our population into two groups: R and non-R patients, obtaining statistically significant differences between basal and post-nCRT ADC values (minimum and mean) in R, while no statistically significant differences were found for either ADCmin or ADCmean in non-R patients. In addition, no changes were observed in both minimum and mean basal ADC values between R and non-R, confirming that ADC values at baseline are not good indicators of treatment response in LARC (7). On the other hand, numerous studies of rectal cancer that have investigated ADC changes after nCRT support our observations in the R group (27,28,31–33). At physiology, increased ADC values after nCRT appear to be correlated with the histologic presence of treatment-induced apoptosis, characterized by the loss of tumor structure integrity. During the apoptotic process, initial cellular swelling is followed by a reduction in cell volume due to membrane blebbing and cell fragmentation into apoptotic bodies (7). As apoptotic cells do not release their cellular constituents into the surrounding interstitial tissue and are quickly phagocytosed by macrophages or adjacent normal cells, there is essentially no inflammatory reaction (34–36). This results in a relative increased displacement of water molecules in the intracellular and extracellular compartments and between them. Consequently, increased ADC values may be observed. Conversely, the absence of an ADC variation is related to lesions in which the treatment does not produce similar changes; these lesions have a higher risk of future recurrence (7).
The determination of cut-off points for post-treatment ADC values indicates moderate to high levels of sensitivity, specificity and positive predictive value (PPV). For example, for an ADCmean cut-off of 1.50 × 10⁻³ s/mm2, the recorded values were 72.2%, 83.3%, and 92.9%, for sensitivity, specificity, and PPV, respectively. Meanwhile, the sensitivity, specificity, and PPV for an ADCmin cut-off point of 1.05 × 10⁻³ s/mm2 were 61.1%, 66.7% and 84.6, respectively. According to the literature, the diagnostic performance of the ADC cut-off points of 1.2–1.4 × 10⁻³ s/mm2 is in the range of 46%–100% for sensitivity in the evaluation of nCRT response in patients with rectal cancer. Significant differences are also found for specificity (56%–84%) and PPV (27%–52.4%) (37). Since the ADC calculation is affected by several factors, such as image quality, ROI placement, and the spatial resolution of DWI, there is considerable variability in the diagnostic performance previously reported for post-treatment ADC values, and the same results may be not reproducible in other centers around the world (38). This suggests the potential limitation of using absolute ADC values to evaluate treatment response and supports the role of a relative values such as Δ%ADC as a more reliable tool in this setting.
We also demonstrated that changes (ΔADC) in both ADCmean and ADCmin between MRI1 and MRI2 were greater among the tumors that respond completely to treatment than in non-R. Our evaluation of the change in the mean tumor ADC value showed that with an increase of 60% between the two MRI exams (which is equivalent to 0.50 points of change between pre- and post-treatment ADCmean values), DW-MRI had a sensitivity of 83% and a specificity of 99% in the prediction of a pathological complete response after nCRT, with a PPV of 92.9%. In addition, we estimated a sensitivity of 66.7%, a specificity of 83.3%, and a PPV of 92.9% for a cut-off point of 44% for Δ%ADCmin (or 0.35 points of change between pre- and post-treatment ADCmin values). These results are in line with the study carried out by Monguzzi et al. (37), which showed the clinical application of a cut-off of ≈60% for Δ%ADC when discriminating a complete response with moderate sensitivity (≈60%) and specificity (≈60%), and high PPV (≈80). Similarly, Kim et al. (26) reported that an ADC percentage change of 42% might be a useful predictor of pathologic complete remission, with a sensitivity of 100% and specificity of 78% (26).
To our knowledge, the PPVs for the percent change in ADC values reported here are higher than those reported in previous studies (16,19,25,27–30,39–41). It is well-known that high specificity and high PPV are the ideal properties to confirm a diagnosis (42). In other words, a high true-negative rate (true negatives are patients with incomplete pathological response) leads to the best clinical outcome when the costs of false-positive results are high. In future, it would be desirable to validate these cut-off values in a prospective study in order to corroborate their diagnostic performance.
Finally, we showed that the diagnostic performance of the ADCmean was, in general, higher than the performance of the minimal ADC. This result differs from the hypothesis that ADCmin is more related to tumor cellularity than the ADCmean (43). However, it is known that the different growth mode and growth speed of tumor cells can result in different extracellular volumes and nucleus cytoplasm ratios. As a result, it is hard to select the highest intratumor cellular zone that is influenced by window level and width (43,44). Therefore, the diagnostic strength of the ADCmin and ADCmean cannot be compared, as they were liable to being subjective, although we consider it important to show the analysis from both ADC values in order to demonstrate the reproducibility of our data.
The present study has some limitations. First, this is a preliminary stage of our investigation. Therefore, the use of consensus in the interpretation of MRI findings was foreseeable. Additionally, the study population is small, and a prospective validation of the retrospectively obtained thresholds in larger patient populations is warranted. We are aware that the cut-off points calculated here require corroboration, ideally, in a prospective study due to the small sample size. However, there are other reports that have included 20–40 patients demonstrating consistent results and methodological approaches that favor the accuracy and reproducibility of the generated data through these works (9,25–27,29,30). Finally, multiple time points during and after neoadjuvant treatment should be considered. As treatment-induced alterations are time-dependent, finding an optimal time point is essential to ensure a high enough level of accuracy.
In conclusion, with the use of a 3-T MR scanner, our preliminary results suggest that ADC values, as well as the ΔADC, may be useful as an imaging indicator for monitoring therapeutic response of LARC to nCRT.
Footnotes
Declaration of conflicting interests
The author(s) declared no potential conflicts of interest with respect to the research, authorship, and/or publication of this article.
Funding
The author(s) received no financial support for the research, authorship, and/or publication of this article.