
Abstract
Background
Hepatic computed tomography (CT) with decreased peak kilovoltage (kVp) may be used to reduce contrast medium doses in patients at risk of contrast-induced acute kidney injury (CI-AKI); however, it increases image noise. To preserve image quality, noise has been controlled by X-ray tube loading (mAs) compensation (TLC), i.e. increased mAs. Another option to control image noise would be to use iterative reconstructions (IR) algorithms without TLC (No-TLC). It is unclear whether this may preserve image quality or only reduce image noise.
Purpose
To evaluate image quality of 80 kVp hepatic CT with TLC and filtered back projection (FBP) compared with 80 kVp with No-TLC and IR algorithms (SAFIRE 3 and 5) in patients with eGFR <45 mL/min.
Material and Methods
Forty patients (BMI 18–32 kg/m2) were examined with both protocols following injection of 300 mg I/kg. Hepatic attenuation, image noise, enhancement, signal-to-noise ratio (SNR), contrast-to-noise ratio (CNR), and subjective image quality were evaluated for each patient.
Results
Comparing TLC/FBP with No-TLC/IR-S5, there were no significant differences regarding hepatic attenuation, image noise, enhancement, SNR and CNR: 114 vs. 115 HU, 14 vs. 14 HU, 55 vs. 57 HU, 8.0 vs. 8.4, and 3.8 vs. 4.0 in median, respectively. No-TLC/IR-S3 resulted in higher image noise and lower SNR and CNR than TLC/FBP. Subjective image quality scoring with visual grading showed statistically significantly inferior scores for IR-S5 images.
Conclusion
CT of 80 kVp to reduce contrast medium dose in patients at risk of CI-AKI combined with IR algorithms with unchanged tube loading to control image noise does not provide sufficient diagnostic quality.
Keywords
Introduction
In patients at risk of contrast medium-induced acute kidney injury (CI-AKI) following contrast-enhanced computed tomography (CT), the contrast medium dose may be reduced by decreasing the X-ray tube potential from the traditionally used 120 peak kilovoltage (kVp) to 80 kVp. This will move the X-ray spectrum closer to the iodine k-edge of 33.2 keV and increase the attenuation of iodine. At the same time, image noise increases by roughly a factor of 2 (1–3). Since noise is proportional to the inverse square root of the dose according to Poisson statistics (3), X-ray tube loading milliampere seconds (mAs) must be increased by a factor of 4 to keep image noise unchanged. This approach has been successfully used for CT angiography of pulmonary arteries (4,5), renal arteries (6), and abdominal aortic aneurysms (7) and hepatic scanning (8–11).
Tube loading compensation (TLC) by a factor of 4 at 80 kVp relative to 120 kVp may imply certain drawbacks. First, the required tube loading may exceed the power limits of the X-ray tube, especially for larger patients, and result in unacceptable image noise and ring and streaking artifacts (12). Second, to reach sufficient effective tube loading by increasing rotation time and decreasing pitch, scan time increases with the risk of breathing artifacts and that the contrast medium bolus outruns the scanning area in CT angiography. Third, the size-specific dose estimate may increase by 50% radiation dose to the patient (10). Finally, it may result in a shorter life expectancy of the X-ray tube due to increased tube wear. These drawbacks have effectively hindered a more widespread use of low kVp protocols. The introduction of iterative reconstruction (IR) algorithms as a way to control image noise was initially promoted as a way to reduce radiation dose; but could they also be used as an alternative to TLC? In a phantom study it was shown that the discernibility of low contrast objects was similar for 120 kVp with traditional filtered back projection (FBP), 80 kVp with four times TLC and FBP, and 80 kVp with the highest strengths of IR and without using TLC (No-TLC) (2).
The aim of this paired study was to compare image noise and objective and subjective image quality of hepatic parenchymal contrast enhancement in the portal venous phase and image noise between 80-kVp CT using TLC and FBP with 80 kVp using IR algorithms and No-TLC in patients at risk of CI-AKI.
Material and Methods
Forty elective patients with an estimated glomerular filtration rate (eGFR) <45 mL/min scheduled for contrast-enhanced hepatic CT were prospectively included (June 2015 to March 2016) and examined with two 80-kVp protocols, one with TLC and FBP, and one with No-TLC and IR when the present CT scanner was available. eGFR was calculated using the revised Lund–Malmö formula (13). Any pre-contrast scan was performed at 120 kVp. No specific CI-AKI prophylactic regimens were instituted apart from encouraging outpatients to drink abundantly before and after the CT examination and recommending the ward to ensure adequate hydration of inpatients before and after the CT examination. The ethical principles followed the Declaration of Helsinki. The study was reviewed and approved by the Regional Ethical Board in Lund, Sweden (Dnr 2015/63). All patients gave written informed consent. Indications included surveillance of malignant disease (n = 35) and suspected malignancy (n = 5). The 80-kVp protocol with TLC/FBP has previously been compared with our standard 120-kVp protocol as control yielding similar image quality (11).
CT scanning protocol
All examinations were performed with a Somatom Definition Flash Dual-source CT (Siemens Healthineers, Forchheim, Germany) using a single X-ray source. Tube current modulation (Care Dose 4D) was used and the adjustment strength was according to the default setting average/average. The automated tube voltage selection (Care kV) was set to off. First, 10 cm of the liver was scanned in the caudal–cranial direction in the portal venous phase at 80 kVp using the standard quality reference effective tube loading (170 mAs) setting for our 120-kVp protocol (No-TLC). Second, this was immediately (delay 4–5 s) followed by scanning of the entire liver in the cranial–caudal direction at 80 kVp with TLC using a quality reference effective tube loading of 680 mAs (4 × 170 mAs) during the same breath-hold from above the hemidiaphragms to the ischial tuberosity. To reach a sufficiently high effective X-ray tube loading during the second scanning, the pitch was decreased to 0.5. Images of the first scanning were reconstructed using Siemens Sinogram Affirmed Iterative Reconstructions (SAFIRE) strengths S3 and S5 (No-TLC/IR-S3 and S5), while images of the second scanning were reconstructed using filtered back projection (TLC/FBP). The selectable strength setting in the range of 1–5 of SAFIRE determines the level of noise reduction, strength 1 being noisier and strength 5 being smoother.
All contrast medium injections (iohexol 350 mg I/mL, Omnipaque, GE Healthcare, Danderyd, Sweden) in an antecubital vein were performed with a power injector. The individual volumes and injection rates were calculated using a dedicated computer program (OmniVis/OmniJect version 5.1, distributed by GE Healthcare). Scanning and injection parameters are presented in Table 1.
80-kVp hepatic CT scanning and contrast medium injection parameters with TLC and FBP or IR with SAFIRE strength S3 and S5 and No-TLC.
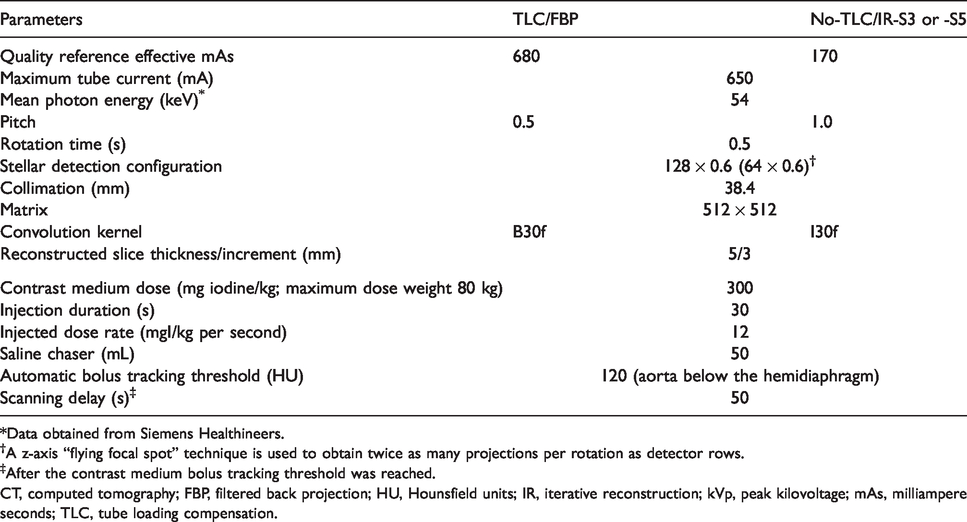
*Data obtained from Siemens Healthineers.
†A z-axis “flying focal spot” technique is used to obtain twice as many projections per rotation as detector rows.
‡After the contrast medium bolus tracking threshold was reached.
CT, computed tomography; FBP, filtered back projection; HU, Hounsfield units; IR, iterative reconstruction; kVp, peak kilovoltage; mAs, milliampere seconds; TLC, tube loading compensation.
Objective image quality
Attenuation and noise were measured on a PACS workstation (SECTRA, Linköping, Sweden). Post-contrast hepatic mean attenuation (Hounsfield units [HU]) and image noise (1 SD of the mean attenuation, HU) were measured in regions of interest (ROI) of 10–20 mm in diameter, carefully placed to avoid visible vessels and bile ducts. The measurements were performed at three different levels in the liver: principally about 3 cm distal to the right hemidiaphragm; at the level of the liver hilum; and about 3 cm proximal to the caudal edge of the liver. Care was taken to use levels as similar as possible when measuring on the TLC/FBP and No-TLC/IR scans. At each level, three measurements were performed, one ventrally and one dorsally in the right lobe, and one in the left lobe (Fig. 1). The nine measurements were then averaged to a mean hepatic attenuation (HUpost-Liver) and mean image noise (SDLiver) value for each patient. When available, pre-contrast hepatic attenuation was measured at the corresponding locations at the level of the liver hilum and then averaged (HUpre-Liver) using the TLC/FBP scan. The mean post-contrast attenuation of the rectus abdominis muscle (HUmuscle) was measured on the TLC/FBP scans using a ROI of 5–10 mm, carefully placed to avoid fatty tissue. Pre-contrast and rectus muscle attenuation were not measured on the No-TLC/IR images since iterative reconstruction is not supposed to affect the attenuation. Based on these measurements, hepatic enhancement (HUpost-Liver – HUpre-Liver), signal-to-noise ratio (SNR; HUpost-Liver/SDLiver) and contrast-to-noise ratio (CNR; HUpost-Liver – HUmuscle/SDLiver) were calculated. Post-contrast attenuation was measured in the aorta at the level of the liver hilum and in the main portal vein.

Hepatic CT demonstrating attenuation measurements in three regions of interest about 15 mm in diameter, one each in the ventral and dorsal part of the right liver lobe and one in the left liver lobe. Medel, mean attenuation in Hounsfield units; Avvikelse, 1 SD of mean attenuation as a measure of image noise.
Subjective image quality
A subjective visual grading characteristics (VGC) assessment (14) was made by four radiologists specialized in musculoskeletal (observer A), neuro- (observer B), and abdominal radiology (observers C and D), with 10–38 years of experience in CT. They individually graded randomized image stacks, blinded to acquisition parameters. Adjustment of window level and width was allowed during the qualitative assessment. The evaluation criteria were based on European guidelines (15) and a 5-point scale was used (Table 2).
Subjective evaluation criteria based on European guidelines (15) and a 5-point scale for grading the agreement of the criteria.

Scoring was done using the ViewDEX software (16) and analyzed using the software VGC Analyzer, version 1.0.2 (17). The software obtains a VGC curve for all observers assembled (random-observer analysis) by plotting the cumulative distributions of rating data for the two protocols compared against each other. The area under the curve (AUCVGC) is used as a measure of the difference between the protocols. An AUCVGC of 0.5 corresponds to equal image quality in the two protocols, an AUCVGC < 0.5 indicates that the image quality is higher for the TLC/FBP protocol, and an AUCVGC > 0.5 indicates that the image quality is higher for the No-TLC/IR protocol. If the 95% confidence interval (CI) of the AUCVGC does not include the value 0.5, a statistically significant difference between the two protocols can be established at the 95% level (14). Although not explicitly analyzed separately, inter-observer variations are considered in the statistical analysis by the resampling technique used to determine the confidence interval of the reported AUCVGC (17). Finally, a retrospective analysis of image texture regarding IR artifacts was performed by one of the authors.
Radiation dose
The volume CT dose index presented by the CT equipment was registered for each scan level used for hepatic post-contrast attenuation measurements, a scan level which should be close to the same for the TLC/FBP and No-TLC/IR scans as stated above.
Statistics
Normal distribution of data was assessed visually and homogeneity in variances was tested for with the F-test. Comparisons regarding objective measurements were done with paired samples t-tests for normally distributed data and the Wilcoxon test for non-normally distributed data. Based on nine randomly chosen duplicated cases, intra-observer agreement was assessed by weighted Cohen’s kappa. The estimated kappa values can be translated as: <0 = no agreement; 0–0.2 = slight agreement; 0.2–0.4 = fair agreement; 0.4–0.6 = moderate agreement; 0.6–0.8 = substantial agreement; and 0.8–1.0 = almost perfect agreement (18). Computations were done using the R statistical package (https://www.r-project.org). After Bonferroni correction for multiple comparisons, the level of statistical significance was set to 0.002.
Results
The basic patient characteristics are presented in Table 3. All patients weighed <90 kg and had a body mass index (BMI) ≤30 kg/m2, except for one patient weighing 101 kg with a BMI of 32 kg/m2.
Pre-procedural basic characteristics of the 40 patients (23 women) undergoing hepatic 80 kVp hepatic CT.

Values are given as median (2.5–97.5 percentiles).
*Reference interval: men: 60–105 µmol/L; women: 45–90 µmol/L.
BMI, body mass index; CT, computed tomography; GFR, glomerular filtration rate.
Objective image quality
The results in terms of contrast medium data, objective image quality, and radiation doses are summarized in Table 4. Despite the time difference between the scans with TLC/FBP and No-TLC/IR, there was no significant difference in post-contrast hepatic attenuation. Image noise, SNR, and CNR of reconstructed images with No-TLC/IR-S5 were in the same range as those with TLC/FBP, while images with No-TLC/IR-S3 had significantly higher image noise and subsequently significantly lower SNR and CNR.
Outcome parameters at 80-kVp hepatic CT with TLC and FBP or IR with SAFIRE strength S3 and S5 and no TLC.

Values are given as median (2.5–97.5 percentiles).
*n = 32 performed at 120 kVp.
CTDIvol, volume pitch-corrected CT dose index; CNR, contrast-to-noise ratio; CT, computed tomography; FBP, filtered back projection; HU, Hounsfield unit; IR, iterative reconstruction; kVp, peak kilovoltage; mAs, milliampere second; mGy, milligray; NA, not available; SD, 1 standard deviation; SNR, signal-to-noise ratio; TLC, tube loading compensation.
Subjective image quality
In the VGC analysis for all observers assembled, the 95% CI did not reach 0.5 for any of the eight criteria indicating that the scans with No-TLC/IR-S3 or -S5 were scored significantly lower than the TLC/FBP scans (Fig. 2). Intra-observer agreement assessed by weighted Cohen’s kappa was 0.71 (substantial agreement) for all criteria and all four observers assembled.
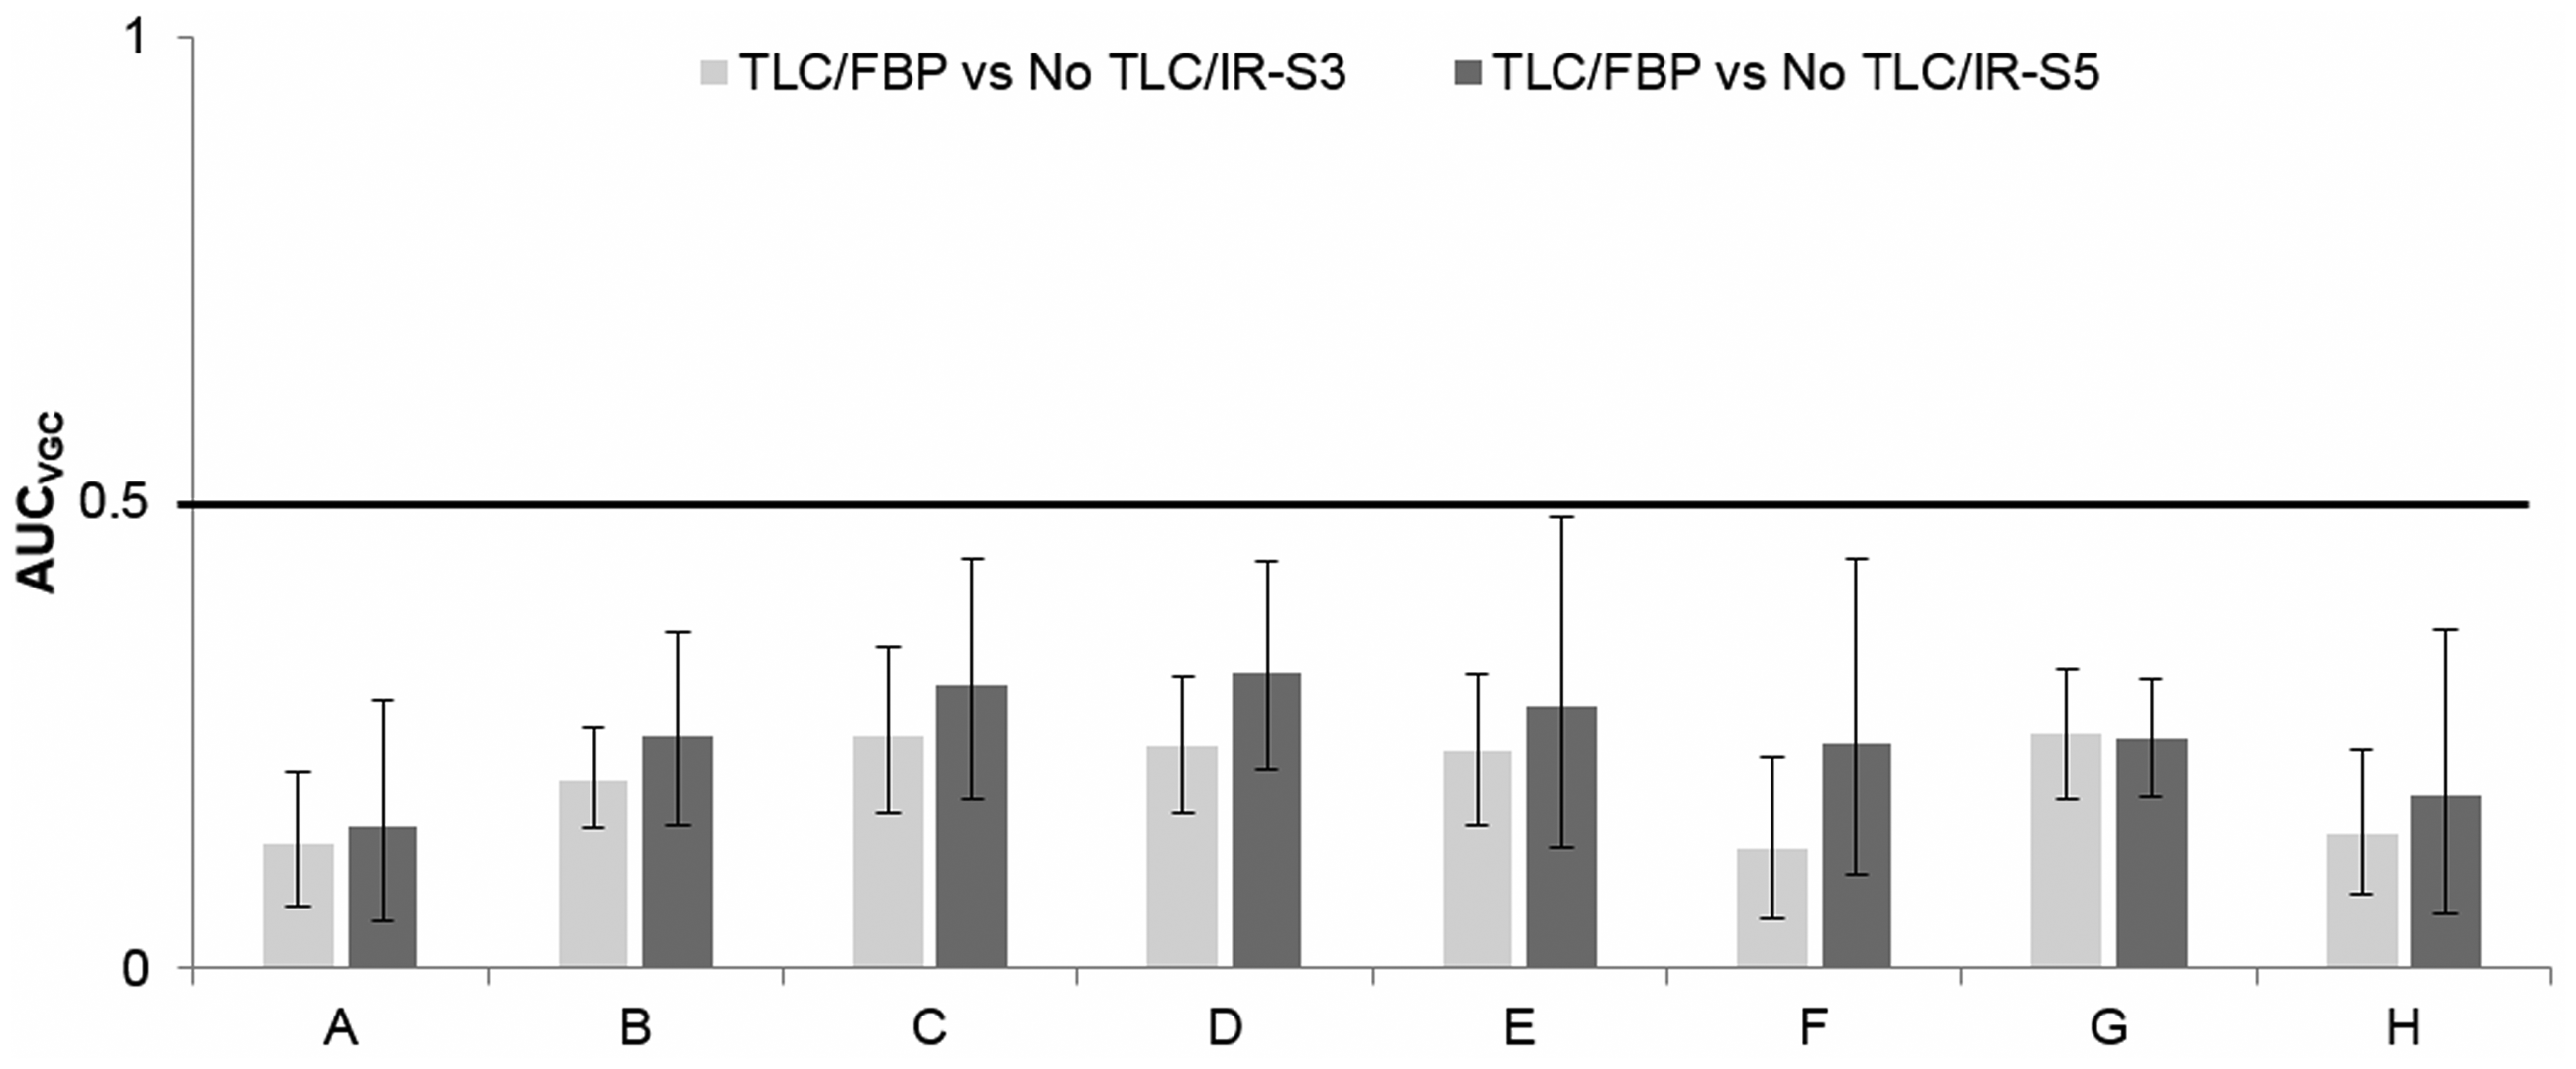
Area under the curve of subjective visual grading characteristics (AUCVGC) for the eight items (a–h) and with 95% confidence intervals (CI) outlined for all observers assembled (random-observer analysis) based on the trapezoid VGC curve. A 95% CI not reaching 0.5 indicates that the 80-kVp scans with 680 quality reference effective mAs (tube loading compensation [TLC]) and filtered back projection (FBP) scans were significantly better than the 80-kVp scans with 170 quality reference effective mAs (No-TLC) with iterative reconstruction (IR) algorithm SAFIRE strength S3 (No-TLC/IR-S3) and S5 (No-TLC/IR-S5).
Ratings of all eight criteria less than grade three (confident or somewhat confident that the criterion was not fulfilled) by the four observers increased from 8% with TLC/FBP to 39% and 34% with No-TLC/IR-S3 and -S5, respectively (Table 5). Ratings of overall image quality (item H) less than grade three of images reconstructed with No-TLC/IR-S3 increased substantially by all four observers compared with TLC/FBP but only by three of the observers when No-TLC/IR-S5 images were evaluated (Fig. 3).
Ratings less than grade 3 on subjective evaluation of the eight scored items (n = 320 per observer, total 1280) of the individual observers in the cohorts with TLC and FBP, and IR with SAFIRE strength S3 and S5 and no TLC.

Values are given as n (%).
FBP, filtered back projection; IR, iterative reconstruction; TLC, tube loading compensation.
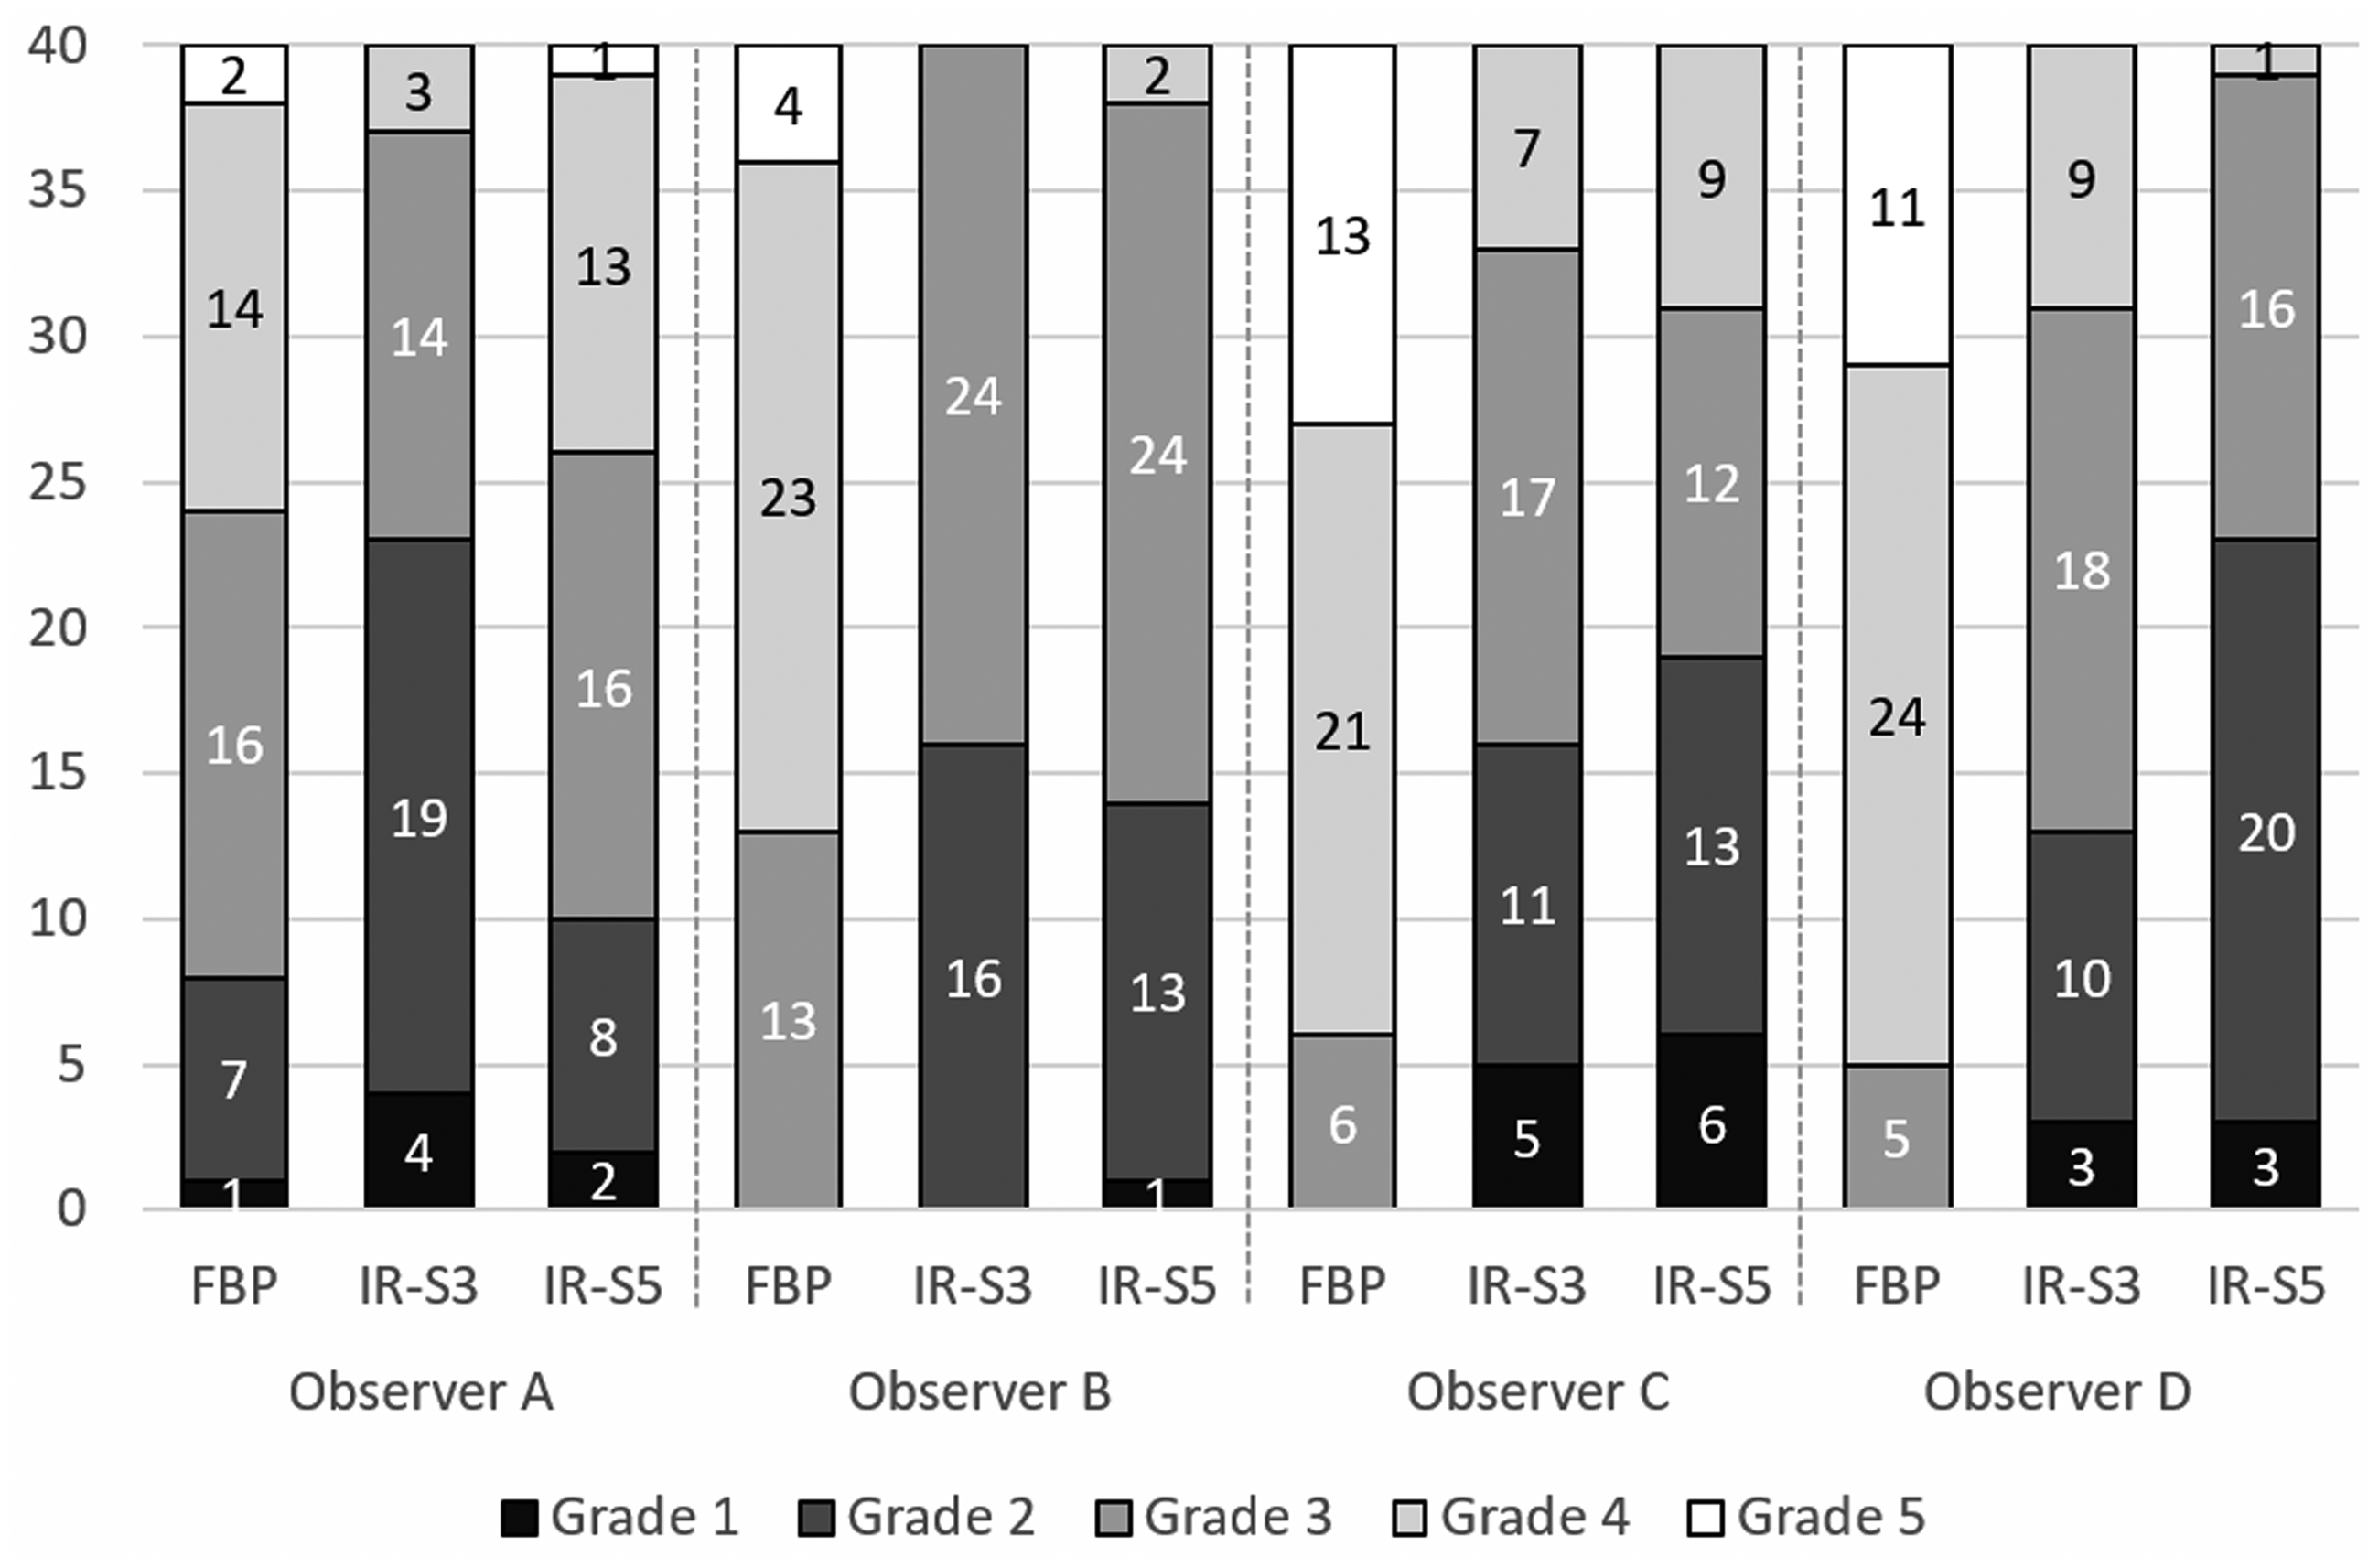
Number of ratings grade 1–5 regarding subjective evaluation of overall image quality (score item H) of images reconstructed with tube loading compensation (680 quality reference effective mAs) and filtered back projection (FBP) in comparison with iterative reconstruction (IR) with SAFIRE strength S3 and S5 and no tube loading compensation (170 quality reference effective mAs). The ratings range from 1 (lowest) to 5 (highest) subjective overall image quality.
A retrospective analysis revealed that the IR scans with increasing SAFIRE strength were associated with an increased pixelated and blotchy appearance which, for example, affected the interface between the liver parenchyma and the liver veins (Fig. 4), and occasionally the detection of small lesions (Fig. 5).
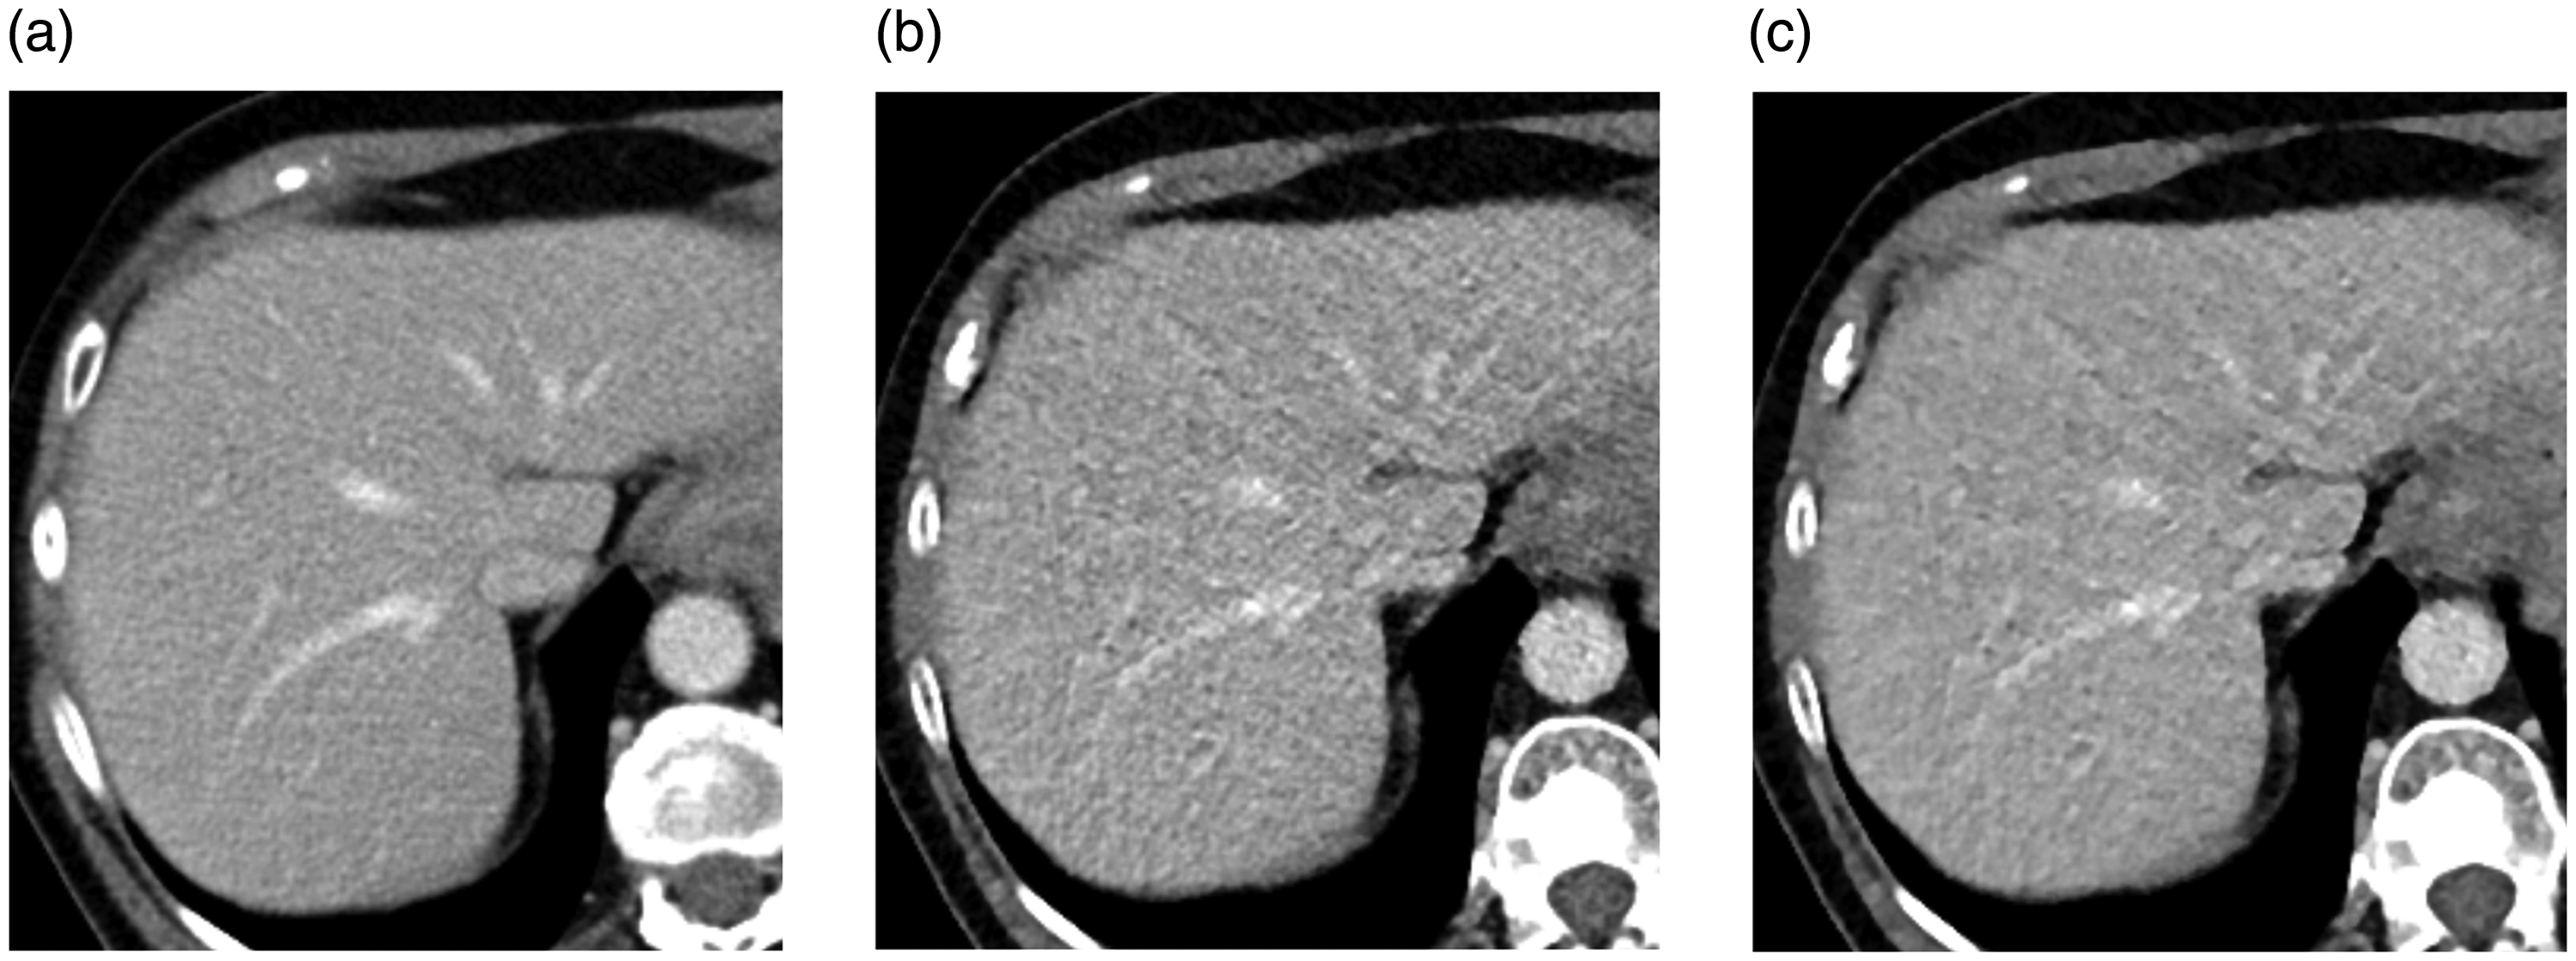
The interface between liver parenchyma and liver veins at 80-kVp hepatic CT with (a) 680 quality reference effective mAs and filtered back projection, (b) 170 quality reference effective mAs and iterative reconstruction (IR) with SAFIRE strength S3, and (c) 170 quality reference effective mAs and IR with SAFIRE strength S5. Hepatic attenuation and image noise were (a) 125 and 13 HU, (b) 128 and 19 HU, and (c) 128 and 14 HU, respectively.

80-kVp hepatic CT demonstrating a 6-mm lesion in (a, arrow) measuring 45 HU, not clearly visible in (b) or (c). (a) 680 quality reference effective mAs and filtered back projection, (b) 170 quality reference effective mAs and iterative reconstruction (IR) with SAFIRE strength S3, and (c) 170 quality reference effective mAs and IR with SAFIRE strength S5. Hepatic attenuation/image noise/contrast-to-noise ratio were (a) 110 HU/10 HU/6.6, (b) 107 HU/18 HU/3.4, and (c) 108 HU/12 HU/5.3, respectively.
Discussion
The results indicate that objective image noise may be preserved at hepatic scanning when switching from 120 kVp to 80 kVp and controlling image noise merely by using SAFIRE strength S5 for iterative reconstructions instead of using four times the increase in tube loading and FBP reconstruction. On the other hand, SAFIRE strength S3 could not maintain image noise. However, subjective image quality with No-TLC/IR-S5 was scored significantly lower for all eight items when using IR than when using TLC/FBP, not least regarding the interface between the liver parenchyma and the liver veins. A retrospective analysis revealed a pixelated and blotchy appearance of the IR images, which had an impact on lesion detectability in a few instances, though there were too few lesions to permit a real analysis of detectability of low-contrast objects. These results are contradictory to the results of a previous phantom study that showed that the discernibility of low-contrast objects was similar for 120 kVp/FBP and 80 kVp/SAFIRE S5 at the same tube loading (2).
Subjective assessment often depends on reader preference, comfort level with image appearance, personality (i.e. the ability to deal with changes in image appearance), and years of experience, rather than a true assessment of quality (19). Though the observers were blinded to the type of image reconstruction, the blotchy, pixelated appearance of the IR images make them readily recognizable why significant adaptation or recognition bias (20) cannot be excluded in the present study.
In accordance with the present results, Karla et al. (21) noted similar image noise at 120 kVp/200 mAs/FBP and when 120 kVp was combined with 50% and 75% reduction in tube loading and SAFIRE strength S1–S2 and S3–S4, respectively. However, SAFIRE S3–S4 caused a blotchy, pixelated appearance of the IR images. This led to lower lesion conspicuity and compromised diagnostic confidence with the SAFIRE-enabled images at a 75% dose reduction, while these items were preserved at a 50% dose reduction combined with SAFIRE S1–S3. They never used SAFIRE S5 as they thought it was associated with an excessively pixelated and blotchy appearance of the images. Park et al. (22) found that 120 kVp/full dose/FBP and 120 kVp/simulated half dose/SAFIRE S2 showed similar image noise, lesion-to-liver CNR, and diagnostic performance regarding liver metastases. Yu et al. (23) found that 80-kVp half dose (300 mAs) scans combined with SAFIRE S4 and S5 reconstruction resulted in significantly lower image noise, significantly higher lesion conspicuity of hepatocellular carcinoma, and comparable lesion detection compared with the full dose (600 mAs) 80-kVp scans with FBP reconstruction. However, more recent multi-reader phantom and clinical studies report that when radiation exposure is reduced by about 25% or more, IR, including model-based algorithms, do not improve observer performance for detection of low-contrast hepatic lesions, compared with FBP (24–28). IR algorithms may only improve the detectability of small low-contrast lesions within a very limited radiation range, at the level where the detection ability declines with FBP (24,28). In fact, the variation in diagnostic performance among radiologists exceeds the differences among reconstruction algorithms (28).
A strength of the present study was the paired design comparing the two noise-controlling techniques in the same patient. Though there was a time delay of 4–5 s between the two scans, post-contrast hepatic attenuation was the same. A limitation of our study was that we did not evaluate the diagnostic accuracy of our technique with respect to liver tumors; rather, we focused on comparing objective versus subjective image quality. Secondly, only one radiation dose level was evaluated in combination with the IR algorithms instead of using a partial tube loading compensation combined with an IR setting of moderate strength. Thirdly, only two of the four observers were abdominal radiologist which may have affected the ratings. Fourth, the study only included one type of IR algorithm and no recent model-based iterative reconstructions.
In conclusion, when switching X-ray tube potential from 120 kVp to 80 kVp to enable reducing the contrast medium dose in patients at risk of CI-AKI, the use of SAFIRE IR algorithms to keep image noise unchanged, instead of increasing tube loading with a factor of 4, does not provide acceptable image quality due to IR-specific artifacts. The present study also indicates that we cannot comfortably rely only on the measurable image noise, CNR, or SNR when adapting CT protocols to include IR algorithms. Further studies are needed to optimize the combination of radiation dose reduction and IR algorithms to replace full TLC.
Footnotes
Declaration of conflicting interests
The author(s) declared no potential conflicts of interest with respect to the research, authorship, and/or publication of this article.
Funding
The author(s) received the following financial support for the research, authorship, and/or publication of this article: This work was supported by the Torsten and Karin Almén’s foundation.