
Abstract
Background
Obesity is a major public health disorder associated with multiple co-morbidities. Knee magnetic resonance imaging (MRI) permits visualization of the subcutaneous fat anatomy, which can be correlated to body mass index (BMI) and obesity-related co-morbidities.
Purpose
This study intends to validate a method of correlating measurements of subcutaneous fat around the distal femur on axial MR images to BMI and obesity-related co-morbidities.
Material and Methods
The most proximal axial slice of each knee MRI was divided into four quadrants. Measurements of the thickest portion of the subcutaneous fat in each quadrant were independently obtained, yielding a value which was assigned the name of the SubCut fat index. The relationship between the SubCut fat index of each quadrant and the patient’s BMI was then evaluated. Receiver operating characteristic curves utilizing both the subcutaneous fat in the medial and lateral quadrants as well as BMI were performed with respect to obesity-related co-morbidities.
Results
SubCut fat index measurements in all four quadrants and BMI show the strongest correlation (all four, ANOVA P < 0.0001, r = 0.6), with subcutaneous fat measurements of the anterior medial (p < 0.0001) and posterior medial quadrants (P = 0.01). Additionally, BMI and medial quadrants SubCut indices showed strong association with obesity-related co-morbidities including sleep apnea, asthma, diabetes, hypertension, gastroesophageal reflux disease, and osteoporosis.
Conclusion
The SubCut fat index, a marker of distal femur subcutaneous fat on axial MRI, correlates with severity of obesity (BI) and associated obesity-related co-morbidities.
Introduction
Magnetic resonance imaging (MRI) of the knee is one of the most common musculoskeletal radiologic procedures performed today, as its indications are numerous (1). It yields proper assessment of the cruciate and collateral ligaments, making it the preferred imaging modality for evaluating internal derangement of the knee (2). The utility of knee MRI is further demonstrated in its ability to provide detailed imaging of the subcutaneous fat, a parameter intimately associated with obesity (3–5).
According to the World Health Organization (WHO), obesity is defined as a body mass index (BMI) ≥30 kg/m2 (6). The negative health consequences of obesity and its connection to various morbidities have been understood for many years (7). Obesity, along with other cardiovascular risk factors such as diminished high-density lipoprotein (HDL) cholesterol (<40 mg/dL [1.03 mmol/L] in men and <50 mg/dL [1.29 mmol/L] in women) and elevated fasting plasma glucose (FPG; ≥100 mg/dL [5.6 mmol/L]), are part of a cluster of cardiovascular risk factors known as the metabolic syndrome, which has been estimated to affect more than a third of the world’s adult population (8). The National Cholesterol Education Program’s Adult Treatment Panel III report (ATP III) defined metabolic syndrome as the conglomeration of abdominal obesity, atherogenic dyslipidemia, hypertension (HTN), insulin resistance ± glucose intolerance, and proinflammatory and prothrombotic states (9).
This study aims to validate a method of correlating measurements of the subcutaneous fat around the distal femur on axial MR images to BMI, as well as predicting obesity associated complications including diabetes, HTN, gastroesophageal reflux disease (GERD), hypothyroidism, chronic obstructive pulmonary disease (COPD), osteoporosis, asthma, anemia, renal function, osteoporosis, and dyslipidemia.
Material and Methods
Patient population
A waiver of informed consent was obtained from the institutional review board for this HIPAA-compliant retrospective study. A database search was performed to identify consecutive individuals who presented for a knee MRI between March of 2012 and April of 2014. Our inclusion criteria focused on skeletally matured patients aged 25–80 years presenting with a chief complaint of “atraumatic” or “non-traumatic” knee pain, which is one of the most common reasons for a knee MRI examination. Our exclusion criteria encompassed patients with conditions that could alter the normal subcutaneous fat anatomy such as previous surgery including arthroplasty, history of infection, eating disorders, and history of recent trauma (traumatic subcutaneous injury may present with swelling that would overestimate normal subcutaneous fat measurements). This information was obtained directly from the medical records. Our patient population included a total of 518 individuals with 528 knees imaged. Demographic information including patients’ ages, weights, and BMIs was gathered. Patients’ charts were reviewed and data were obtained regarding different laboratory values including hemoglobin/hematocrit, calcium, phosphate, low-density lipoprotein, HDL, blood urea nitrogen, creatinine, glucose, erythrocyte sedimentation rate, and C-reactive protein levels. Lastly, information regarding clinical history of smoking, sleep apnea, COPD, asthma, HLD, diabetes, HTN, GERD, hypothyroidism, osteoporosis, and vitamin D deficiency was collected from medical records. Only laboratory values measured within three months from the MRI examination were considered. Relevant aspects of patients’ past medical history were also recorded. We also correlated the presence of co-morbidities to the BMI category (Table 1).
Patient demographics, smoking history, BMI, and serum hemoglobin levels.

BMI, body mass index; COPD, chronic obstructive pulmonary disease; GERD, gastroesophageal reflux disease.
MRI
Out of a total of 528 knees reviewed, 327 knee MRIs were performed using a 1.5-T Philips Eclipse MRI (Andover, MA, USA) at a nearby clinical outpatient site, 129 using a 1.5-T Siemens Avanto (Siemens, Erlangen, Germany) at the university hospital, and 72 using a 3.0-T Siemens Trio magnet located at the university hospital. The studies performed in both the 1.5-T and 3.0-T units used an extremity coil and a standard imaging protocol. The protocol consisted of sagittal T1-weighted spin echo (TR/TE = 600/20 ms), axial and coronal fat-suppressed T2-weighted (T2W) fast spin echo (TR/TE = 4000/70 ms), effective echo train length = 9, axial and coronal proton density (TR/TE = 2000/21 ms), and sagittal STIR (TR/TE/TI = 5000/70/150 ms) imaging sequences with 2–3 excitations. Slice thickness was 3 mm with an interslice gap of 1 mm. Field of view was in the range of 15–18 cm.
Subcutaneous fat measurement
Four observers reviewed each case and measured the thickness of the subcutaneous fat around the distal femur, utilizing the axial fat-suppressed T2W images. Measurement points were taken between the skin surface and the deep fascia at the level of the uppermost axial location, with the thickest subcutaneous fat considered. The uppermost axial plane corresponded to approximately 7–7.5 cm above the lateral joint line (Fig. 1). This distance was determined from the PD FSE coronal view at the midpoint (midpoint in the anteroposterior direction) after tracing an imaginary line bisecting the body of the lateral meniscus in half measuring superiorly 7–7.5 cm and selecting the axial image corresponding to this location. The axial image was divided into four quadrants (anterior medial, anterior lateral, posterior medial, and posterior lateral) as illustrated in Fig. 2.

Coronal knee MRI showing the level at which the axial cut is selected for subcutaneous fat measurements.
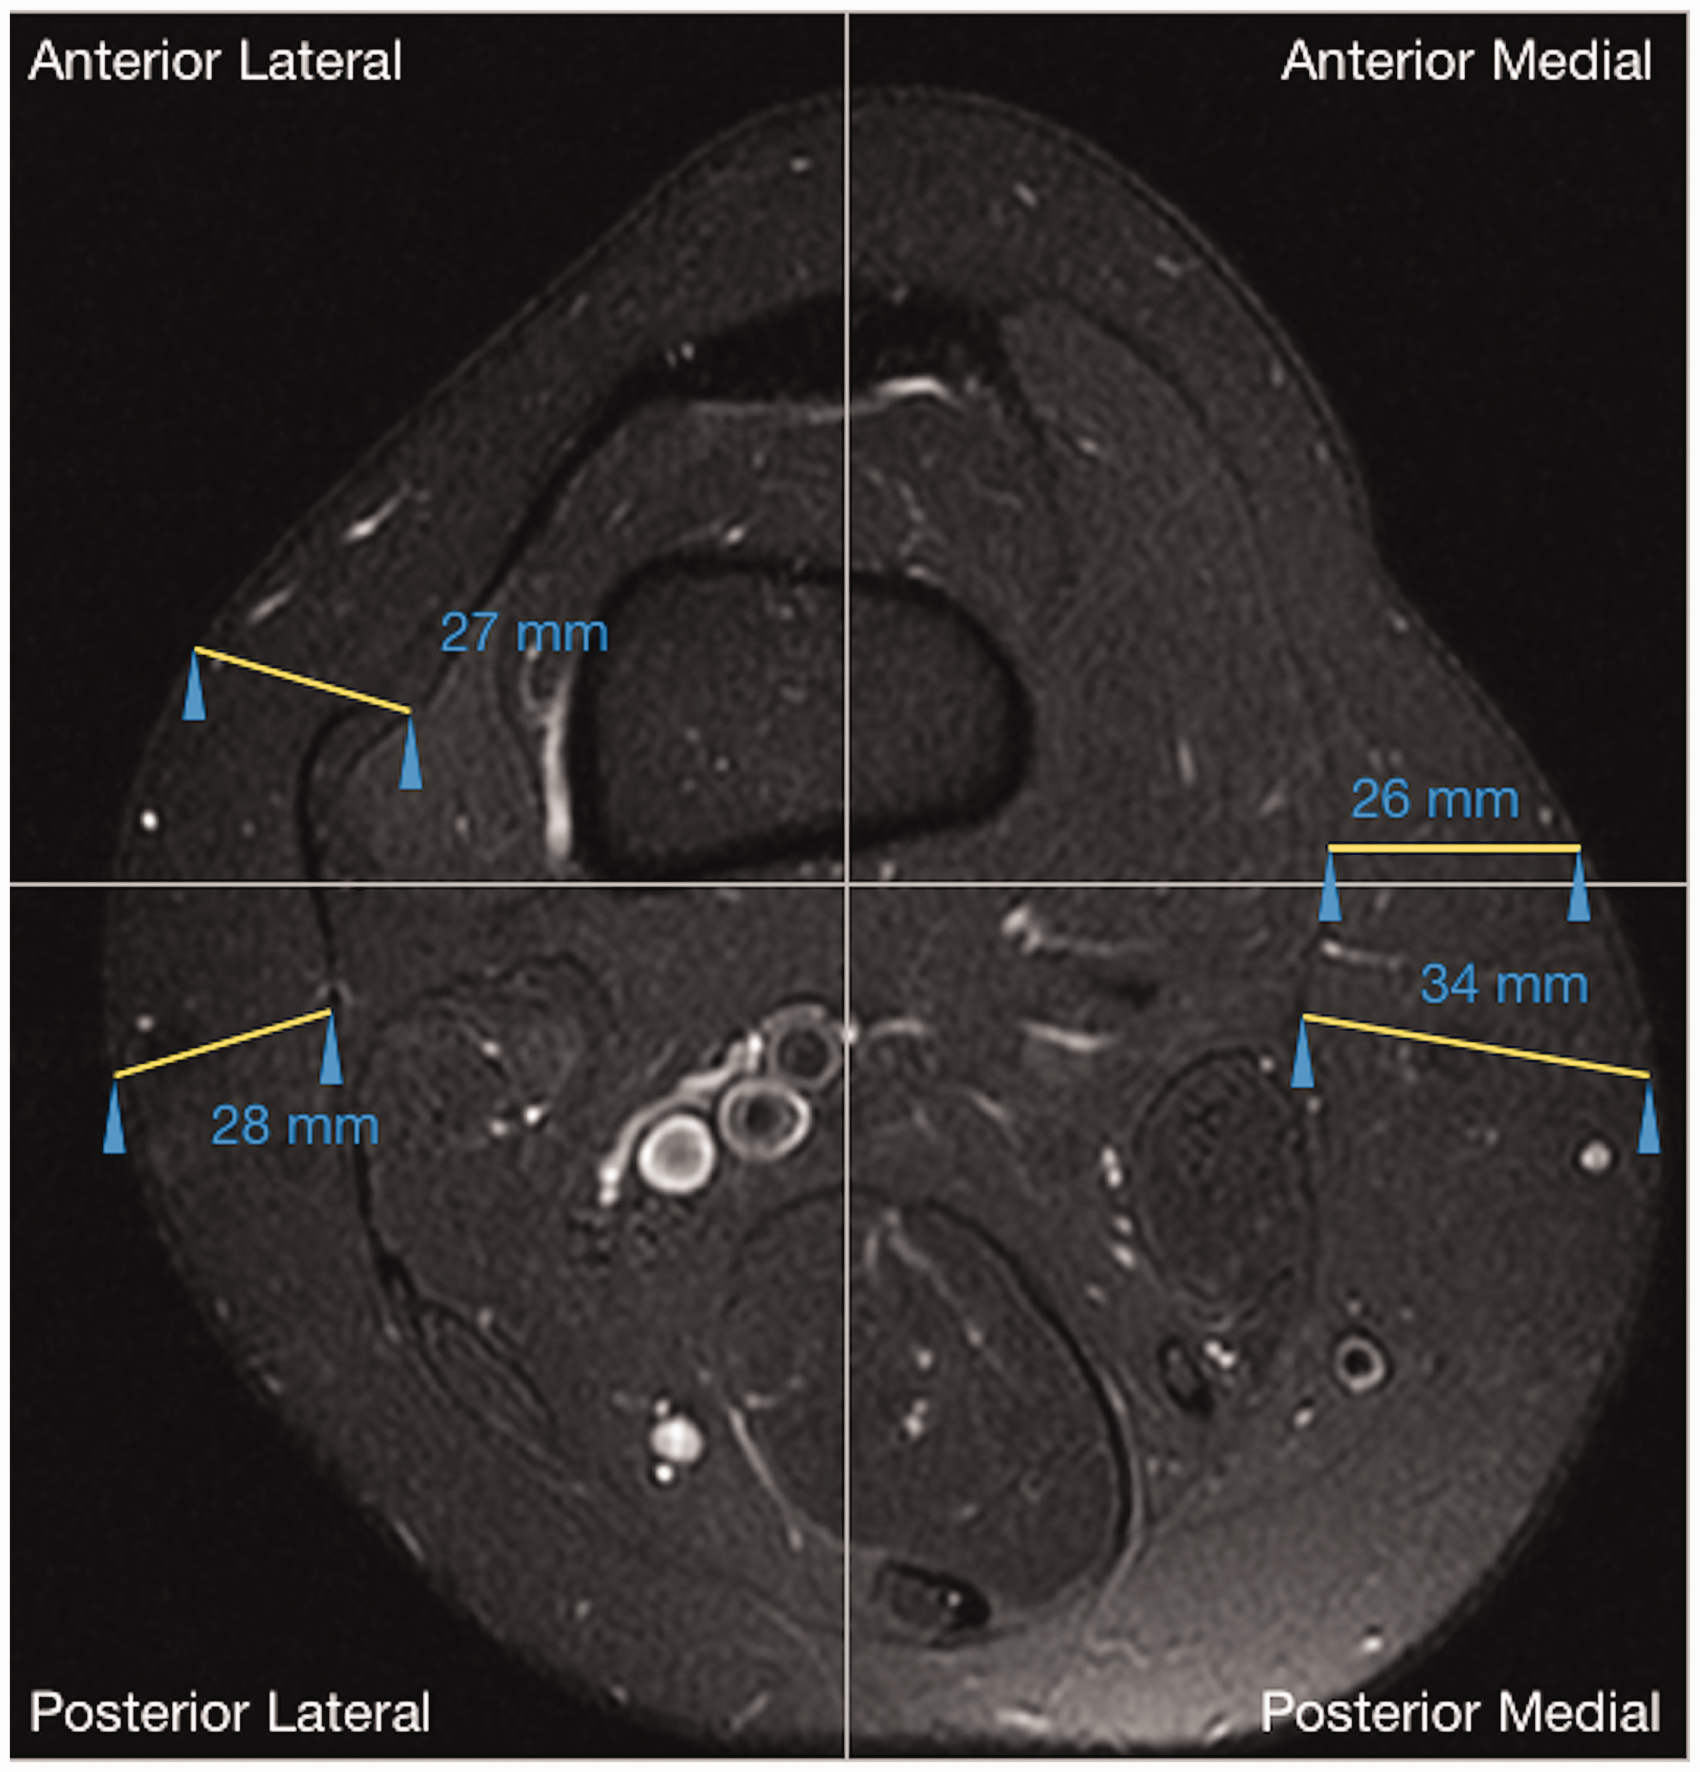
Axial knee MRI showing the measurement of the thickness of subcutaneous fat in each of the four quadrants.
Four experienced MSK radiologists with a total of 27 years of experience were trained to measure the subcutaneous fat in each quadrant on five different MRI exams. Detailed step-by-step instructions were explained to each of the observers and provided in a written format. Then, to assure reproducibility of the measurements, inter-rater reliability was determined on 15 exams where each reader produced measurements on all four quadrants. For the remaining cases, each observer was assigned a specific quadrant in which to measure the thickness of the subcutaneous fat; therefore, all four quadrants were evaluated. The observers included two fourth-year medical students, a fourth-year radiology resident, and a MSK radiology faculty member with 27 years of experience.
BMI
Categorization of weight class by BMI (kg/m2) was done using the WHO definitions (2): underweight <18.5; normal = 18.5–24.9; overweight 25–29.9; and obese ≥30.0.
Statistical analysis
All statistical analyses were performed using statistics software (JMP Pro, version 10.2.2, SAS Institute Inc., Cary, NC, USA). Descriptive statistics consisted of means, percentages of sample populations (for continuous and categorical data), and standard deviations (for continuous data). Inter-rater reliability was determined using the intraclass correlation coefficient (ICC) for the SubCut indices in each quadrant using a two-way mixed effects model. A chi-square test was used to determine statistical significance between categorical samples where indicated. Comparison between groups of continuous data was performed using bivariate simple linear regression, testing the model using analysis of variance (ANOVA), and reporting the correlation coefficient (r) and the coefficient of determination (R2). Between groups of continuous and categorical data, one-way ANOVA, with post-hoc Tukey-Kramer honestly significant difference (HSD), when appropriate, was performed. Contingency analysis with Fisher’s exact test or Pearson’s chi-square and further two-dimensional and three-dimensional correspondence analysis, when appropriate, was performed for comparisons between categorical data. Any P value < 0.05 was considered statistically significant. Sensitivity and specificity were calculated for observational data; analysis of the receiver operating characteristic (ROC) curve was performed to determine an appropriate cut-off value for continuous observational data. A post-hoc power analysis was conducted using the software G*Power to compute the observed power (10).
Results
Descriptive data
A total of 518 patients with 528 knees imaged were analyzed. Demographic patient data, including age, gender, reported history of smoking, BMI, and serum hemoglobin, are presented in Table 1.
SubCut index and BMI
The SubCut index in all four quadrants was reliably measured by the raters (ICC = 0.999; 95% confidence interval [CI] = 0.998–1; P value < 0.001) on the initial 15 MRI examinations. Bivariate fits of a simple linear regression model for measurements of SubCut index in all four quadrants and BMI were significant (all ANOVA, P < 0.0001, r = 0.62, adjusted R2 = 0.39), with measurements of the anterior medial (P < 0.0001) and posterior medial quadrants (P = 0.01) being the stronger predictors. Figure 3 shows the actual BMI versus predicted BMI values using the above linear regression model. All four SubCut index quadrant measurements showed significant differences (P < 0.0001) among all BMI categories (underweight, normal, overweight, and obese). Post-hoc Tukey–Kramer HSD tests showed significant differences between the normal, overweight, and obese categories and SubCut indices in all four quadrants (with P values in the range of 0.025 to <0.0001), except for the posterior lateral quadrant SubCut index, where there was no significant difference found between normal and overweight patients (P = 0.13). SubCut indices were significantly different in all four quadrants between the underweight and obese categories (P values in the range of 0.009 to <0.0001), though not between underweight and normal to overweight categories (P values were in the range of 0.097–0.94).
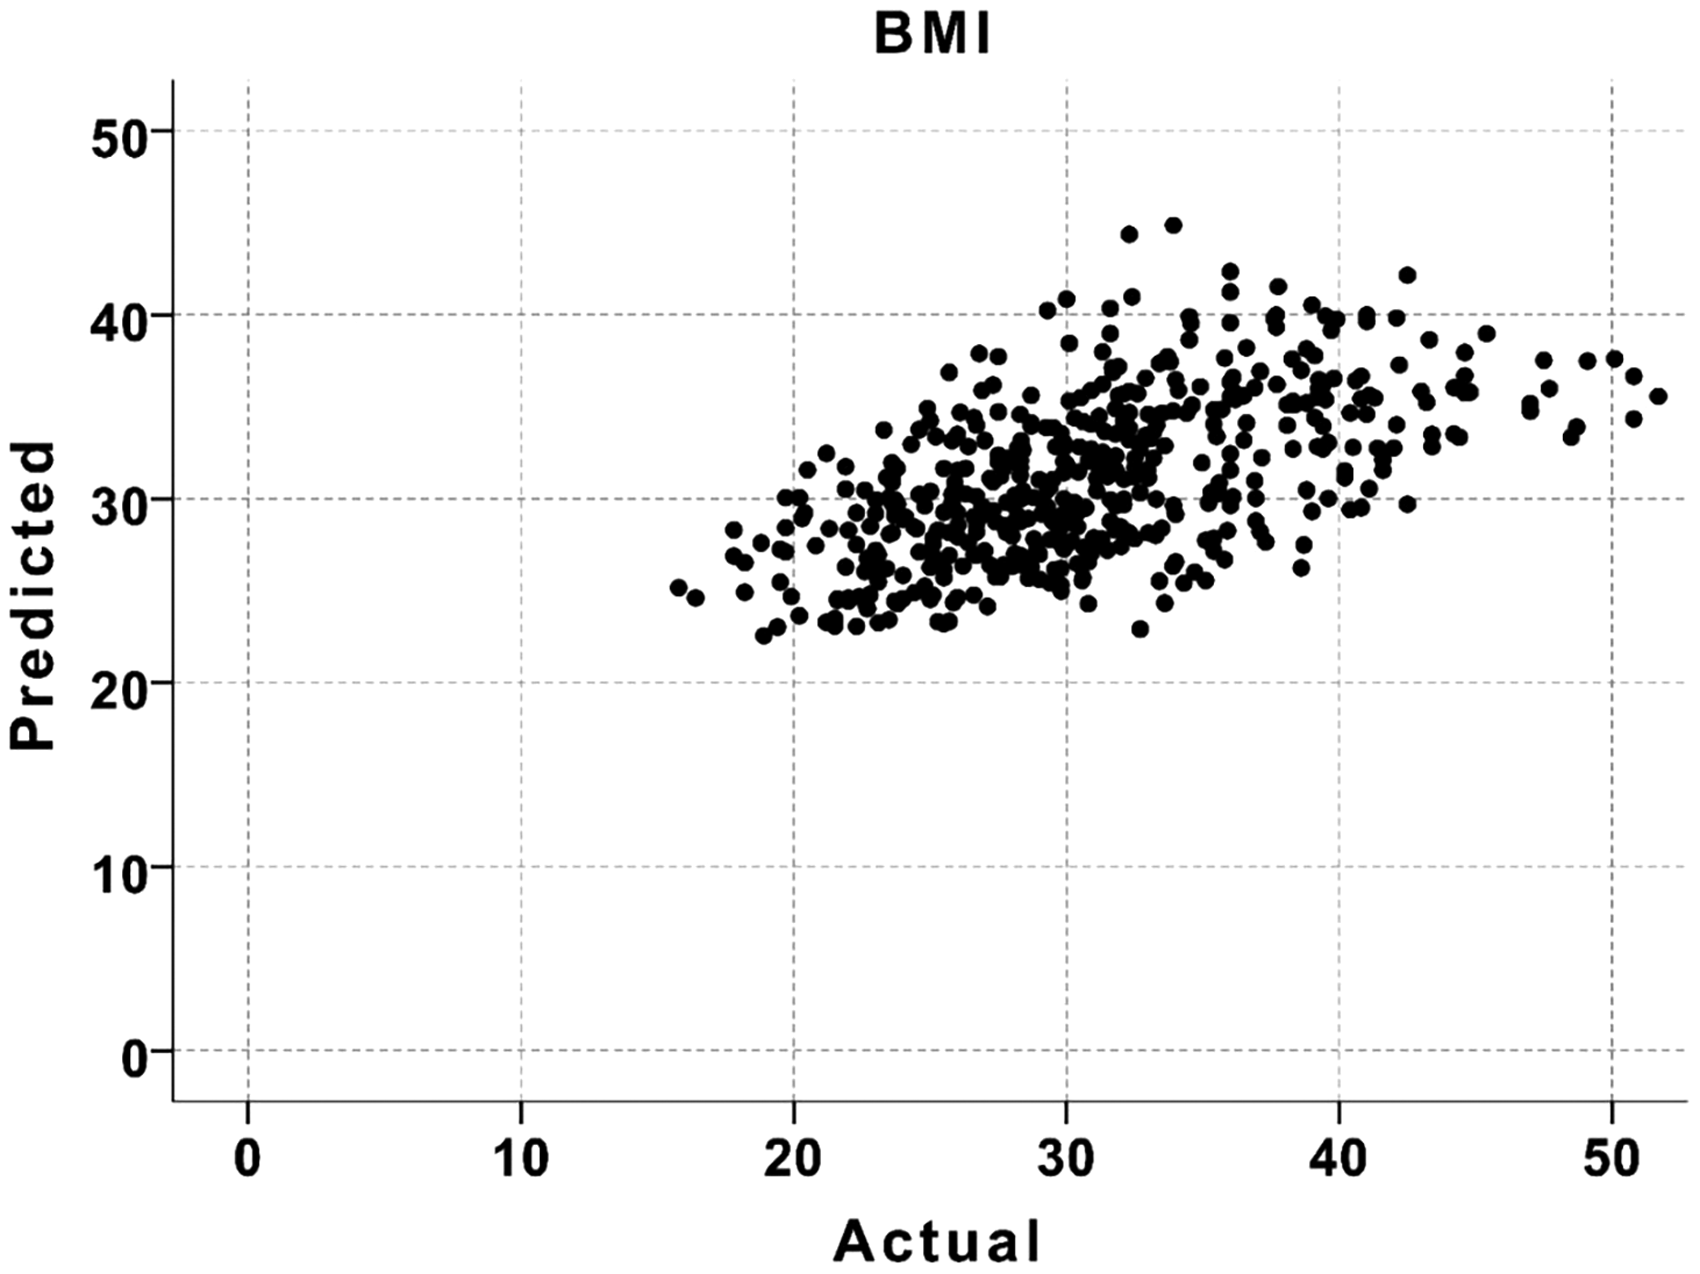
Actual BMI value plotted vs. predicted BMI value obtained from a linear regression model using SubCut indices from all four quadrants as predictors.
By gender, bivariate fits of a simple linear regression model for measurements of SubCut index in all four quadrants and BMI were significant for both female and male patients (all ANOVA, P < 0.0001, female: r = 0.64, adjusted R2 = 0.4, male: r = 0.62, adjusted R2 = 0.37), with measurements of the anterior and posterior medial (P < 0.0001) quadrants being significant predictors in women, and the anterior lateral (P = 0.001) and posterior medial (P < 0.0001) quadrant being significant predictors in men. When BMIs were categorized for each gender, all four SubCut index quadrant measurements showed significant differences among BMI categories (P values were in the range of 0.007 to < 0.0001 for all).
Analysis of the ROC curve utilizing the anterior and posterior medial quadrants of patients in the obese category yielded an area under the curve (AUC) of 0.7904 and 0.7828, respectively. The sensitivity of using a cut-off value of 20 mm in the posterior medial quadrant of obese patients is 68.73%, while the specificity is 74.29%. Raising the cut-off value to 25 mm in the posterior medial quadrant, the sensitivity for detecting obesity increases to 78.13% and the specificity decreases to 69.28%. Further, raising the cut-off value to 30 mm in the posterior medial quadrant follows the same trend, increasing the sensitivity for detecting obesity to 83.70% while decreasing the specificity to 60.21%.
Finally, analysis of the ROC curves utilizing both medial and lateral quadrants as well as BMI was performed with respect to obesity-related co-morbidities. BMI was shown to outperform medial and lateral SubCut indices in most categories, with sleep apnea having the highest AUC of 75 with a threshold of 31.55. Medial SubCut indices performed better than lateral. Tables 5–7 show the ROC analysis results using BMI, posterior medial SubCut index, and anterior medial SubCut index, respectively.
BMI and statistically insignificant co-morbidities
There was no statistically significant difference (P = 0.05) between the categories of BMI and smoking by one-way ANOVA (Table 2). No statistically significant difference (P = 0.77) was found between mean BMI for those patients with a history of COPD (31.92 kg/m2) and those without a history of COPD (31.18 kg/m2) by independent samples t-test with unequal variance (Levene’s test, P = 0.003). There was also no correlation (P = 0.2) between mean BMI for those with a history of HLD (32.60 kg/m2) and those without a history of HLD (31.08 kg/m2) by independent samples t-test with equal variance (Levene’s test, P = 0.26). Additionally, there was no statistically significant difference (P = 0.28) between mean BMI for those with a history of hypothyroid (32.62 kg/m2) and those without a history of hypothyroid (31.12 kg/m2) by independent samples t-test with equal variance (Levene’s test, P = 0.62). ROC analysis using BMI as the predictor found no significant difference between AUC and 50% when discriminating participants based on their status of smoking, COPD history, HLD history, and hypothyroidism.
Summary of BMI’s discrimination of specific co-morbidities.
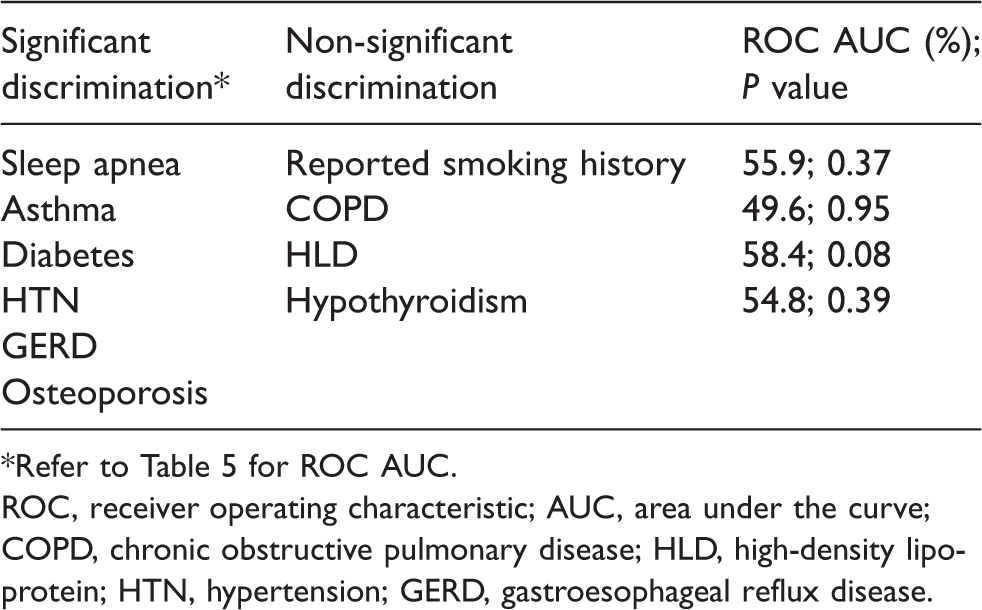
*Refer to Table 5 for ROC AUC.
ROC, receiver operating characteristic; AUC, area under the curve; COPD, chronic obstructive pulmonary disease; HLD, high-density lipoprotein; HTN, hypertension; GERD, gastroesophageal reflux disease.
Analysis of ROC curve using BMI in relation to co-morbidities.

BMI, body mass index; SE, standard error; CI, confidence interval; ROC, receiver operating characteristic; HTN, hypertension; GERD, gastroesophageal reflux disease.
Analysis of ROC curve using posterior medial SubCut index in relation to co-morbidities.
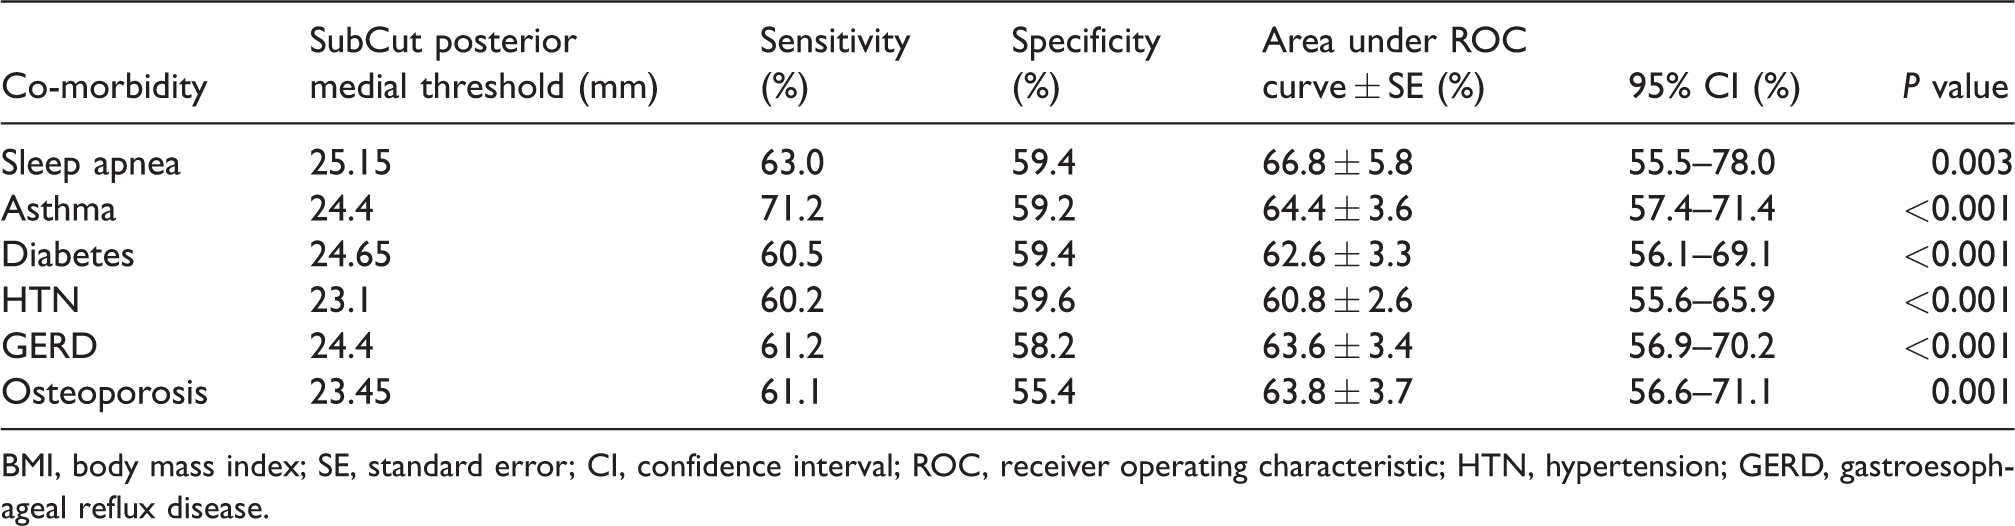
BMI, body mass index; SE, standard error; CI, confidence interval; ROC, receiver operating characteristic; HTN, hypertension; GERD, gastroesophageal reflux disease.
Analysis of ROC curve using anterior medial SubCut index in relation to co-morbidities.
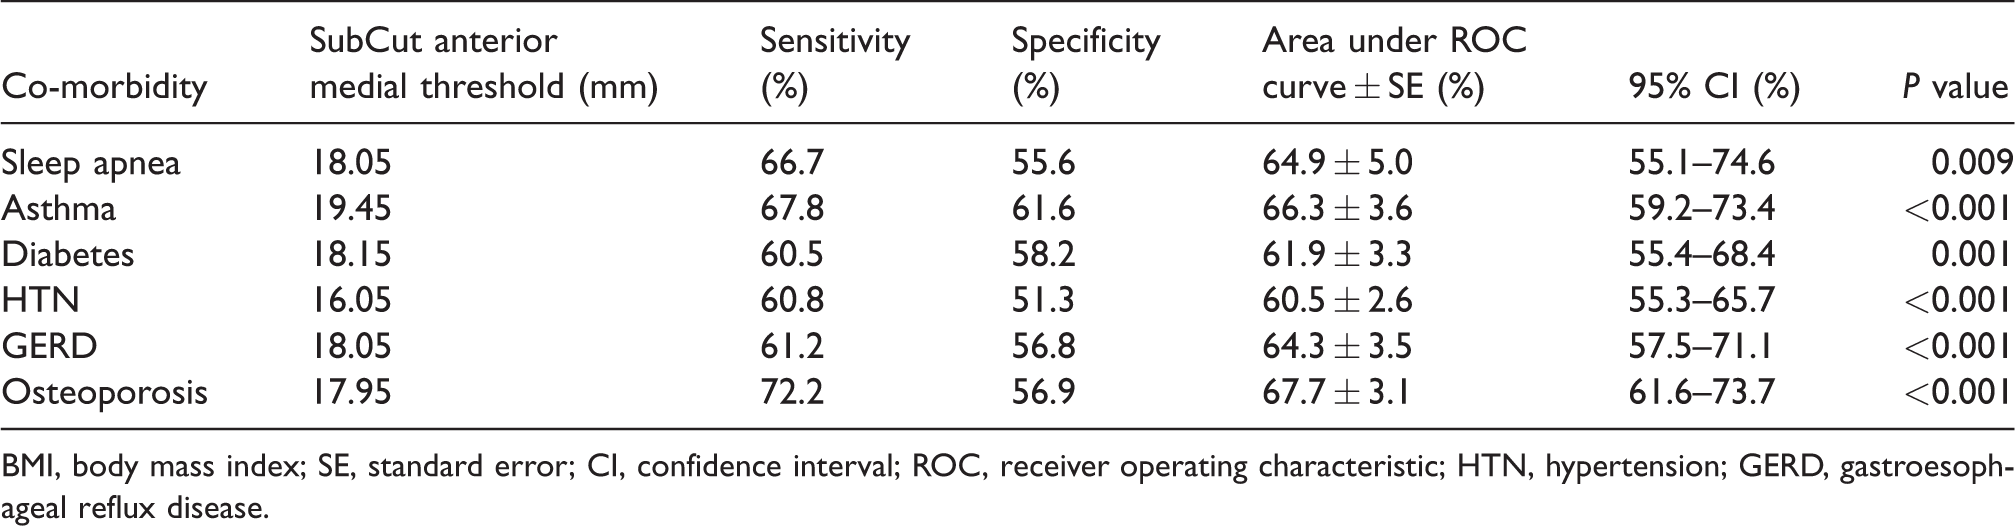
BMI, body mass index; SE, standard error; CI, confidence interval; ROC, receiver operating characteristic; HTN, hypertension; GERD, gastroesophageal reflux disease.
Performance comparison of BMI and SubCut index in all four quadrants in relation to co-morbidities using analysis of ROC curve.

BMI, body mass index; SE, standard error; CI, confidence interval; ROC, receiver operating characteristic; HTN, hypertension; GERD, gastroesophageal reflux disease.
Multivariate general linear model analysis predicting SubCut index values depending on BMI categories with co-morbidities as covariates.
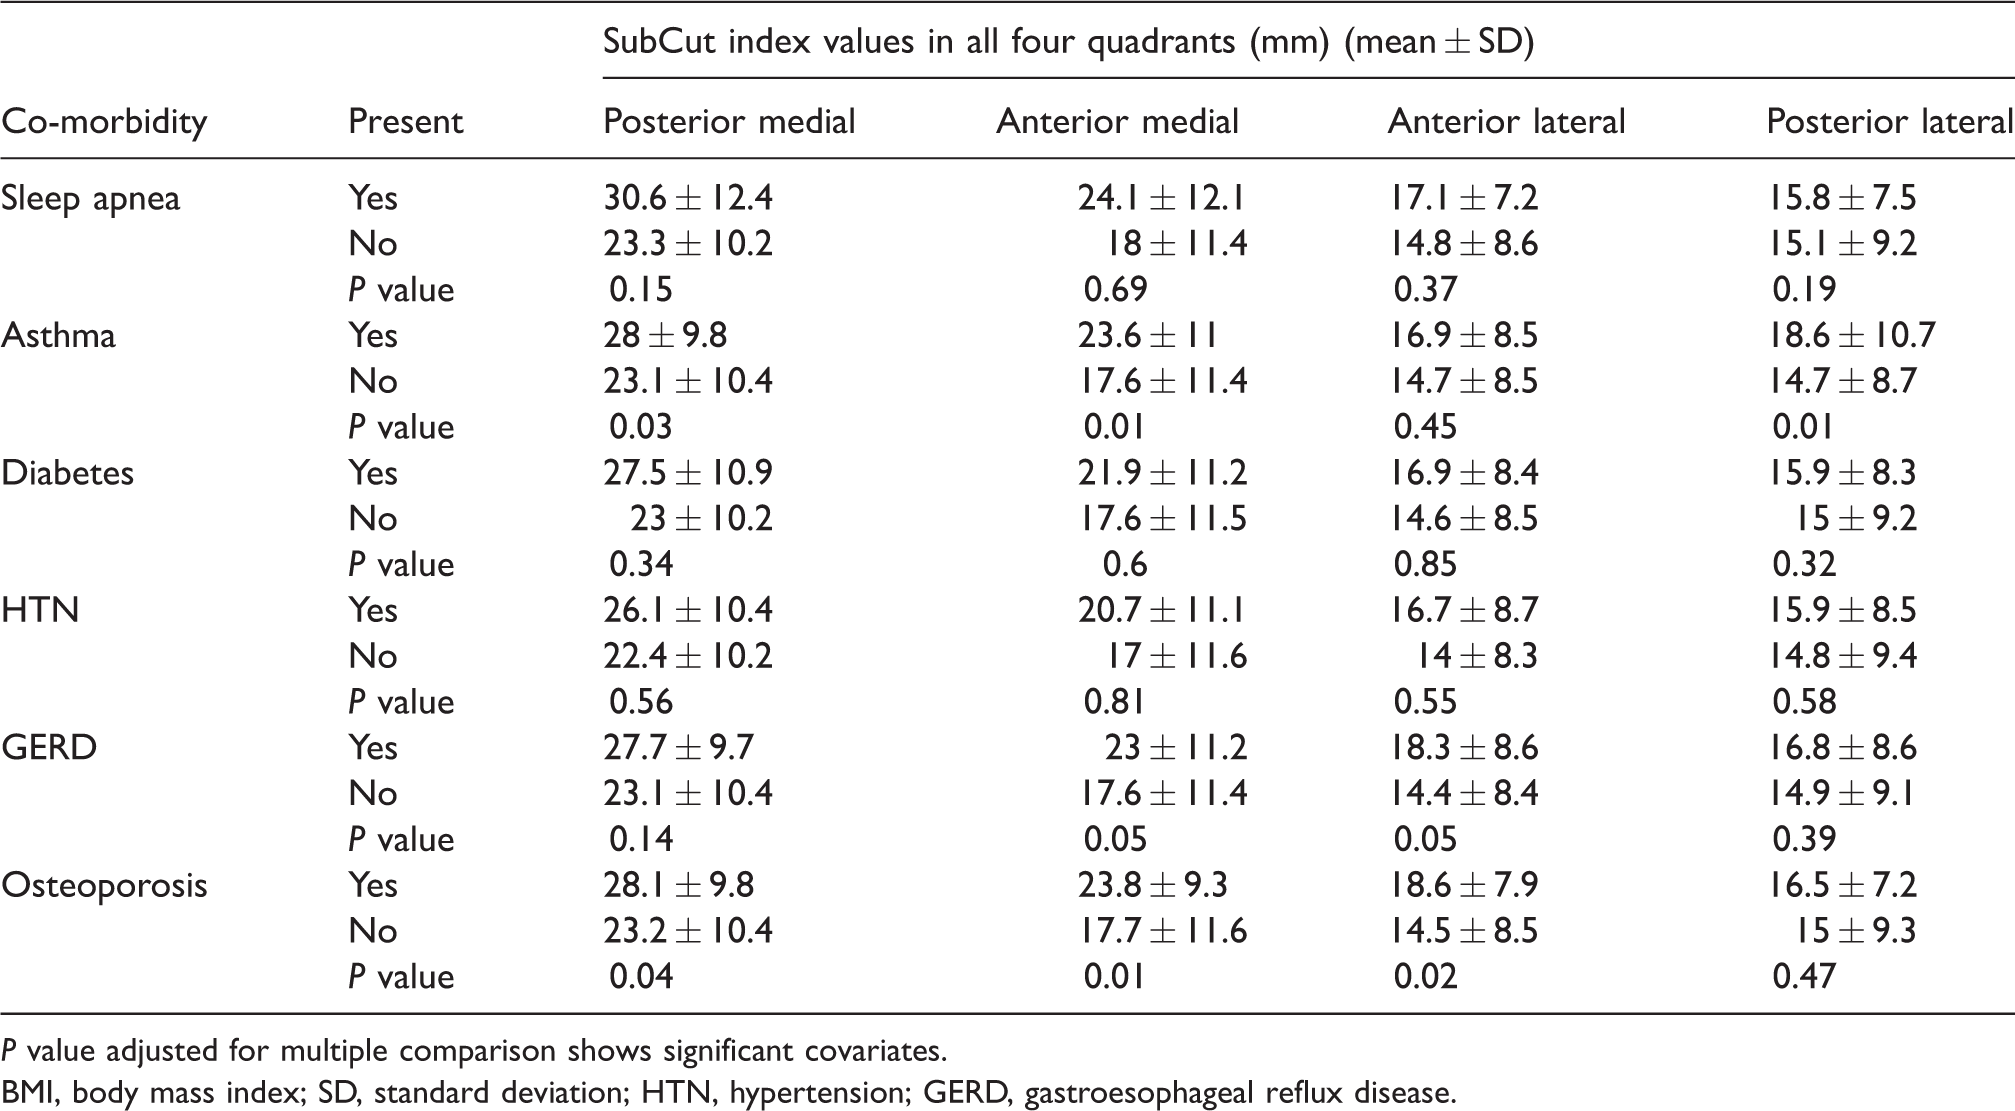
P value adjusted for multiple comparison shows significant covariates.
BMI, body mass index; SD, standard deviation; HTN, hypertension; GERD, gastroesophageal reflux disease.
BMI and statistically significant co-morbidities
The observed power (91.5%) for significant co-morbidities were > 99%, with the exception of sleep apnea (Table 3).
Sleep apnea: A statistically significant difference (P < 0.001) was found between mean BMI for those with a history of sleep apnea (38.28 kg/m2) and those without a history of sleep apnea (30.80 kg/m2) by independent samples t-test with unequal variance (Levene’s test, P = 0.05). Analysis of the ROC curve for the patients with sleep apnea yielded an AUC of 0.748. The sensitivity of detecting sleep apnea using a cut-off BMI value of 31.55 kg/m2 is 81.5%, while the specificity is 60%.
History of asthma: Regarding patients with a reported history of asthma, a statistically significant difference (P = 0.001) between mean BMI for those with a history of asthma (34.26 kg/m2) and those without a history of asthma (30.80 kg/m2) by independent samples t-test with equal variance (Levene’s test, P = 0.34) was seen. Analysis of the ROC curve for the patients with history of asthma yielded an AUC of 0.633. The sensitivity of detecting asthma using a cut-off BMI value of 29.85 kg/m2 is 71.2%, while the specificity is 49.7%.
History of diabetes: Furthermore, a statistically significant difference (P = 0.000) between mean BMI and those with a history of diabetes (34.95 kg/m2) and those without a history of diabetes (30.49) by independent samples t-test with unequal variance (Levene’s test p=0.04) was seen. Analysis of the ROC curve for the patients with history of diabetes yielded an AUC of 0.674. The sensitivity of detecting diabetes using a cutoff BMI value of 30.75 is 70.4%, while the specificity is 57.5%.
History of HTN: When it came to comparing mean BMI and history of HTN, a statistically significant difference (P < 0.001) was seen in those patients with a history of HTN (33.61 kg/m2) in comparison to those without a history of HTN (29.91 kg/m2) by independent samples t-test with unequal variance (Levene’s test, P = 0.02). Analysis of the ROC curve for the patients with history of HTN yielded an AUC of 0.654. The sensitivity of detecting HTN using a cut-off BMI value of 31.185 kg/m2 is 62.5%, while the specificity is 65.3%.
History of GERD: There is a statistically significant difference (p < 0.001) between mean BMI for those with a history of GERD (34.76 kg/m2) and those without a history of GERD (30.66 kg/m2) by independent samples t-test with unequal variance (Levene’s test, P = 0.01). Analysis of the ROC curve for the patients with history of GERD yielded an AUC of 0.638. The sensitivity of detecting GERD using a cut-off BMI value of 30.85 kg/m2 is 61.2%, while the specificity is 55.4%.
History of osteoporosis: Lastly, a statistically significant difference (P = 0.03) was observed between mean BMI for those with a history of osteoporosis (33.17 kg/m2) and those without a history of osteoporosis (30.97 kg/m2) by independent samples t-test with equal variance (Levene’s test, P = 0.64). Analysis of the ROC curve for the patients with history of osteoporosis yielded an AUC of 0.590. The sensitivity of detecting osteoporosis using a cut-off BMI value of 30.75 kg/m2 is 61.1%, while the specificity is 54.7%.
Discussion
This study confirms a statistically significant relationship between subcutaneous fat measurements at the level of the most proximal axial image on knee MRIs and BMI. Although the correlation in all four quadrants proved to be significant (P < 0.0001), the SubCut index (thickest subcutaneous fat measurement) in the posterior medial quadrant was found to have the strongest correlation with BMI in both male and female patients, meaning the thickest subcutaneous fat measurement in this knee quadrant predicts BMI the best.
The findings presented in this study are becoming increasingly more relevant as obesity has become a problem of epidemic proportions (Tables 4 and 5). According to the CDC National Center for Health Statistics (NCHS), more than one-third (36.5%) of adults in the United States are classified as obese (11). Interestingly, the prevalence of obesity in our patient population was 51%. The apparent increase in the prevalence of obesity can be attributed to the specific study’s patient population presenting to our clinic with knee pain. Obese patients are more likely to present with knee pain due to increased mechanical load and other biomechanical factors (12).
One of the objectives of the study was to assess whether the BMI or the SubCut index would correlate with obesity co-morbidities (Table 6). BMI and SubCut fat index correlated well with the presence of obesity-associated co-morbidities including sleep apnea, asthma, diabetes, HTN, GERD, and osteoporosis. However, BMI outperformed the subcutaneous anterior medial and posterior medial fat measurements for detection of sleep apnea (sensitivity = 81.5%), diabetes (sensitivity = 70.4%), HTN (sensitivity = 66.5%), and GERD (sensitivity = 65.7%) within a BMI range of 30.3–31.6 kg/m2. On the other hand, the SubCut posterior medial index performs as well as BMI in screening for asthma utilizing 24.4 mm as a subcutaneous fat threshold (upper limits of normal), while the SubCut anterior medial index outperforms BMI in detection of osteoporosis at a threshold of 18 mm (sensitivity = 72.2%). One relevant point is that the SubCut indices did not significantly change among individuals with and without the different co-morbidities (Table 7). This is significant that in patients with normal body weight, the anteromedial subcutaneous fat measurement identifies patients with osteoporosis in two-thirds of the time in our patient population. It is difficult to predict how these observations will translate to the general population. One of the main points of this work is to point out these correlations worth studying at a greater scale.
Of those co-morbidities which our study showed to be significantly correlated with obesity, we found the relatively high incidence of osteoporosis in obese patients especially interesting. Osteoporosis is a skeletal disease characterized by reduced bone strength leading to an increased risk of fractures (13). It tends to affect more women than men and is typically seen in patients aged ≥ 65 years (14,15). Studies have shown, however, that a higher BMI is associated with a lesser osteoporotic risk, with the belief being that a greater adaptive bone mass is needed to accommodate the larger body mass (16). Additionally, it has been postulated that the estrogen produced by adipose tissue inhibits bone resorption by directly inhibiting osteoclastic activity (17). In our study, 94% of our osteoporotic patients were women (46 out of 49) with an average age of 52.6 years, which is younger than the average presenting age for this disease. The SubCut index may be utilized as a triage screen for osteoporosis.
BMI has associated sensitivities in the range of 63–81.5% and specificity in the range of 50–61%. The SubCut index has sensitivities in the range of 60.2–71.2% while the specificity falls within a range of 55.4–59.6%. It should be noted that the prevalence of a disease may be different in different clinical settings. For example, the pre-test probability for a positive test would be expected to be higher when a patient consults a specialist than when they consult a general practitioner. We propose the use of BMI and SubCut index as triage tests to exclude presence of disease.
Our study is limited by its retrospective nature and the lack of longitudinal follow-up and outcome data. Our patient population consists mostly of overweight women. In addition, the data acquired were from a single center, limiting our findings to reflect only local pathology. Follow-up examinations were not performed, which have the potential to substantially increase the number of patients examined with related co-morbidities. Furthermore, data collected from patients, such as history of smoking, were self-reported, which have the possibility of recall bias. This study can serve as a platform to a future multicenter approach that would allow patient follow-ups in a longitudinal fashion.
The relative ease and cost-effectiveness of this simple measurement further enhances the value of care provided to the patient presenting with knee pain requiring MRI. Overall, our data suggest an association between the posterior medial SubCut index and BMI regardless of gender in addition to its use in the screening of patients with history of sleep apnea, asthma, diabetes, HTN, GERD, and osteoporosis.
In conclusion, the use of the SubCut index paves a way for more specific recommendations to screen for patients who are at risk of developing diseases related to obesity, thereby impacting clinical outcomes by utilizing information currently wasted on knee MRI examinations. We hope that this study becomes a platform for other studies to be performed to realize the full potential of the method discussed in this paper in the detection of obesity-related co-morbidities that are usually screen for in patients aged > 60 years but do not fall in the screening radar in younger patients.
Footnotes
Acknowledgements
The authors thank Erica Monfred and Terence Anguh for their contributions with the subcutaneous fat measurements.
Declaration of conflicting interests
The authors declared no potential conflicts of interest with respect to the research, authorship, and/or publication of this article.
Funding
The author(s) received no financial support for the research, authorship, and/or publication of this article.