
Abstract
Background
Current magnetic resonance imaging (MRI) techniques for measuring extraocular muscle (EOM) volume enlargement are not ideally suited for routine follow-up of Graves’ ophthalmopathy (GO) because the difficulty of segmenting the muscles at the tendon insertion complicates and lengthens the study protocol.
Purpose
To measure the EOM sampled volume (SV) and assess its correlation with proptosis.
Material and Methods
A total of 37 patients with newly diagnosed GO underwent 3-T MRI scanning with iterative decomposition of water and fat (IDEAL) sequences with and without contrast enhancement. In each patient, the three largest contiguous coronal cross-sectional areas (CSA) on the EOM slices were segmented using a polygon selection tool and then summed to compute the EOM-SV. Proptosis was evaluated with the Hertel index (HI). The relationships between the HI value and EOM-SV and between HI and EOM-CSA were compared and assessed with Pearson’s correlation coefficient and the univariate regression coefficient. Inter-observer and intra-observer variability were calculated.
Results
HI showed a stronger correlation with EOM-SV (P < 0.001; r = 0.712, r2 = 0.507) than with EOM-CSA (P < 0.001; r = 0.645 and r2 = 0.329). The intraclass correlation coefficient indicated that the inter-observer agreement was high (0.998). The standard deviation between repeated measurements was 1.9–5.3%.
Conclusion
IDEAL sequences allow for the measurement EOM-SV both on non-contrast and contrast-enhanced scans. EOM-SV predicts proptosis more accurately than does EOM-CSA. The measurement of EOM-SV is practical and reproducible. EOM-SV changes of 3.5–8.3% can be assumed to reflect true volume changes.
Keywords
Introduction
Graves’ orbitopathy (GO) is the most common extrathyroidal manifestation of Graves’ disease (1). Although it generally arises in patients with Graves’ hyperthyroidism, individuals with primary autoimmune hypothyroidism and even those without a current or previous history of thyroid dysfunction may also be affected (2). The acute phase of GO is characterized by edema and soft tissue congestion, the imbibition of intra-orbital fat, and enlarged extraocular muscles (EOM). Pathological EOM enlargement can induce proptosis, optic nerve compression, diplopia, and medial orbital wall fracture and may eventually require decompression surgery (3,4). Identifying an early marker of EOM enlargement would help predict future exophthalmos and related complications.
The most common approach to evaluate EOM enlargement is to measure the maximum cross-sectional area of the muscles (EOM-CSA) on standard radiological scans: the technique is easy to perform and involves a short learning curve (5). EOM volume provides more information than that of the CSA and does so on a wider section of the muscles (4–6); however, current volume measurement techniques are time-consuming and involve complex assessments based on isotropic sequences, which prevents their routine clinical use.
The present MRI study describes a practical approach to EOM volume measurement based on the assumption that in GO patients, the pathological EOM enlargement is mostly confined to the muscle belly and spares the tendons, conferring a spindle-like shape (7).
The aims of the study were as follows: (i) to segment, measure, and sum the EOM-CSA of the three largest contiguous slices from the central portion of the EOM to calculate the EOM-SV; (ii) to correlate the EOM-SV with the severity of proptosis (Hertel index); (iii) to test the reproducibility of EOM-SV measurements; and (iv) to assess the usefulness of contrast enhancement in EOM evaluation.
Material and Methods
Patients
This retrospective cohort study involved 50 consecutive participants (13 men, 37 women; median age = 47 ± 10.7 years). Of these, 37 met the inclusion criteria and were enrolled in the study. Patients were included if they had newly diagnosed active GO treated with antithyroid medications (methimazole). Patients who had received immunosuppressive treatment with steroids or orbital radiotherapy and surgical decompression, those with known hypersensitivity to gadolinium-based contrast agents, and those in whom contrast agent use was contraindicated were excluded. The diagnosis of active GO was made at the Department of Ophthalmology of the authors’ institution based on a clinical activity score originally described by Mourits et al. (8). All participants provided written informed consent to be included in the study, which was in line with the principles of the Declaration of Helsinki.
Image acquisition
MRI acquisition parameters.

Ax, axial plane; Cor, coronal plane; Ax + CE, axial plane with contrast enhancement; Cor + CE, coronal plane with contrast enhancement; TR, repetition time; TE, echo time; ETL, echo train length; NEX, number of excitations; FOV, field of view.
Image interpretation
Image assessment and segmentation were performed independently by an experienced radiologist and two radiology residents. Images were evaluated on a dedicated workstation using INFINITT software (INFINITT Co., Ltd., Seoul, Republic of Korea) and ImageJ (NIH, Bethesda, MD, USA), a Java-based image processing program (9). Proptosis was assessed on axial IDEAL T2W in-phase and water images by measuring the perpendicular distance between the interzygomatic line and the apex of the globe (Fig. 1); a value ≥22 mm was considered pathological (10). The non-contrast-enhanced EOM-SV was obtained from coronal T1W IDEAL FSE fat sequences, whereas the contrast-enhanced EOM-SV was obtained from coronal T1W IDEAL FSE water sequences.
Axial T2W IDEAL in-phase image of a 71-year-old man with unilateral right proptosis evaluated with the Hertel index (HI).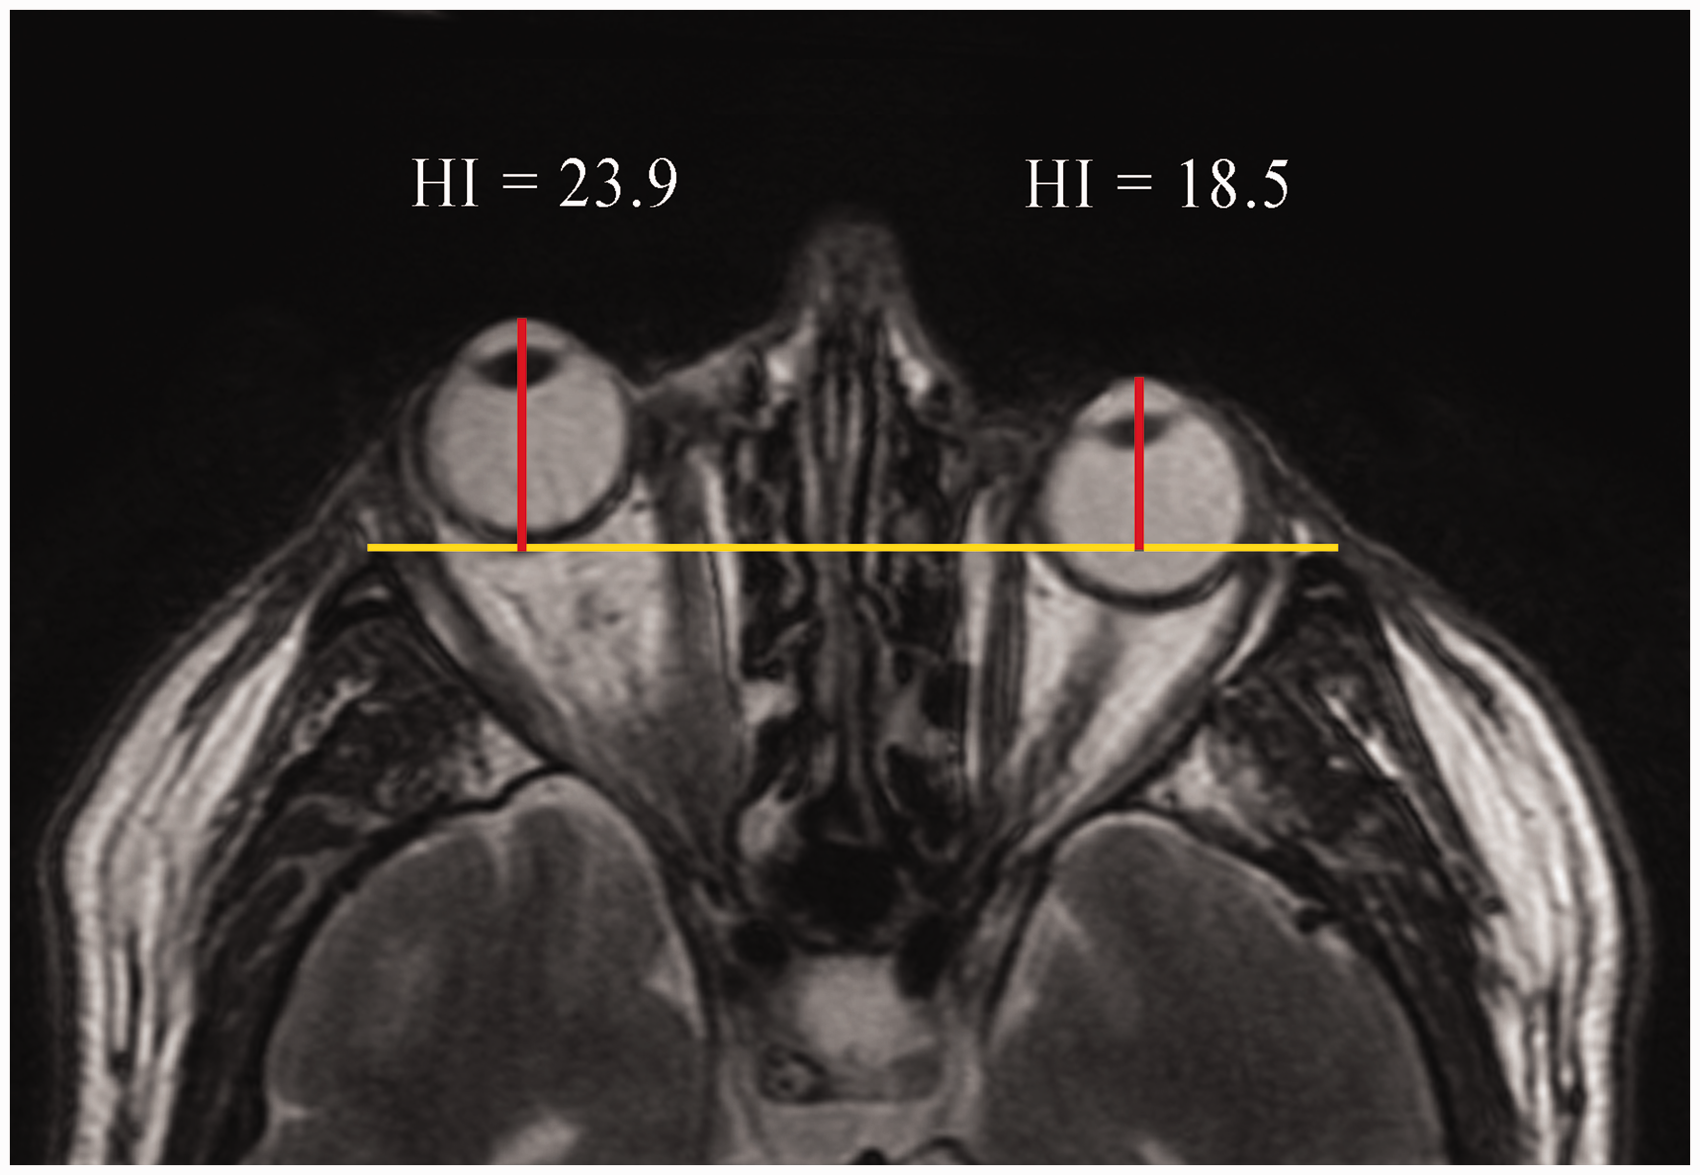
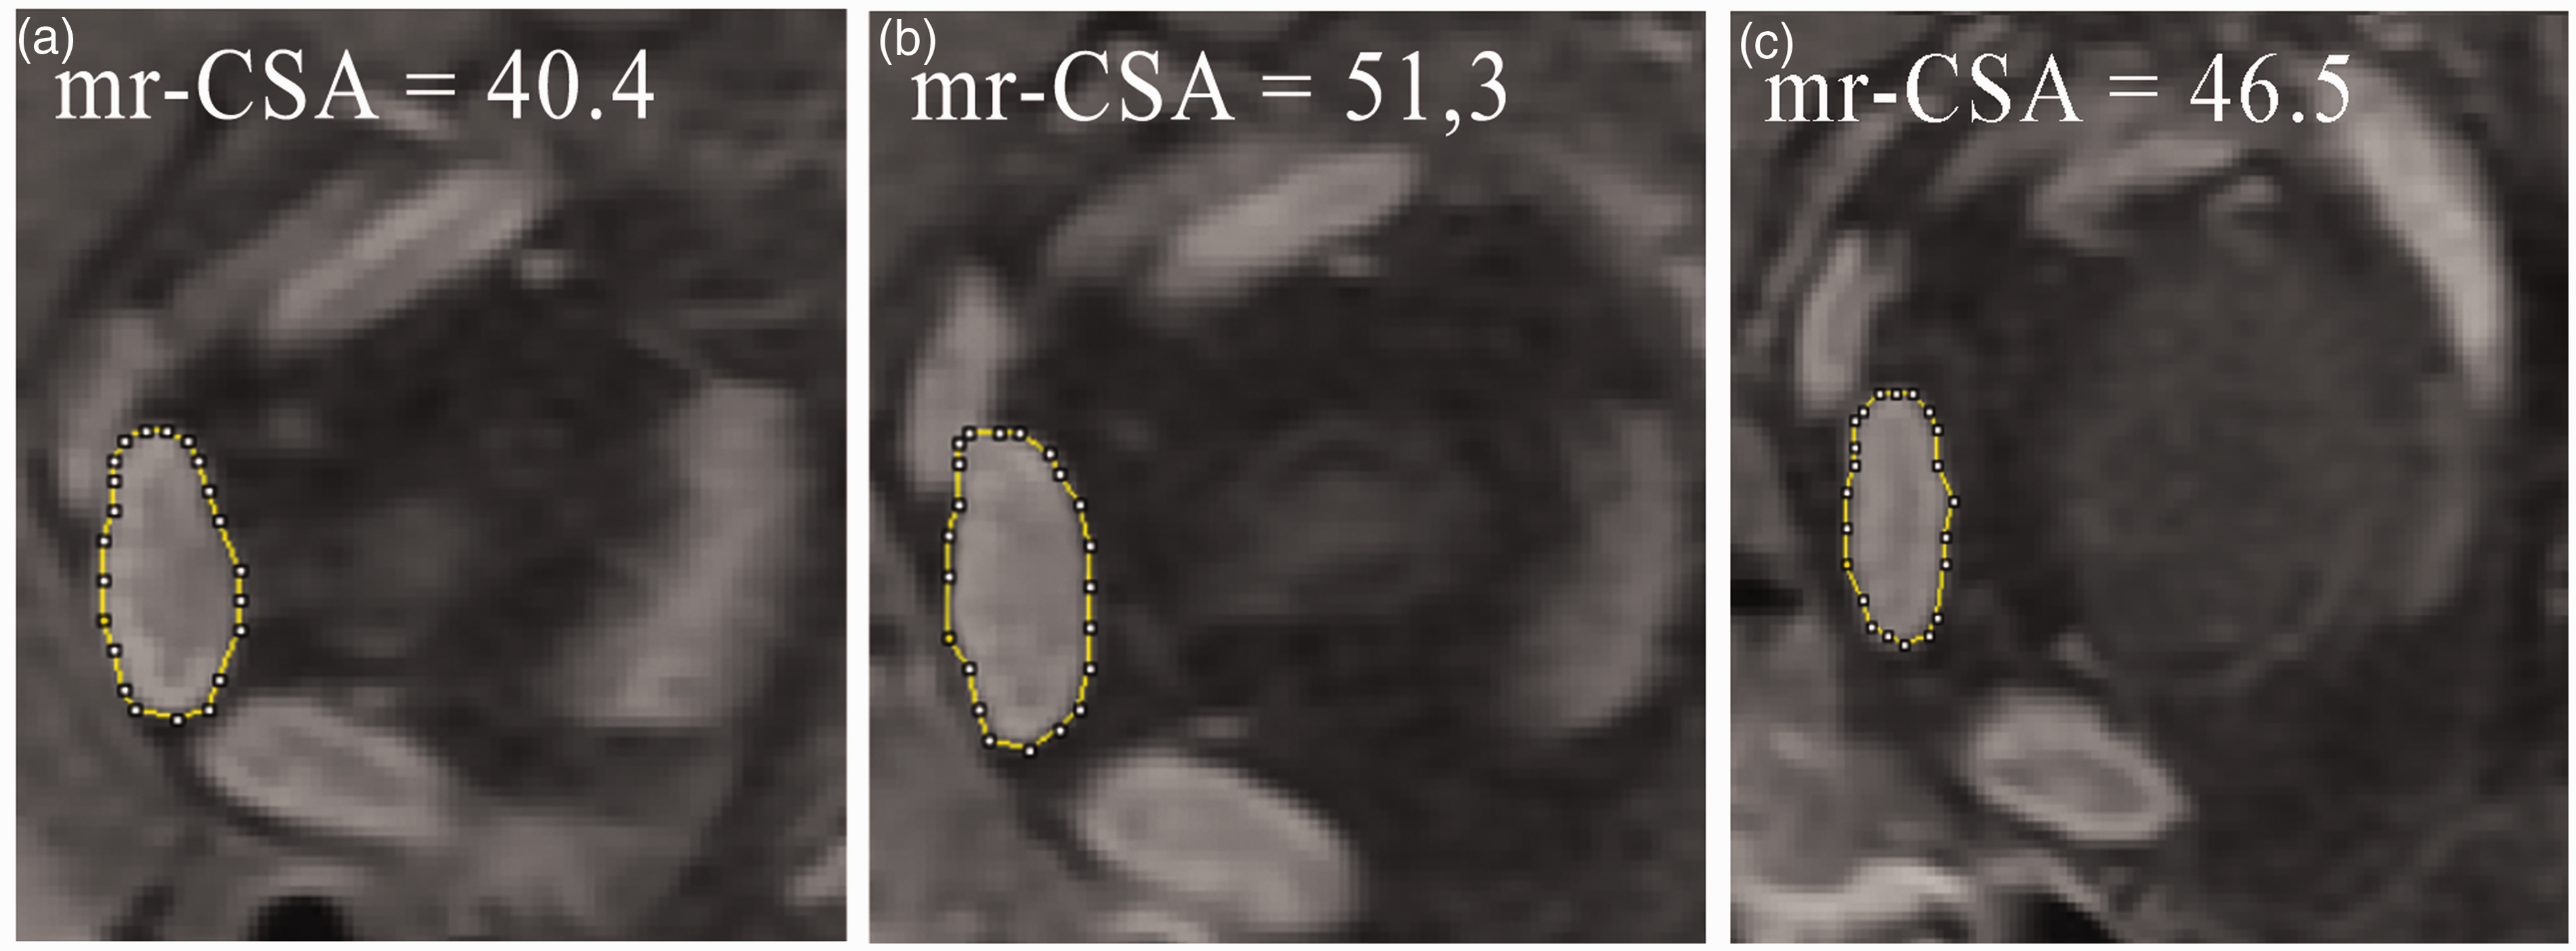
EOM segmentation was performed using the ImageJ polygon selection tool, which defines the EOM shape through a series of line segments with the movable points on the outline shown as small squares. Linear interpolation between the points generates the complete outline. The vertex points identifying a polygon were traced manually and then moved to adapt the shape of the polygon to the EOM shape. After segmentation, measurement of the central coronal EOM slices allowed for the selection of the three sections with the largest CSA, which corresponded to the central muscle portion. The EOM-SV was obtained by adding together these three areas from each muscle for each orbit; the largest of the three CSAs was taken as the maximum EOM-CSA (Figs. 2 and 3). The EOMs assessed in each orbit were the medial, lateral, and inferior rectus; the levator palpebrae and the superior rectus were assessed together (superior rectus complex), as it was difficult to separate them in the images.
Pathological enlargement of the right medial rectus muscle studied with a non-contrast coronal T1W IDEAL fat sequence. The maximum CSA (b) of the medial rectus (mr-CSA) measures 98.2 mm2; its addition to the area of the previous (a) and subsequent (c) section provides the sampled volume of the medial rectus muscle: 276.4 mm3. Pathological enlargement of the left medial rectus muscle studied on contrast-enhanced coronal T1W IDEAL water sequences. The maximum CSA (b) of the medial rectus (mr-CSA) measures 51.3 mm2; its addition to the area of the previous (a) and subsequent (c) section provides the sampled volume of the medial rectus muscle: 138.2 mm3.
Statistical analysis
The inter-observer variability of the measurements obtained on IDEAL sequences was calculated with the intraclass correlation coefficient (ICC) and 95% confidence intervals (two-way mixed-effects model; 0 = no agreement, 1 = perfect agreement between measurements).
Intra-observer variation was assessed using an image subset from eight randomly selected patients, four for non-contrast and four for contrast-enhanced scans. These images, which included four EOM-SV (hence, eight EOM-SV per patient), were re-evaluated twice by each operator one year from the first assessment. This image subset was therefore examined three times and included 24 EOM-SV per patient (eight EOM-SV measured at the time of the study and eight plus eight measured after a year), i.e. a total number of 96 non-contrast and 96 contrast-enhanced EOM-SV. The mean EOM-SV and SD were calculated and expressed as percentages.
The relationship between HI value and maximum EOM-CSA measured on non-contrast and on contrast-enhanced images was determined and compared with the relationship between HI value and non-contrast and contrast-enhanced EOM-SV using Pearson’s correlation and univariate regression.
Data were analyzed with SPSS 19 (SPSS Inc., Chicago, IL, USA). A P value <0.05 was considered significant.
Results
Correlation between HI and the EOM measures
Results of correlations.

HI, Hertel index; r, Pearson’s correlation coefficient; r2, coefficient of determination; bEOM-CSA, non-contrast-enhanced maximum cross-sectional extraocular muscle area obtained with IDEAL fat sequences; bEOM-SV, non-contrast-enhanced extraocular muscle sampled volume obtained with IDEAL fat sequences; cEOM-CSA, contrast-enhanced maximum cross-sectional extraocular muscle area obtained with IDEAL water sequences; cEOM-SV, contrast-enhanced extraocular muscle sampled volume obtained with IDEAL water sequences.
The univariate regression analysis, where HI was the dependent variable and maximum contrast-enhanced EOM-CSA and non-contrast EOM-SV were the independent variables, showed a weak correlation (r2 = 0.329), whereas the correlation with contrast-enhanced EOM-SV was moderately strong (r2 = 0.507). These data are also reported in Table 2. A scatter plot showing a linear regression line between proptosis and all the dimensional parameters determined in the study is reported in Fig. 4.
Scatter plot showing the linear regression lines between the HI and extraocular muscle sampled volume (EOM-SV, orange line) and maximum EOM-CSA (green line). The correlation is stronger with non-contrast (b) and contrast-enhanced (d) EOM-SV than with non-contrast (a) and contrast-enhanced (c) EOM-CSA. HI values are expressed in mm; EOM-CSA are expressed in mm2; EOM-SV are expressed in mm3.
Inter-observer agreement
Intraclass correlation (ICC) of the measurements performed by the three operators.
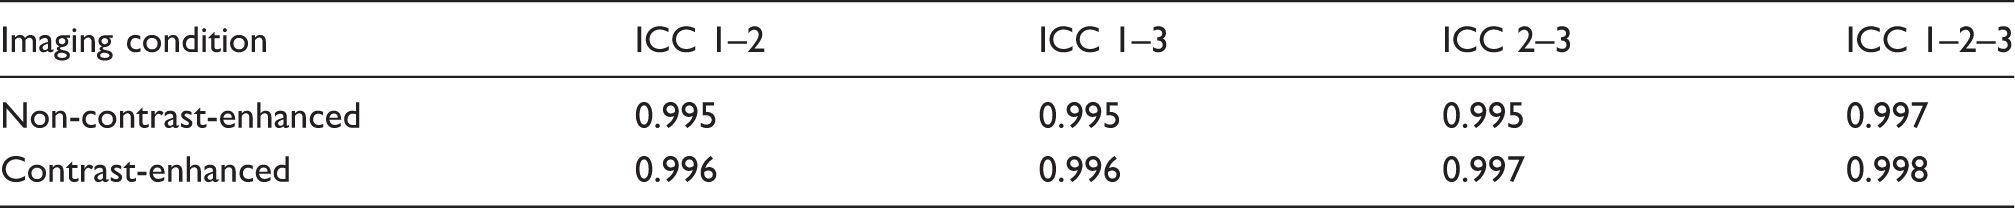
ICC outcome values: 0 = no agreement; 1 = perfect agreement between measurements.
Intra-observer variability
Data from 96 non-contrast and 96 contrast-enhanced extraocular muscle sampled volumes (EOM-SV) estimated in 8 (4 + 4) randomly selected patients.
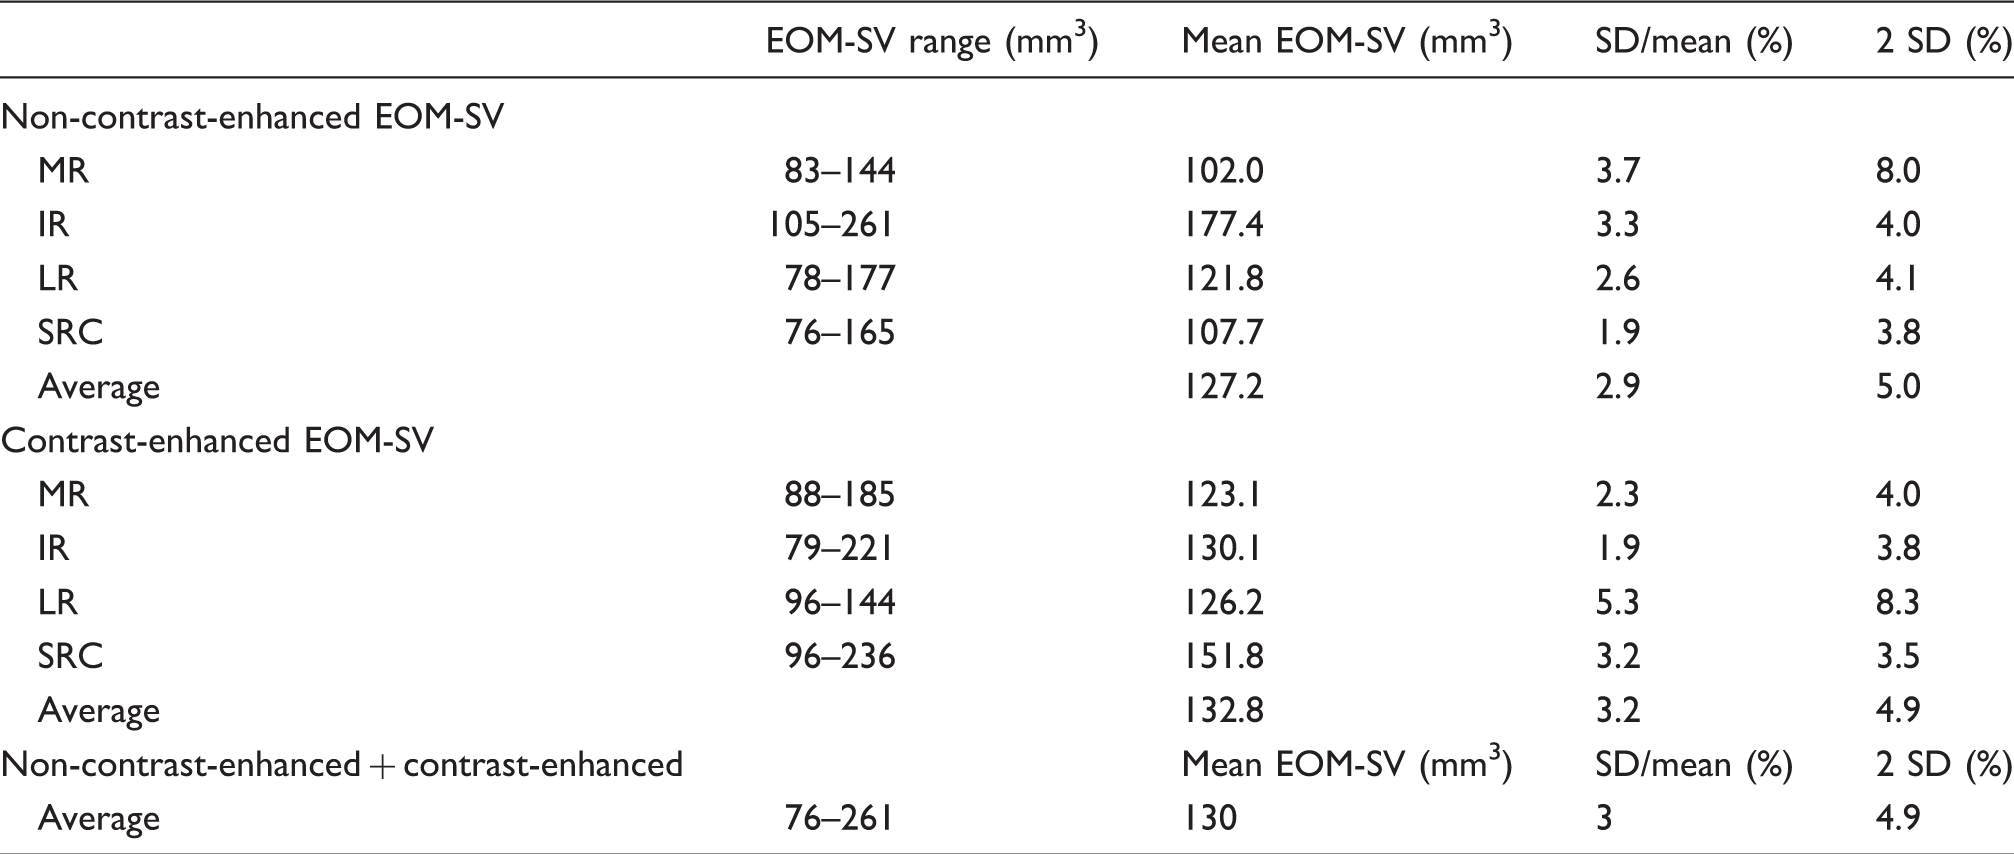
MR, medial rectus; IR, inferior rectus; LR, lateral rectus; SRC, superior rectus complex; EOM-SV, extraocular muscle sampled volume.
Discussion
In this study, we performed the EOM-SV segmentation and highlighted a significant correlation between HI and both non-contrast and contrast-enhanced EOM-SV. HI exhibited a stronger relationship with the EOM-SV than with the EOM-CSA.
This is probably because a volume parameter (EOM-SV) provided more comprehensive information than did a measure of area (CSA). Indeed, the correlation between HI and EOM also indirectly revealed the effect of the EOM-SV and EOM-CSA on proptosis, because the increased infra-orbital pressure determined by the EOM enlargement results in protrusion of the globe. Since the EOM-SV represented a broader area involved by the pathological enlargement, it demonstrated spindle-like EOM involvement and explained the increase in infra-orbital pressure that results in proptosis more exhaustively compared with a single coronal CSA. Our findings agree with reports describing the involvement of an extensive EOM portion in GO (10,11). However, neither the correlation between HI and EOM-SV nor the regression coefficients reached the maximum possible value. Probably, this indicated that retro-orbital fat imbibition and neo-adipogenesis contributed to proptosis (12–14). The contrast-enhanced EOM-SV correlated better with proptosis. This is likely because contrast enhancement provided a more accurate assessment of the EOM and of the rich vascularity and wide interstitial spaces that are found, especially in the orbital layer (15).
In patients showing marked EOM-SV changes over time, it is critical to determine whether the difference is reliable (response/no response to therapy) or is operator-dependent. Since changes in volume falling within the range of ±2 SD of the mean would, by definition, not be significantly different from the mean at a 5% level of significance (16), a change >2 SD (4.9%) constituted the lowest detectable significant difference by this technique. Consequently, if the EOM volume change compared to a baseline examination exceeds 3.5–8.3%, it is caused in 95% of cases by the disease or by treatment, not by operator-dependent factors. Moreover, a diagnosis of pathological EOM enlargement based on a value in excess of a cut-off is not reliable. In fact, there is currently no agreement in the literature on the cut-off values to be used (14–21). On the other hand, a tendency of the EOM-SV to expand would enable early diagnosis of pathological enlargement, even if the value did not reach a predefined cut-off.
There is no consensus on how to measure EOM volume. The method described herein overcomes the disadvantages of current approaches, where a change of 6–17% is required to reach significance in patients with thyroid-associated ophthalmopathy (22–24). In fact, these approaches alternate measurements between the coronal and the axial plane and manual and semi-automatic outlining and are hampered by the difficulty of segmenting the muscles at the tendon insertion (16,25,26). Notably, the EOM-SV can be calculated exclusively on coronal images, which are least affected by the partial volume and curved shape of the EOM (11, 6). In addition, the segmentation of the central portion of the muscles excluded the influence of the tendon insertions. Use of the polygon selection tool facilitated EOM segmentation, where the markedly enlarged muscles were virtually indistinguishable from one another. Segmentation and measurement of an orbit (4 EOM-SV) took approximately 8 min, which is consistent with routine clinical use, and did not require special training.
High-field strength imaging with IDEAL sequences helped EOM volume segmentation using an anisotropic technique. The use of 3-T MRI increases the difference in the chemical shift between water and fat. The IDEAL technique uses three asymmetric echoes to calculate a field map. The signal provides IDEAL water and IDEAL fat, highlighting how water and fatty acids contribute to the resonance signal. While the anisotropic sequences and parallel-imaging techniques keep the signal-to-noise ratio high, resulting in a shorter scanning time (27). The examination of axial T1W and T2W IDEAL water and fat images allowed for the depiction of all infra-orbital structures in the prefascial and retrofascial spaces, which consist of loose cellular intraconal and extraconal tissue (28). In addition, the non-contrast T1W IDEAL fat sequences made it possible to discriminate the hypointense signal of the maxillary sinus from the hypointense EOM signal.
This study found that non-enhanced and contrast-enhanced sequences are both suitable to assess the EOM-SV. Furthermore, both sequence types effectively depict the acute active and chronic inactive phases of GO by identifying EOM fatty degeneration and scarring (29–33). Orbital ultrasound (US) and computed tomography (CT) can be employed to assess disease activity and severity. However, US provides suboptimal EOM measurement and poor visualization of the orbital apex, while radiation exposure and a lack of correlation with disease activity make CT not ideally suited in the follow-up of GO patients (34). Altogether, we feel that MRI is the most informative imaging technique to assess and monitor these patients. The non-contrast sequences allow both qualitative and quantitative follow-up, avoiding the toxicity and cost of gadolinium and providing comprehensive information for clinical decision-making, whereas the contrast-enhanced sequences provide for optimal staging of EOM scarring and differentiate GO from other infra-orbital lesions (35).
Our study is preliminary and as such has several limitations. First is the small sample size. A study with a larger sample is needed to confirm the role of the EOM-SV as a dimensional parameter of EOM enlargement in GO patients. Second, these patients may show a wide spectrum of orbital soft tissue volume changes ranging from pure muscle to pure fat (36). We could not establish whether EOM-SV size changes correlate with proptosis severity in patients with predominantly retro-orbital fat tissue involvement because there were none in our sample; measuring retro-orbital fat volume may be the best option in such patients. In addition, this study is retrospective. Moreover, other sources of error besides observer error may be present, such as the error related to the anatomical changes due to muscle contraction and the error inherent to the partial volume effects. Further work is required to achieve an accurate distinction between the volume changes due to disease or treatment and those related to technical issues.
In conclusion, 3-T MRI IDEAL anisotropic sequences provide both non-contrast and contrast-enhanced measurement of the EOM-SV. In GO patients, EOM-SV can be used to assess EOM enlargement and is more predictive of proptosis than EOM-CSA. Its measurement is reproducible, and changes of 3.5–8.3% can be assumed to be true volume changes.
Footnotes
Declaration of conflicting interests
The author(s) declared no potential conflicts of interest with respect to the research, authorship, and/or publication of this article.
Funding
The author(s) received no financial support for the research, authorship, and/or publication of this article.