
Abstract
Background
For decades, the most widely used imaging technique for myeloma bone lesions has been a whole-body skeletal X-ray survey (WBXR), but newer promising imaging techniques are evolving.
Purpose
To compare WBXR with the advanced imaging techniques 18F-fluorodeoxyglucose (FDG) positron emission tomography (PET)/computed tomography (CT), 18F-sodium fluoride (NaF) PET/CT and whole-body magnetic resonance imaging (WB-MRI) in the detection of myeloma bone lesions.
Material and Methods
Fourteen patients with newly diagnosed multiple myeloma were prospectively enrolled. In addition to WBXR, all patients underwent FDG-PET/CT, NaF-PET/CT, and WB-MRI. Experienced specialists performed blinded readings based on predefined anatomical regions and diagnostic criteria.
Results
In a region-based analysis, a two-sided ANOVA test showed that the extent of detected skeletal disease depends on the scanning technique (P < 0.0001). Tukey’s multiple comparison test revealed that WB-MRI on average detects significantly more affected regions than WBXR (P < 0.005), FDG-PET/CT (P < 0.0001), and NaF-PET/CT (P < 0.05). In a patient-based analysis, a Cochran’s Q test showed that there are no significant differences in the proportion of patients with bone disease detected by the different scanning techniques (P = 0.23). Determination of intrareader variability resulted in Kappa coefficients corresponding to moderate (FDG-PET/CT) and substantial agreement (WB-MRI, WBXR, NaF-PET/CT).
Conclusion
WB-MRI detects on average significantly more body regions indicative of myeloma bone disease compared to WBXR, FDG-PET/CT, and NaF-PET/CT. The lack of significance in the patient-based analysis is most likely due to the small number of study participants.
Introduction
The vast majority of myeloma patients develop bone lesions during their course of disease. Myeloma bone lesions are a major cause of morbidity and mortality, and complications include pathologic fractures, severe bone pain, and spinal cord compression. The presence of myeloma bone lesions has significant impact on treatment strategy and the patients’ performance status and survival (1,2).
A systematic review based on 32 studies compared modern imaging techniques with whole-body skeletal X-ray survey (WBXR) (3). The newer imaging methods included magnetic resonance imaging (MRI), computed tomography (CT), 18F-fluorodeoxyglucose-positron emission tomography (FDG-PET), and FDG-PET combined with CT (FDG-PET/CT). The newer imaging methods detected up to 80% more myeloma bone lesions than WBXR. In only four out of the 22 studies that included MRI examinations was MRI performed as a whole-body scan (WB-MRI). None of the included studies investigated the diagnostic value of 18F-sodium fluoride (NaF) PET/CT, reflecting the sparse literature on NaF-PET/CT application in myeloma patients.
Therefore, we undertook a comparative study of WBXR vs. FDG-PET/CT, NaF-PET/CT, and WB-MRI in the detection of bone lesions in newly diagnosed myeloma patients.
Material and Methods
Participants
The study protocol was approved by the regional ethics committee (approval number H-3-2012-022), and the study participants were prospectively enrolled in the period from October 2012 to August 2015. Written informed consent was obtained from all participants.
The study population consisted of 14 patients (seven women, seven men; mean age = 68 years; age range = 53–87 years) with newly diagnosed multiple myeloma diagnosed according to standard criteria (4). One additional patient was recruited, but could not complete the MRI scanning and was excluded, as the patient decided not to undergo further project scans.
Exclusion criteria were: bone metabolism disorder; other malignancy within the last ten years; claustrophobia; overweight exceeding the scanning capacity (>195 kg); allergy to iodinated contrast media; estimated glomerular filtration rate < 45 mL/min; and contraindications for MRI. The project scans were performed in random order, within an average of 14 days (range = 3–33 days) from the WBXR.
All imaging was performed before initiation of any chemotherapy. Some patients (5/14) had initiated steroid within 20 days of imaging.
WBXR data acquisition
WBXR was performed using a standard X-ray unit (DX Digital Diagnost 2.1.4 2012, Philips Healthcare, Best, The Netherlands). The WBXR comprised 18 conventional radiographs of the entire skeleton: skull (two planes); cervical/thoracic/lumbar spine (two planes); chest; pelvis; upper arms; thigh bones; forearms; and lower legs.
Total acquisition time was approximately 40 min and the average radiation dose was approximately 1 mSv.
18F-FDG-PET/CT data acquisition
The patients were fasting 5 h before the intravenous tracer injection; the scanning (Either Gemini TF, Philips Healthcare, Best, The Netherlands or Biograph mCT 64 S, Siemens Healthcare, Munich, Germany based on availability) was performed 1 h ± 10 min post injection. The average 18F-FDG dosage was 353 MBq (range = 213–400 MBq).
First the CT scan was obtained, then immediately after the PET emission scan. The patients were positioned supine head-first with arms above the head. Images were obtained from the top of the skull to just below the knees. Total scan time was 15–20 min.
The first three participants underwent a low-dose CT scan. Due to a change in our CT protocol, the remaining study participants underwent a diagnostic CT with intravenous iodinated contrast. The total radiation dose from the FDG-PET/CT scan was approximately 8 mSv (performed with low-dose CT) and approximately 16 mSv (performed with diagnostic CT).
PET/CT examination protocols.
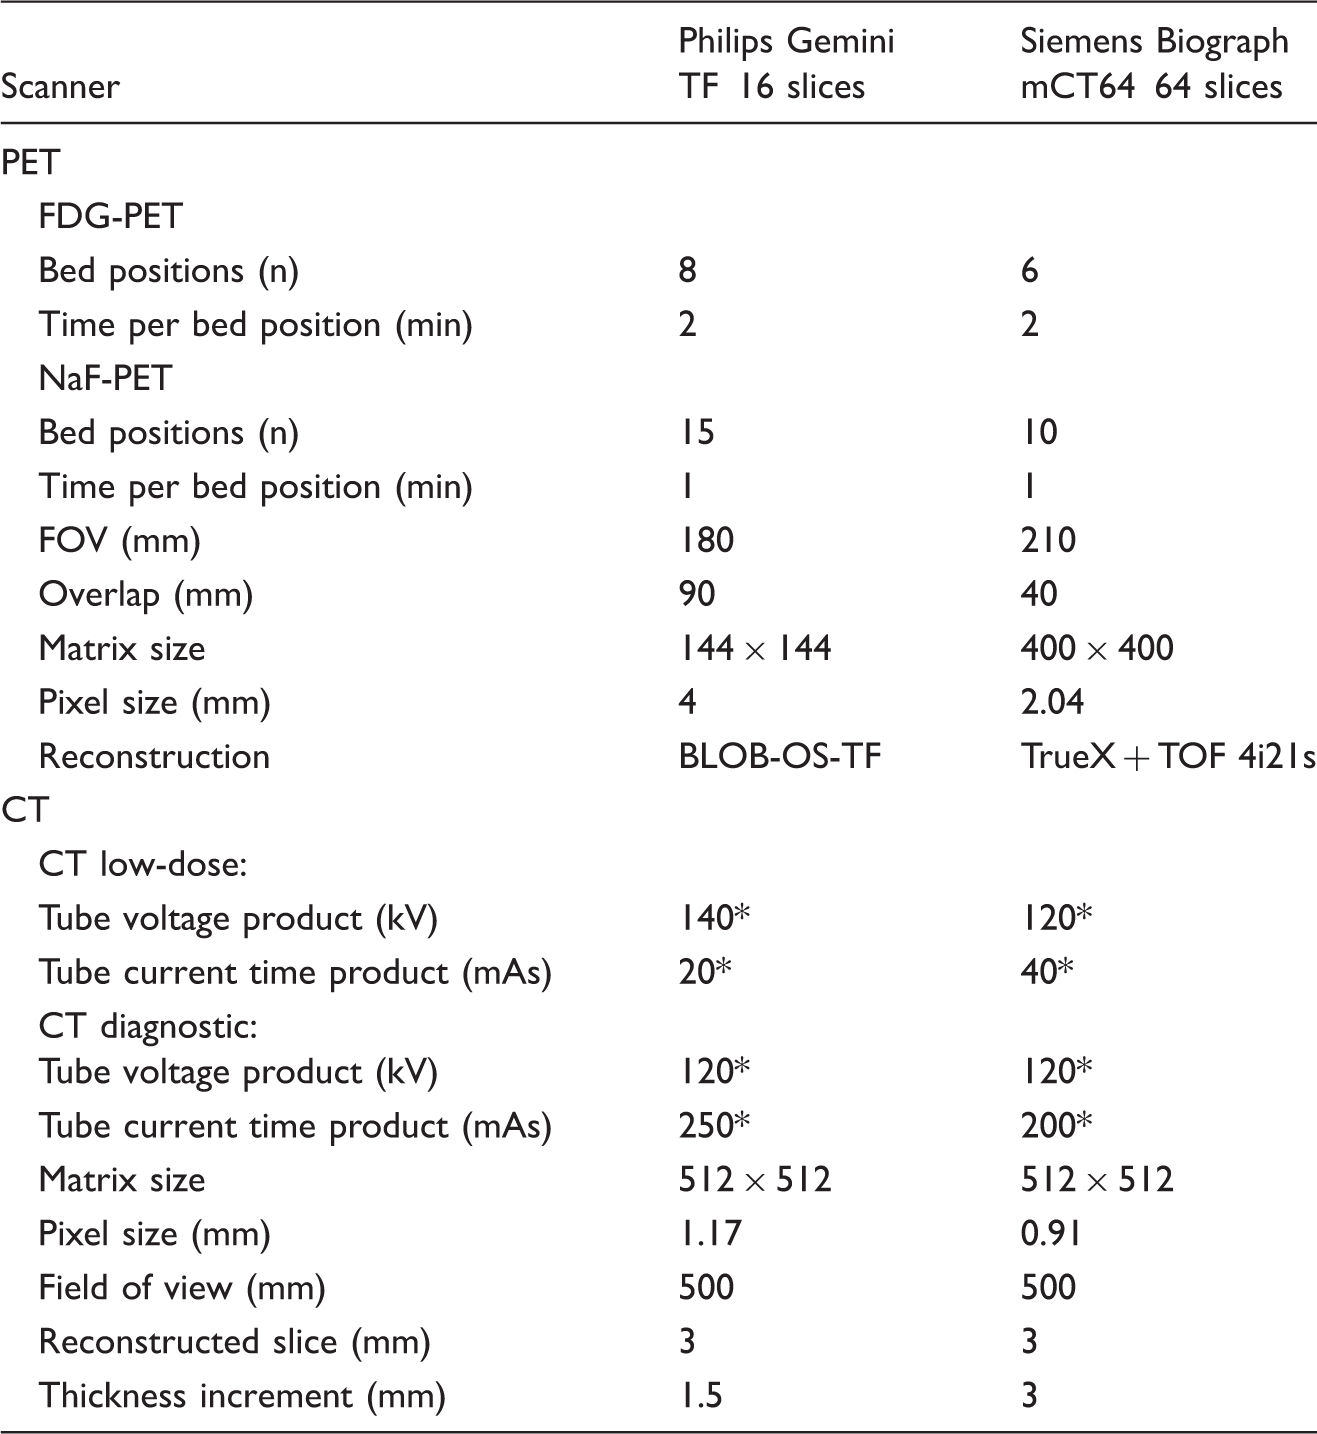
*Reference dose CareDose4D.
18F-NaF-PET/CT data acquisition
The scanning (Either Gemini TF, Philips Healthcare or Biograph mCT 64 S, Siemens Healthcare based on availability) was performed 30 min after the intravenous administration of 18F-NaF with an average dose of 200 MBq (range = 198–213 MBq) without any special patient preparations beforehand. All CT scans were performed as a low-dose CT.
Patients were positioned supine head-first with arms above the head. Images were obtained from the top of the skull to just below the knees. The total scan time was approximately 15 min. The total radiation dose from the NaF-PET/CT scan was approximately 8 mSv. Further technical details are given in Table 1.
MRI data acquisition
WB-MRI was performed on either a whole-body 1.5-T MRI Achieva with a Q-body coil (Philips Healthcare) with a Q-body coil (participants 1–5) or a whole-body 3.0-T MRI (Ingenia; Philips Healthcare) with a dedicated phased array coil (participants 6–14) based on availability. The examination protocol consisted of coronal T1, STIR-weighted images, and axial diffusion-weighted images (DWI) b1000. In addition, DWI b0 and sagittal T1 of the vertebral spine were obtained in study participants 6–14.
MRI examination protocol. 1.5T Philips Achieva, Q-body coil.
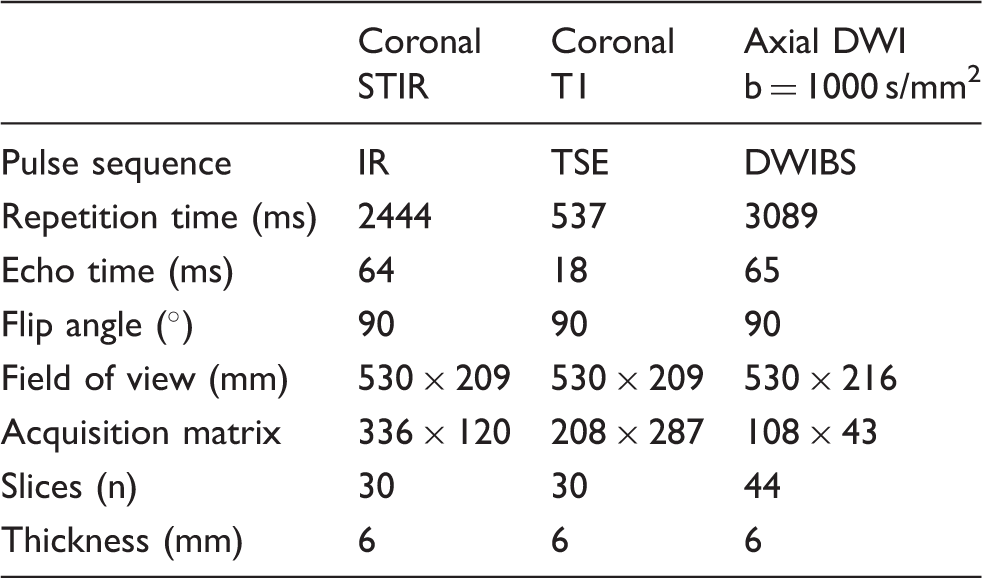
IR, inversion recovery; TSE, turbo spin echo; DWIBS, diffusion-weighted whole-body imaging with body background signal suppression.
MRI examination protocol. 3.0T Philips Ingenia, dedicated phased array coil.

IR, inversion recovery; TSE, turbo spin echo; DWIBS, diffusion-weighted whole-body imaging with body background signal suppression.
Image evaluation
Experienced specialists in the field of radiology and nuclear medicine interpreted the images. The primary readings were performed after the inclusion of the last participant and within a short period of time. Secondary readings were later performed to determine intra reader variability.
Each reader performed the evaluations blinded to other imaging results as well as to the patient’s clinical condition. The reader assessed whether myeloma indicative bone lesions were present in eight predefined skeletal body regions covered by all scanning techniques: (i) skull; (ii) ribs; (iii) pelvis; (iv) cervical spine; (v) thoracic spine; (vi) lumbar spine; (vii) long bones (upper arms and thighs); and (viii) other regions (shoulder blades, breast bone, collar bones).
As in a previous study by Narquin et al. (5), the radiographic evaluation was based on the Lodwick classification system of bone destruction. We considered Lodwick classification type 1b/1c (punch-out lesion with distinct/indistinct border), 2 (moth-eaten pattern), and 3 (permeative pattern) indicative of osteolytic myelomatous bone disease (6).
The MRI evaluation was based on the combined findings on T1-weighted (T1W) images, STIR-weighted images, and DWI as described in Bone Marrow MRI by Moulopoulos and Koutoulidis, with the typical pattern of focal myeloma lesions being hypointense on T1, hyperintense on STIR, and with high intensity on DWI (7). The PET/CT scans were initially analyzed according to criteria described by Mesguich et al. (8). However, the most recent imaging criteria from the International Myeloma Working Group (IMWG) state that PET uptake alone is not adequate to diagnose a myeloma bone lesion and that a correlated CT finding of an osteolytic bone destruction is required (4). Therefore, we modified the primary FDG-PET/CT analysis to the new criteria as this was possible due to separate recording of the FDG-PET and CT findings. A parallel modification was possible with the secondary NaF-PET/CT reading only, and for that reason this analysis was included in the statistical analyses.
Statistical analysis
A Cochran’s Q test was performed for a patient-based analysis, testing whether there are differences in the proportion of patients detected with bone disease by each scanning technique. The patient with the missing FDG-PET/CT was excluded from the Cochran’s Q-test, as the test cannot handle a missing observation.
A two-sided ANOVA test was performed for a region-based analysis, testing whether there are differences between the average numbers of affected regions detected by each scanning technique. Subsequently, Tukey’s multiple comparison test was conducted to test for pairwise differences. The missing FDG-PET/CT scan was taken into account in both tests.
The null hypothesis for the tests was that there are no differences in the outcomes of the scanning techniques. A P value < 0.05 was considered the level of significance.
Intrareader variability was determined calculating Kappa coefficients. The analyses were performed using the statistical software package “R”.
Results
Proportion of patients with bone disease per modality.

*One patient did not have a FDG-PET/CT scan performed.
Number of affected regions per patient per modality.

Patients 1, 4, 8, 9, and 11 initiated steroid treatment within 20 days of imaging.
*One patient did not have a FDG-PET/CT scan performed.
Tukey’s multiple comparison test showed that WB-MRI on average detects significantly more affected regions compared to WBXR (P < 0.005), FDG-PET/CT (P < 0.0001), and NaF-PET/CT (P < 0.05). All other pairwise comparisons were non-significant.
Anatomical distribution of the total number of affected regions per imaging technique.

*One patient did not have a FDG-PET/CT scan performed.
No extramedullary myeloma disease (EMD) was detected in any of the patients.
Intrareader variability.
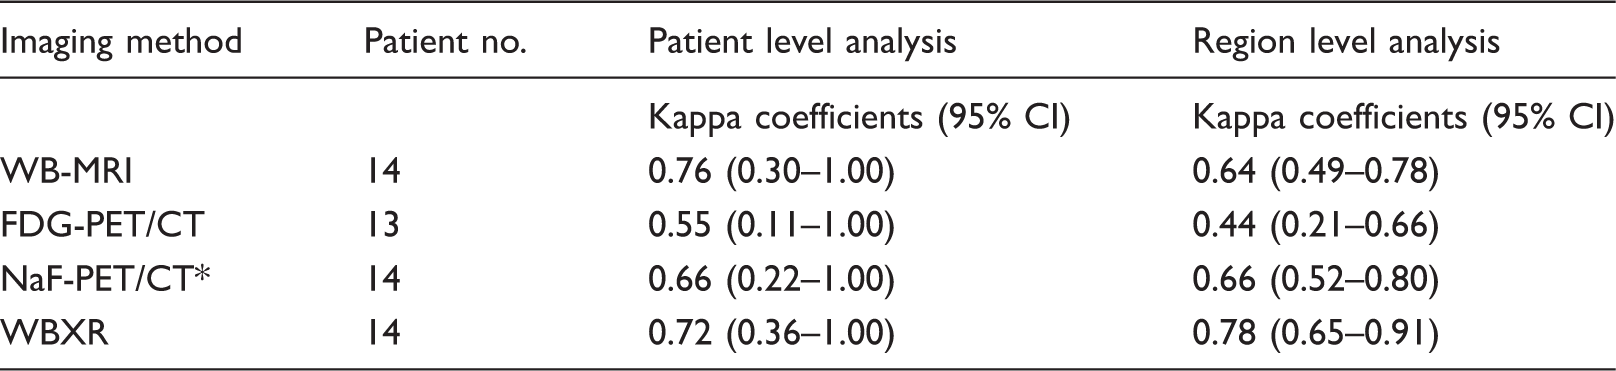
*Calculation is based on image reading criteria described by Mesguich et al. (8).
Discussion
Accurate detection of myeloma bone lesions is crucial for treatment planning and patient prognosis, and increasingly important with the development of new treatment strategies.
At WBXR, an X-ray beam is projected through the body and absorbed in varying degrees in the different tissues, thereby allowing an image to be detected. Myeloma bone lesions typically appear as well-defined small “punched-out” lesions, representing bone destruction and replacement of marrow cells with plasma cells (Fig. 1a) (9). However, the use of WBXR can result in an underestimation of the extent of bone disease, since typically 70% or more of the bone tissue needs to be destroyed before a focal osteolytic lesion becomes apparent (2).
A 71-year-old man with newly diagnosed multiple myeloma. A lesion in the glenoid cavity of scapula bone is detected by all four imaging techniques (arrows). (a) Whole-body X-ray: a “punched-out” lesion. (b) FDG-PET/CT: accumulation of FDG representing the lesion. (c) NaF-PET/CT: accumulation of NaF in the rim of the lesion. (d–g) Whole-body 3T MRI: the lesion is detected on all four MRI sequences: (d) hyperintense on coronal STIR, (e) hypointense on coronal T1W imaging, (f) high signal intensity on axial DWI b1000, and (g) low signal intensity on axial ADC. ADC value is 1.05 × 10⁻³ mm2/s (SD = 0.11).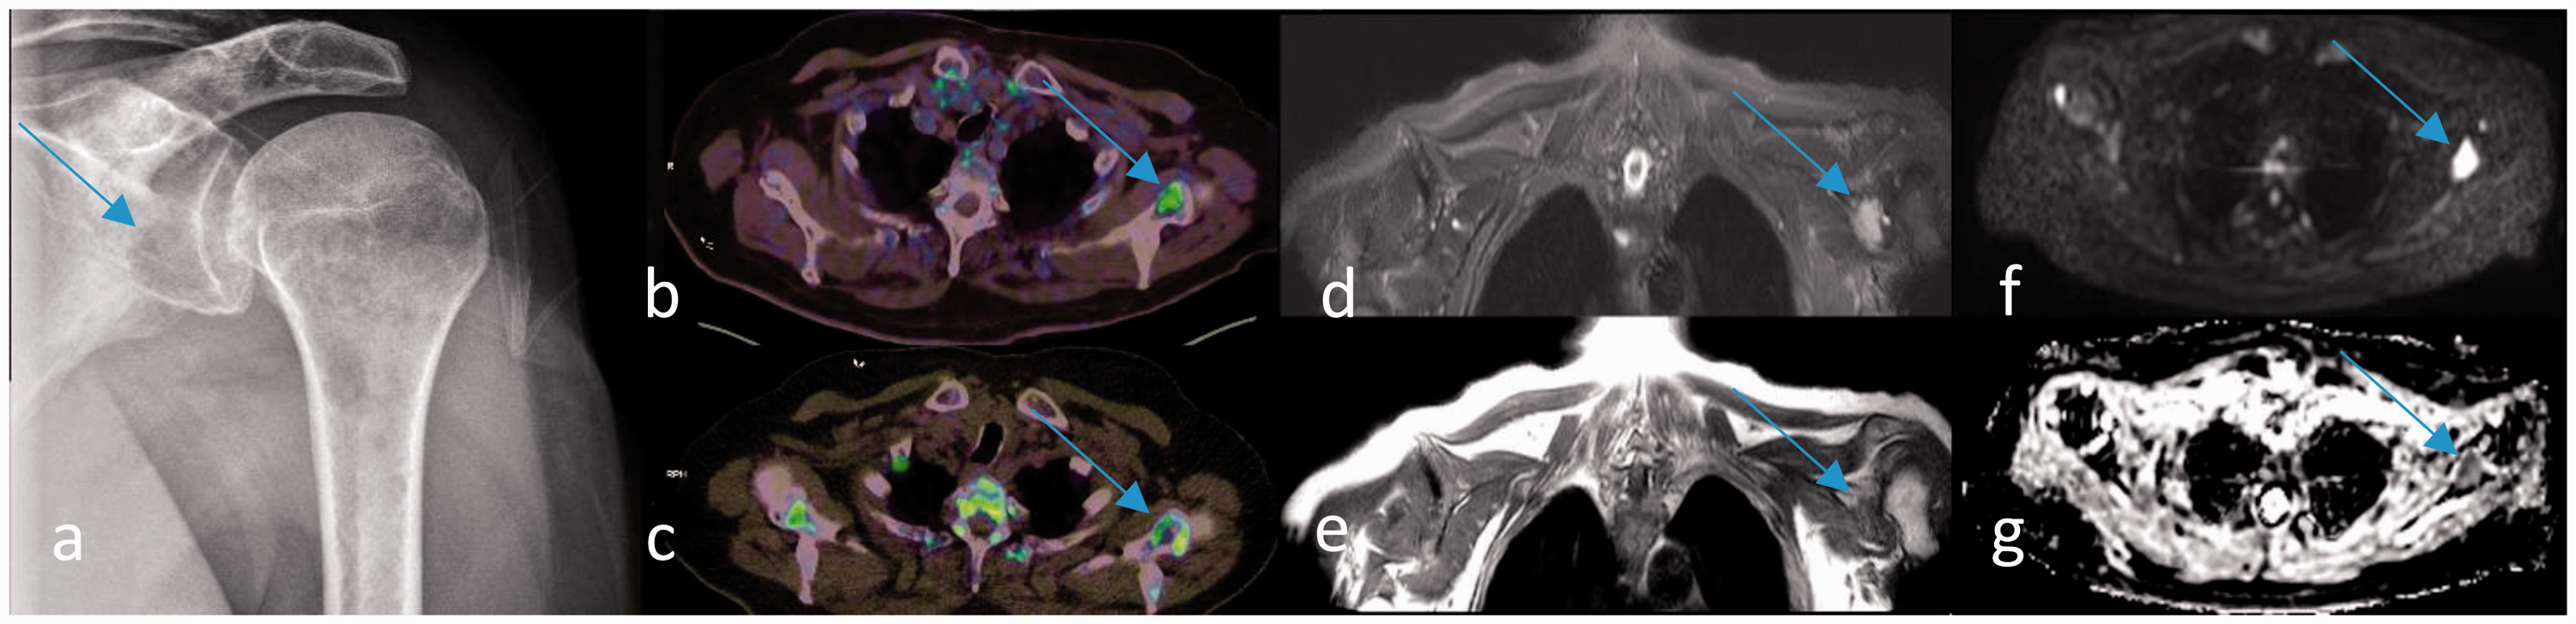
In PET/CT imaging, a radioactive tracer is administered intravenously. Subsequently, the PET camera detects tissues with increased tracer uptake and the CT component allows precise anatomical localization of these areas. The most widely used PET tracer FDG accumulates in metabolically active cells with high glucose demand, including malignant cells (Fig. 1b). The PET tracer NaF is bone-specific and accumulates in bones reflecting bone modelling and regional blood flow. In osteolytic bone lesions, NaF accumulates in the rim of the lesions corresponding to osteoblast activity (Fig. 1c) (10–12).
MRI is based on radio waves and magnetic fields and is, as opposed to WBXR and PET/CT, radiation-free. Advances in the MRI technology have enabled the acquisition of WB-MRI images and DWI. Conventional MRI images can detect replacement of the normal bone marrow by tumor cells regardless of the degree of bone destruction (7). DWI provides functional information based on the fact that tumor tissue has limited diffusion of water and appears as high signal-intensity regions (Fig. 1d–g) (13).
The differences in the physical and technical principles behind the imaging modalities can explain the discrepancy in their diagnostic performances. Fig. 2 shows a myeloma lesion in the body of C7 detected on WB-MRI only.
A 61-year-old woman with newly diagnosed multiple myeloma. A lesion in the body of C7 is detected on whole-body 3T MRI only (arrows). No C7 lesion is detected on (a) whole-body X-ray, (b) FDG-PET/CT, or (c) NaF-PET/CT (circles). The C7 lesion is detected on all four MRI sequences with findings indicative of a myeloma bone lesions (arrows): (d) hypointense on coronal T1W imaging, (e) hyperintense on coronal STIR, (f) high signal intensity on DWI b1000, and (g) low signal intensity on axial ADC. ADC value is 0.52 × 10⁻³ mm2/s (SD = 0.1).
The lack of an ideal reference standard is a limitation in diagnostic studies. Ideally, biopsies of all suspected myeloma bone lesions (and theoretically of non-involved bone too) should be performed to histologically confirm the image findings. However, this was neither practically nor ethically possible. In this study, all image findings are considered indicative of myeloma bone disease and detection rates are compared as in previous studies (14–17).
This study shows that WB-MRI, on average, detects significantly more regions with myeloma bone disease than WBXR, FDG-PET/CT, and NaF-PET/CT. The sparsely investigated NaF-PET/CT is not superior, but equivalent to WBXR. A comparison of the anatomical distribution of the bone disease showed that WB-MRI outscores the other imaging techniques in all regions apart from the skull region, where WBXR detects the largest proportion of patients with myeloma bone disease. This is in line with previous descriptions of WBXR as being particularly sensitive in the skull and the extremities and is explained by the lack of overlapping structures in these regions (2).
The small number of included study participants most likely caused the lack of significance in the patient-based analysis. The difficulties with the recruitment of study participants were probably due to a low disease incidence combined with a comprehensive project-scanning regime.
The relatively long inclusion period had the consequence that not all WB-MRI and PET/CT were obtained on the exact same scanner and with the precise same scanning protocol during the whole period. However, all MRI scans were obtained as whole-body scans, and the convincing MRI results in regard to number of affected regions per patient seem independent of the MRI scanner used. In addition, all FDG-PET findings had correlated CT findings both when low dose CT and diagnostic CT were performed, and therefore the change of CT protocol did not influence the FDG-PET/CT results. We therefore believe that these minor technical differences did not influenced the overall results.
Studies elucidating the value of NaF-PET/CT in multiple myeloma patients are limited. The NaF-PET/CT results in this study are not convincing and thereby in line with other recently published prospective studies (10,12). A challenge for NaF-PET/CT is that NaF accumulates in the rim of the osteolytic lesions, which can make the detection of smaller myeloma lesions difficult. In addition, the NaF accumulation represents a secondary osteoblastic reaction to the myeloma cells in the bone marrow, and therefore might not be visible at an early stage.
Five of the study participants had initiated steroid therapy at the time of imaging (< 20 days). As known from treatment monitoring studies in other diseases, corticosteroids may result in decreased FDG uptake representing decreased bone marrow activity after successful treatment (18–20). Similarly, lower signal intensities and higher ADC values have been observed after steroid treatment on DWI MRI (21). In daily clinical practice, however, myeloma patients have often initiated steroid therapy at time of imaging due to their clinical condition. Hence, this study reflects daily clinical practice and the setting to which the results will be applied. Future studies are needed to investigate the influence of steroid on FDG-PET/CT and DWI MRI in myeloma patients.
FDG PET/CT may lead to false-negative results in the presence of skull lesions, due to physiologically high FDG uptake in the brain. Both FDG-PET/CT and WB-MRI can detect EMD. The identification of EMD is important, as it identifies patients with an inferior prognosis (2). However, no EMD was detected in this study.
In line with Regelink et al., we found that WB-MRI outscored both WBXR and FDG-PET/CT, indicating that WB-MRI is a valuable alternative as imaging technique in newly diagnosed myeloma patients (3). A determination of the intrareader variability in this study resulted in Kappa coefficients at the favorable end of the scale underlining that the image analyses are reliable.
In conclusion, WB-MRI detects on average significantly more regions indicative of myeloma bone disease compared to WBXR, FDG-PET/CT, and NaF-PET/CT. The sparsely investigated NaF-PET/CT is not superior, but equivalent to, the current standard WBXR.
Footnotes
Acknowledgments
The authors thank all the patients who participated in the study. The authors also thank research nurse Jytte Kock, who was responsible for the recruitment of study participants, senior radiographer Jakob M. Møller, who was responsible for the MRI protocol, and statistician Stig Schou Mortensen, who provided statistical support.
Declaration of conflicting interests
The author(s) declared no potential conflicts of interest with respect to the research, authorship, and/or publication of this article.
Funding
The author(s) received no financial support for the research, authorship, and/or publication of this article.