
Abstract
Background
The apparent diffusion coefficient (ADC) value is known to be an indicator of tumor activity. The ADC value of high-grade clear-cell renal cell carcinoma (RCC) is significantly lower than that of low-grade clear-cell RCC.
Purpose
To investigate the utility of ADC values of clear-cell RCC by comparing ADC values between groups with T1a RCC (tumor size ≤ 4 cm) without metastasis and the group with metastasis.
Material and Methods
A retrospective review was performed on 51 patients with 51 RCCs who underwent 1.5 T magnetic resonance imaging (MRI) for evaluating a renal mass confirmed pathologically to be clear-cell RCC between January 2010 and August 2014. We compared ADC values between group A (T1a RCC without metastasis, T1aN0M0) and group B (RCC with metastasis) using the Mann–Whitney U test.
Results
The patients were divided into group A (n = 30; tumor size: median, 24.5 mm; range, 8–40 mm; ADC value [×10−3 mm2/s]: median, 1.71; range, 1.23–2.24) and group B (n = 21; tumor size: median, 87.5 mm; range, 18–150 mm; ADC value [×10−3 mm2/s]: median, 1.35; range, 0.91–1.94). The ADC value differed significantly between the two groups. The area under the receiver operating characteristic curve was 0.869. Using the optimum cutoff value (1.552 × 10⁻³ mm2/s), ADC had a sensitivity of 80.0% and specificity of 81.0%.
Conclusion
There was a statistically significant difference in the ADC between group A (T1a clear-cell RCC without distant metastasis) and group B (advanced clear-cell RCC with lymph node metastasis or distant metastasis).
Keywords
Introduction
Recently, the use of minimally invasive treatments such as radiofrequency ablation (RFA) and cryoablation for T1a (tumor size ≤ 4 cm) renal cell carcinoma (RCC) without distant metastasis has been gradually increasing (1–11). The potential advantages of these procedures are good local control and a minimally invasive approach. These procedures can also sometimes be used in patients who cannot withstand general anesthesia. Moreover, the preservation of renal function is excellent, even in patients with renal dysfunction, including elderly patients and those with a single or transplanted kidney. Clinical metastasis is evaluated using imaging; however, it is sometimes difficult to detect small metastases on imaging.
Previous studies have reported that the apparent diffusion coefficient (ADC), an indicator of the relevance of the cell-proliferative activity for determining nuclear grade and histological subtype, is significantly lower for high-grade clear-cell RCC than for low-grade clear cell RCC (12–15), suggesting its utility in clinical staging (16,17). We wanted to evaluate the additional value of the ADC values for other magnetic resonance imaging (MRI) features in the assessment of clear-cell RCC in clinical staging, especially for the presence of metastasis.
Therefore, the aim of this study was to investigate the utility of ADC values of clear-cell RCC by comparing ADC values between patients with T1a RCC without metastasis and those with metastasis.
Material and Methods
Patients
Our institutional review board approved this retrospective study and waived the requirement for informed patient consent. We retrospectively reviewed the surgical outcomes and radiological images of 127 patients who underwent treatment for pathologically confirmed RCC between January 2010 and August 2014. After the exclusion of 25 patients with non-clear-cell RCC, the records of 102 patients with clear-cell RCC who underwent 1.5 T MRI followed by radical/partial nephrectomy were further scrutinized for possible inclusion in this study. Of these 102 patients, an additional 42 patients who did not undergo preoperative renal MRI in our hospital and nine patients with tumor stages T1b, T2, T3, and T4 without metastasis were also excluded. Thus, a total of 76 patients were excluded, including four patients with contraindications for the administration of hyoscine-N-butylbromide. Finally, the records of 51 patients with 51 renal masses pathologically confirmed as clear-cell RCC, who underwent 1.5 T MRI in our hospital, were included for the analysis.
The patients were divided into the following two groups: group A, T1a clear-cell RCC without metastasis (T1aN0M0) who were able to become the candidates for minimally invasive treatment and group B, lymph node metastasis or distant metastasis (any T N1M0, any T any N M1). Bone metastasis was diagnosed using bone scintigraphy or follow-up images, and other metastases were confirmed pathologically before or after nephrectomy. The flowchart for patient selection in groups A and B are presented in Fig. 1.
Flowchart for patient selection.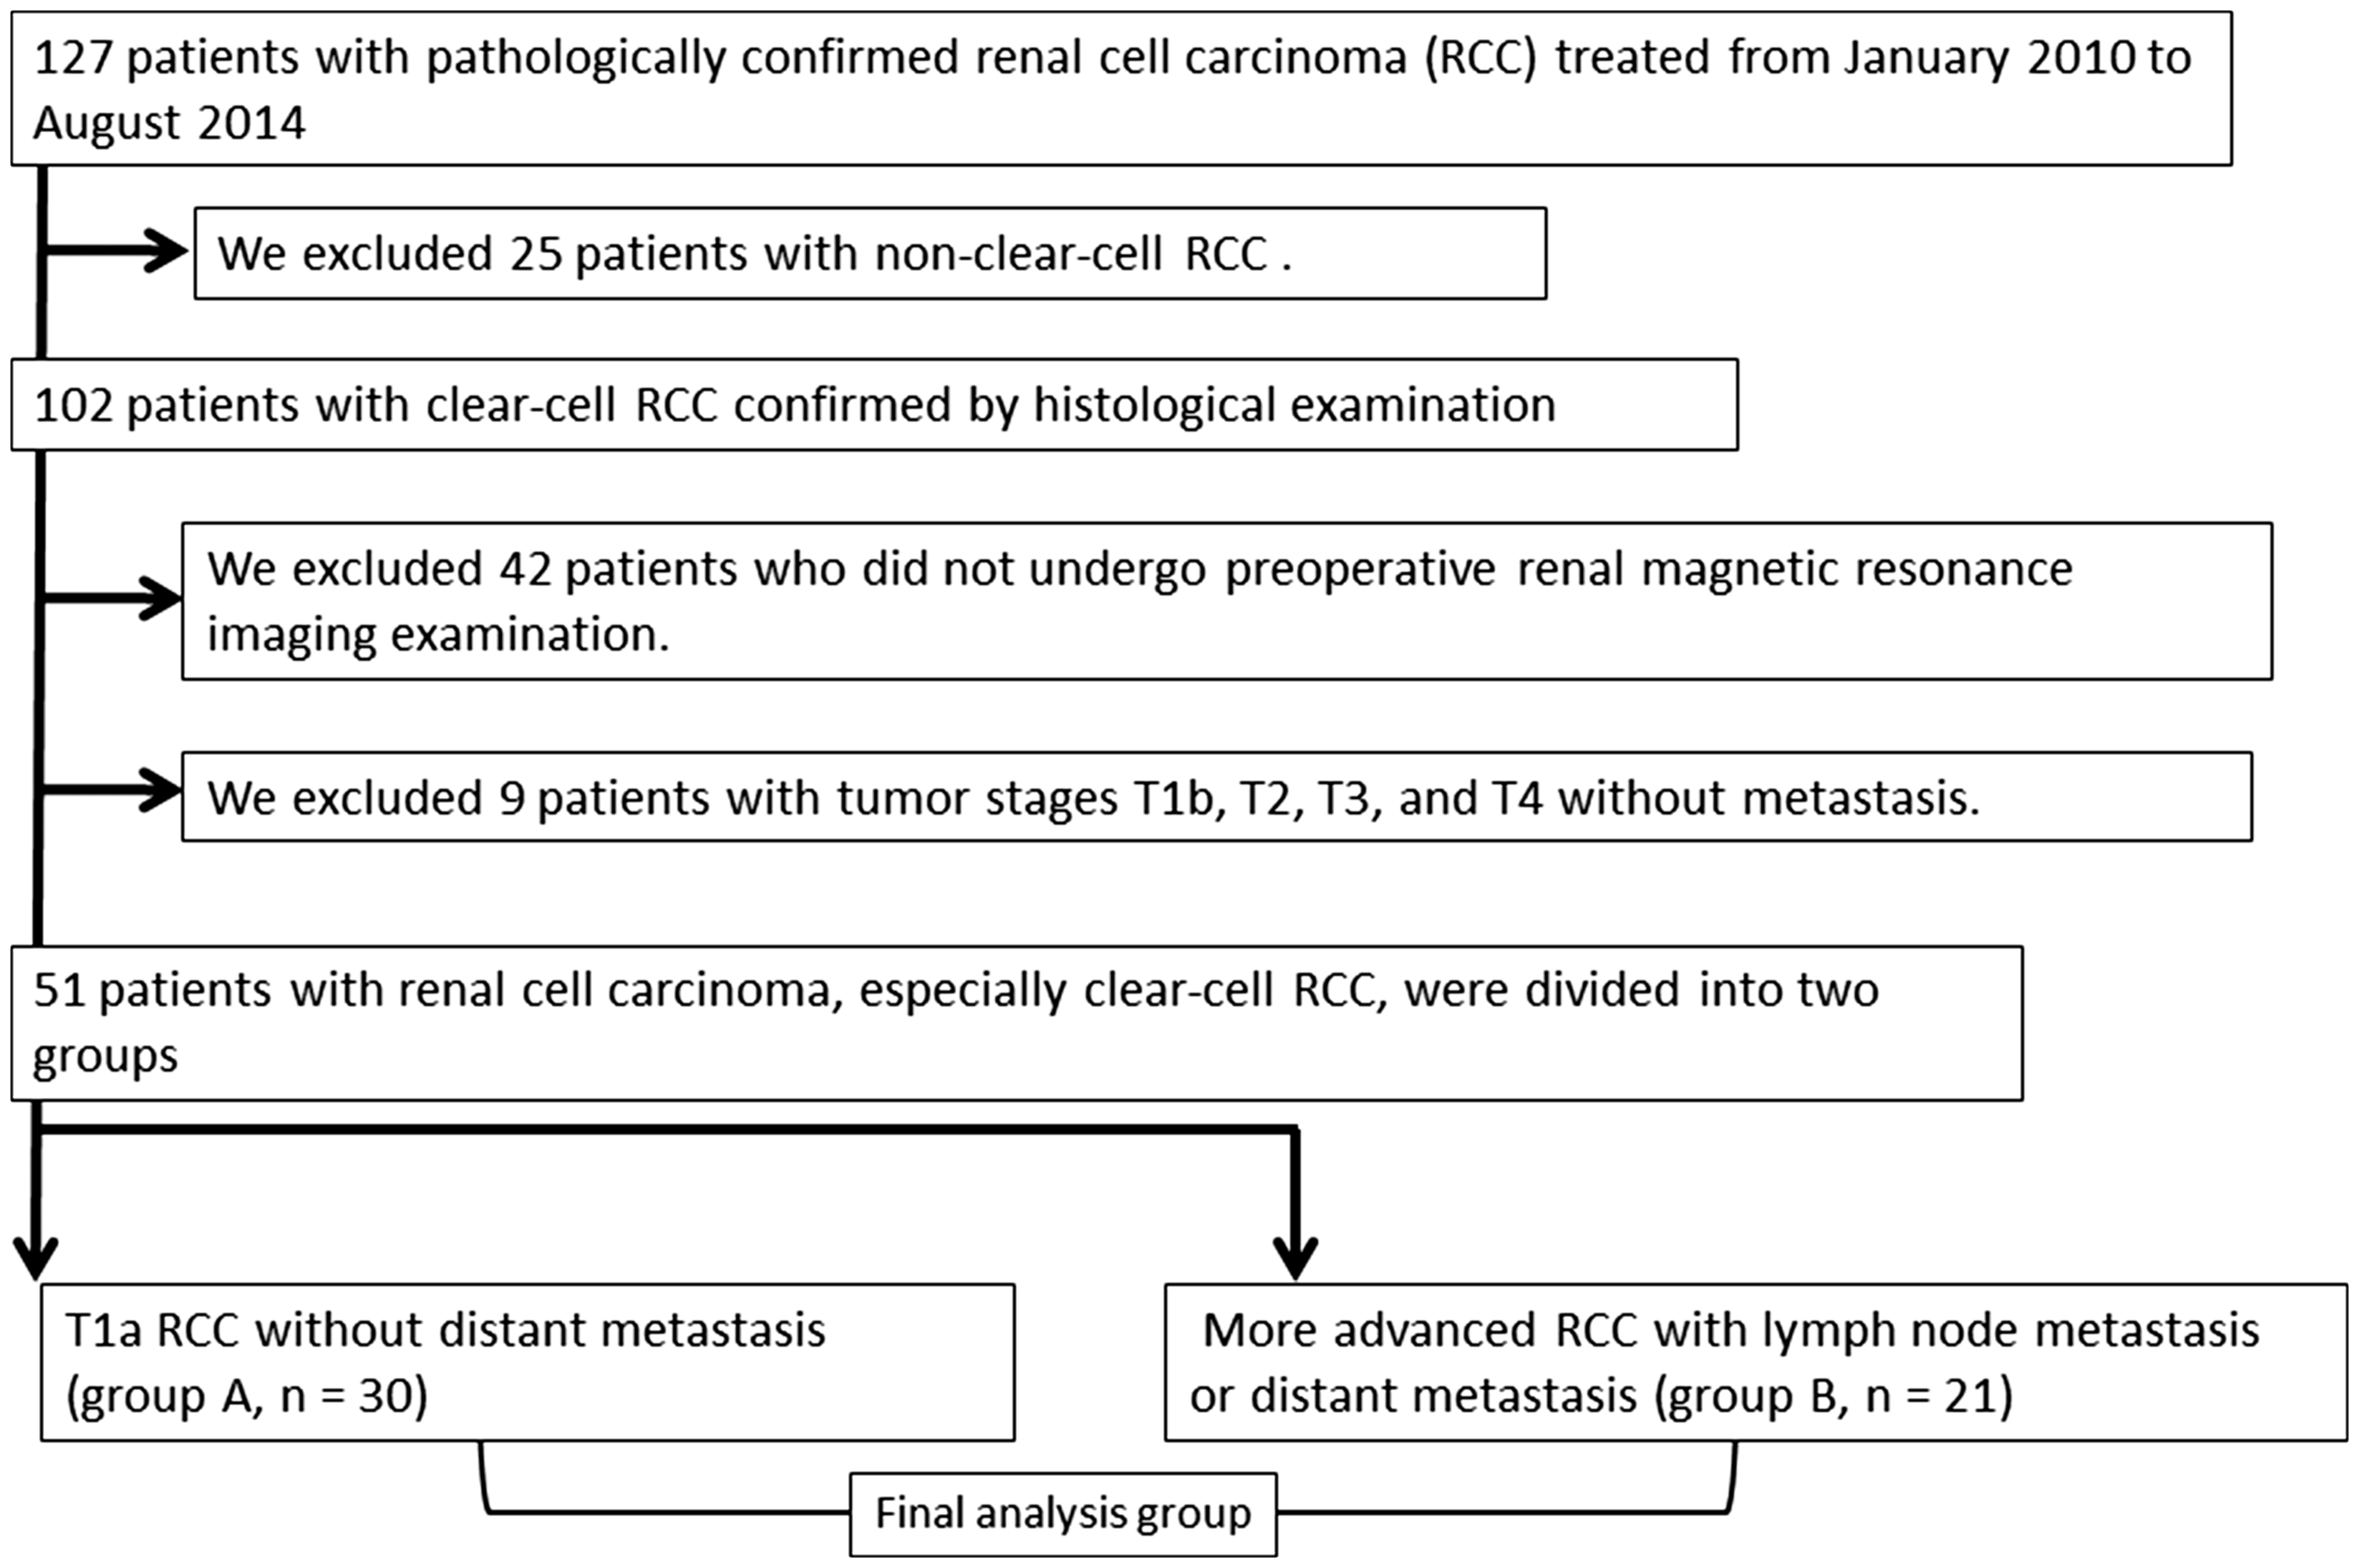
MRI technique
MRI parameters.

Gadopentetate dimeglumine (Magnevist; 0.1 mmol/kg) was intravenously injected at a rate of 2 mL/s with a power injector, followed by a 20-mL saline flush. Transverse free-breathing diffusion-weighted (DW) images were obtained using a single-shot spin-echo echo-planar sequence before contrast medium administration, with b-values of 0 and 800 mm2/s. Spectral spatial radio frequency pulses were used for water excitation. Then, ADC maps were generated using commercially available software (Advanced Workstation; GE Healthcare).
Patients with contraindications for administration of hyoscine-N-butylbromide (Buscopan; Boehringer Ingelheim Pharma GmbH & Co. KG, Biberach an der Riß, Germany), including hypersensitivity to anticholinergic drugs, paralytic ileus, benign prostate hyperplasia, closed-angle glaucoma, and shallow anterior chamber, were excluded.
Image analysis
MRI data for each of the 51 renal masses were assessed by one reviewer (RY) with 12 years of experience, who confirmed imaging diagnosis prior to the review of pathological findings. The ADC was manually calculated by setting a region of interest (ROI) within the tumor image. The ROI was chosen to include the solid components of the tumor and was set in as large an area as possible. Special care was taken to avoid necrotic, cystic, and hemorrhagic areas within the tumors. In cases of renal lesions not showing diffusion restriction, the ROI was placed in the most homogeneous portion. The ADC value from a single ROI was considered as the representative ADC of the renal lesion. The mean ROI size for ADC lesion measurement was approximately 85 mm2 (mean ROI area, 84.8 mm2; range, 75–104 mm2). ADC values are expressed as mean ± standard deviation in the form of A × 10−3 mm2/s up to three decimal places. The maximum tumor diameter was measured at the site of the maximum tumor area on T2-weighted (T2W) axial images.
Pathological analysis
All pathological data were assessed by a single uro-pathologist with 15 years of experience, who assigned a nuclear grade for each tumor using the Fuhrman classification (18) and was blinded to the MRI findings. The Fuhrman classification assigns tumors with grades of I–IV, with grade I indicating the best prognosis and grade IV indicating the worst prognosis (18).
Clinical staging
The clinical stage was determined according to the 2010 TNM classification of the American Joint Committee on Cancer (19). The preclinical stage was determined by image diagnosis. Renal ultrasonography images and plain chest radiographs were routinely obtained, and computed tomography (CT) or MRI was preoperatively performed. A bone scan, brain scan, or other investigation was only performed if indicated.
Statistical analysis
Correlations between the two groups and the Fuhrman grades were assessed using Spearman’s rank correlation analysis. The Kolmogorov–Smirnov test was used to determine whether the ADC data for each group were normally distributed. ADC values and tumor sizes were compared between the two groups using the Mann–Whitney U test for numerical values.
If the Mann–Whitney U test revealed a significant difference, receiver operating characteristic (ROC) analysis was performed to determine the area under the ROC curve and the optimal cutoff for the sensitivity, specificity, positive predictive value (PPV), negative predictive value (NPV), and accuracy of ADC values in the presence or absence of metastasis.
All statistical analyses were performed using the Statistical Package for the Social Sciences ver. 22.0 for Windows (IBM Corp, Armonk, NY, USA). A P value < 0.05 was considered statistically significant.
Results
The study included 51 patients (37 men, 14 women). The mean age of the patients was 64.7 years, and the mean interval between MRI and surgery was 15.5 days (range, 4–23 days). Group A included 30 patients and group B included 21 patients (lung metastasis: n = 4, lymph node metastasis: n = 14, bone metastasis: n = 3; single organ, solitary metastasis, or oligo metastases).
Pathological characteristics.

Group characteristics of ADC data.

P < 0.05.

The scatter plot of ADC values in groups A and B.

Transverse MR images of a left clear-cell RCC with metastasis (grade 2) in a 68-year-old man. T2W image shows a lobular mass with central necrosis. The size of the mass is 60 mm. (a) DW image shows high signal intensity at the solid part of the tumor. (b) On the ADC values obtained from ADC maps reconstructed using b-value combinations of 0 and 800 mm2/s is 1.027 × 10⁻³ mm2/s. The circle depicts an example of a ROI placement. The ADC of this case was lower than the optimal ADC cutoff value (1.552 [×10−3 mm2/s]). This case was true-positive for the optimal ADC cutoff value.
Discussion
This study aimed to investigate the utility of ADC values of clear-cell RCC by comparing ADC values between the group with T1a RCC without metastasis and the group with any metastasis. The difference in ADC values between the group with T1a RCC without metastasis and the group with any metastasis was statistically significant. ADC values of clear-cell RCC may be associated with the existence of metastasis. Therefore, in a clinical situation, clear-cell RCC with low ADC values should be examined extensively for the possibility of distant metastatic lesions.
A previous study reported statistically significant differences in ADC values between early stage (I and II) and advanced stage (III and IV) disease (P < 0.05) (17). Thus, the ADC of the primary tumor site of clear-cell RCC might be useful to clinically distinguish early-stage disease from more advanced disease with lymph node or distant metastasis. The difference in ADC values between the two groups may be used to estimate differences in the nuclear grade, especially the Fuhrman grade, as well as to assess cell-proliferative activity and high cellularity of a tumor that demonstrates restricted movement of water molecules (17).
T1a for RCC indicates a tumor ≤4 cm in diameter and T1b indicates a tumor 4–7 cm in diameter. There was a significant difference in the tumor size between the two groups in this study (P < 0.05, Mann–Whitney U test). Minimally invasive treatment, such as RFA and cryoablation, are established modalities for the treatment of small RCC without distant metastasis (1–11). The absence of distant metastasis should be confirmed before minimally invasive treatment. However, it is sometimes difficult to detect small metastatic sites using imaging. During follow-up, if the ADC is gradually decreasing, close attention should be paid to the appearance of metastasis. During preoperative clinical staging, especially in cases where it is impossible to use contrast enhancement to observe renal dysfunction and cases that have iodine allergy, the ADC value of the primary tumor site of clear-cell RCC may indicate a more advanced stage than that expected.
The present study had several limitations. First, this retrospective study included a relatively small number of patients. Second, only two b-values (0 and 800 mm2/s) were used for the calculation of the ADC. It may be desirable to acquire additional b-values to obtain more accurate ADC data. Third, we did not assess the reproducibility of the ADC values obtained for renal tumors. Fourth, we excluded patients with non-clear-cell RCC. The ADC has been reported to be significantly different between clear-cell RCC and non-clear-cell RCC (13). In addition, the ADC differed depending on pathological subtypes and grades (20).
In conclusion, there was a statistically significant difference in ADC values between T1a clear-cell RCC without distant metastasis and advanced clear-cell RCC with lymph node metastasis or distant metastasis. In renal masses with imaging features suggestive of clear-cell RCC and with an ADC less than 1.552 × 10⁻³ mm2/s, the possibility of metastasis should be considered.
Footnotes
Declaration of conflicting interests
The author(s) declared no potential conflicts of interest with respect to the research, authorship, and/or publication of this article.
Funding
The author(s) received no financial support for the research, authorship, and/or publication of this article.