
Abstract
Background
A 3 Tesla (3 T) magnetic resonance (MR) scanner is a promising tool for upper abdominal MR angiography. However, there is no report focused on the image quality of non-contrast-enhanced MR portography and hepatic venography at 3 T.
Purpose
To compare and evaluate images of non-contrast-enhanced MR portography and hepatic venography with time-spatial labeling inversion pulses (Time-SLIP) at 1.5 Tesla (1.5 T) and 3 T.
Material and Methods
Twenty-five healthy volunteers were examined using respiratory-triggered three-dimensional balanced steady-state free-precession (bSSFP) with Time-SLIP. For portography, we used one tagging pulse (selective inversion recovery) and one non-selective inversion recovery pulse; for venography, two tagging pulses were used. The relative signal-to-noise ratio (SNR) and contrast-to-noise ratio (CNR) were quantified, and the quality of visualization was evaluated.
Results
The CNRs of the main portal vein, right portal vein, and left portal vein at 3 T were better than at 1.5 T. The image quality scores for the portal branches of segment 4, 5, and 8 were significantly higher at 3 T than at 1.5 T. The CNR of the right hepatic vein (RHV) at 3 T was significantly lower than at 1.5 T. The image quality scores of RHV and the middle hepatic vein were higher at 1.5 T than at 3 T. For RHV visualization, the difference was statistically significant.
Conclusion
Non-contrast-enhanced MR portography with Time-SLIP at 3 T significantly improved visualization of the peripheral branch in healthy volunteers compared with1.5 T. Non-contrast-enhanced MR hepatic venography at 1.5 T was better than at 3 T.
Keywords
Introduction
Precise delineation of the portal and hepatic venous anatomy is essential when assessing patients before hepatectomy or liver transplantation (1). Contrast-enhanced angiography with computed tomography (CT) or magnetic resonance (MR) is a standard and non-invasive procedure for this purpose (2,3). However, both CT and MR contrast agents have side effects, including rare but severe reactions, such as anaphylactic shock. We have demonstrated that non-contrast-enhanced MR angiography (MRA) enables selective visualization of the portal and hepatic veins with combined usage of a respiratory-triggered three-dimensional (3D) balanced steady-state free-precession (bSSFP) and a time spatial labeling inversion pulse (Time-SLIP) at 1.5 Tesla (1.5 T) (4–6).
For upper abdominal imaging, 3 Tesla (3 T) MR scanner is available, improving signal-to-noise ratio (SNR) because SNR is roughly proportional to the field strength (7,8). However, there are many challenges resulting from B1 wavelength in homogeneity at higher field strengths. In addition, specific absorption rate (SAR) is problematic for non-contrast-enhanced MRA due to its use of radio frequency (RF) intensive sequence, such as bSSFP. Non-contrast-enhanced MRA with bSSFP is vulnerable to off-resonance effects that cause banding artifacts. However, because of higher signal intensities and better vessel-to-liver parenchyma contrast owing to increased SNR and prolonged T1 times of the liver than at 1.5 T, non-contrast-enhanced MR portography and hepatic venography at 3 T are expected to show improvement in imaging quality (9,10). Although a 3 T MR scanner is now widely used, and is promising for upper abdominal MRA, to our knowledge, no reports have focused on the image quality of non-contrast-enhanced MR portography and hepatic venography at 3 T. Therefore, the purpose of this study was to compare and evaluate images of non-contrast-enhanced MR portography and hepatic venography with Time-SLIP at 1.5 T and 3 T.
Material and Methods
Subjects
This study was conducted in accordance with the ethical standards of World Medical Association (Declaration of Helsinki). From July 2012 to May 2013, 25 healthy adult subjects (18 men, 7 women; average age, 36 years; age range, 25–57 years) were included in this study. Institutional Review Board approval for this study and written informed consent from all subjects were obtained before the magnetic resonance imaging (MRI) examinations. All subjects were instructed not to eat 3 h before the scan.
MRI protocol
All examinations were conducted with the subject in the supine position using a 1.5 T MR unit (EXCELART Vantage powered by Atlas, Toshiba Medical Systems, Otawara, Japan) and a 3 T MR unit (Vantage Titan 3 T, Toshiba Medical Systems, Otawara, Japan) were used. At 1.5 T, a six-array receive phased array body/spine coil was used to obtain the images. At 3 T, a pair of phased array coil units placed at both the front and back, resulting in 16 channel outputs, was used.
Scan parameters of bSSFP.

Application of Time-SLIP
At 3 T, longer TI of inversion recovery pulse was applied than at 1.5 T, to obtain images with an optimal balance of vessel-to-liver contrast. For MR portography, a non-selective inversion recovery pulse and a selective inversion recovery (tagging) pulse were used (Fig. 1a). Non-selective inversion recovery pulse inverts all magnetization in the region. The TI was 1213 ms at 1.5 T and 1513 ms at 3 T. The tagging pulse avoided the hepatic parenchyma and was placed on the extrahepatic portal vein, splenic vein, and superior mesenteric vein trunk as much as possible. The tagging pulse was applied to an 80 mm thick slab. The TI was 1200 ms at 1.5 T and 1500 ms at 3 T.
Placement of inversion pulses (Time-SLIP) for selective visualization of the hepatic portal venous system (A) and the hepatic venous system (B) on the scout image. (a) The non-selective pulse inverted all magnetization in the region (A) and one tagged region was placed on the extrahepatic portal vein, splenic vein, and superior mesenteric vein trunk (B). (b) One tagged region was placed in the thorax to cover the heart and thoracic descending aorta to suppress the signal in the abdominal aorta and the hepatic artery (C). The other was placed beneath the liver parallel to the line between the bottom edge of the right lobe and the tip of the lateral segment to cover a certain area of the splenic and superior mesenteric veins and suppress their inflowing blood signals to the liver (D).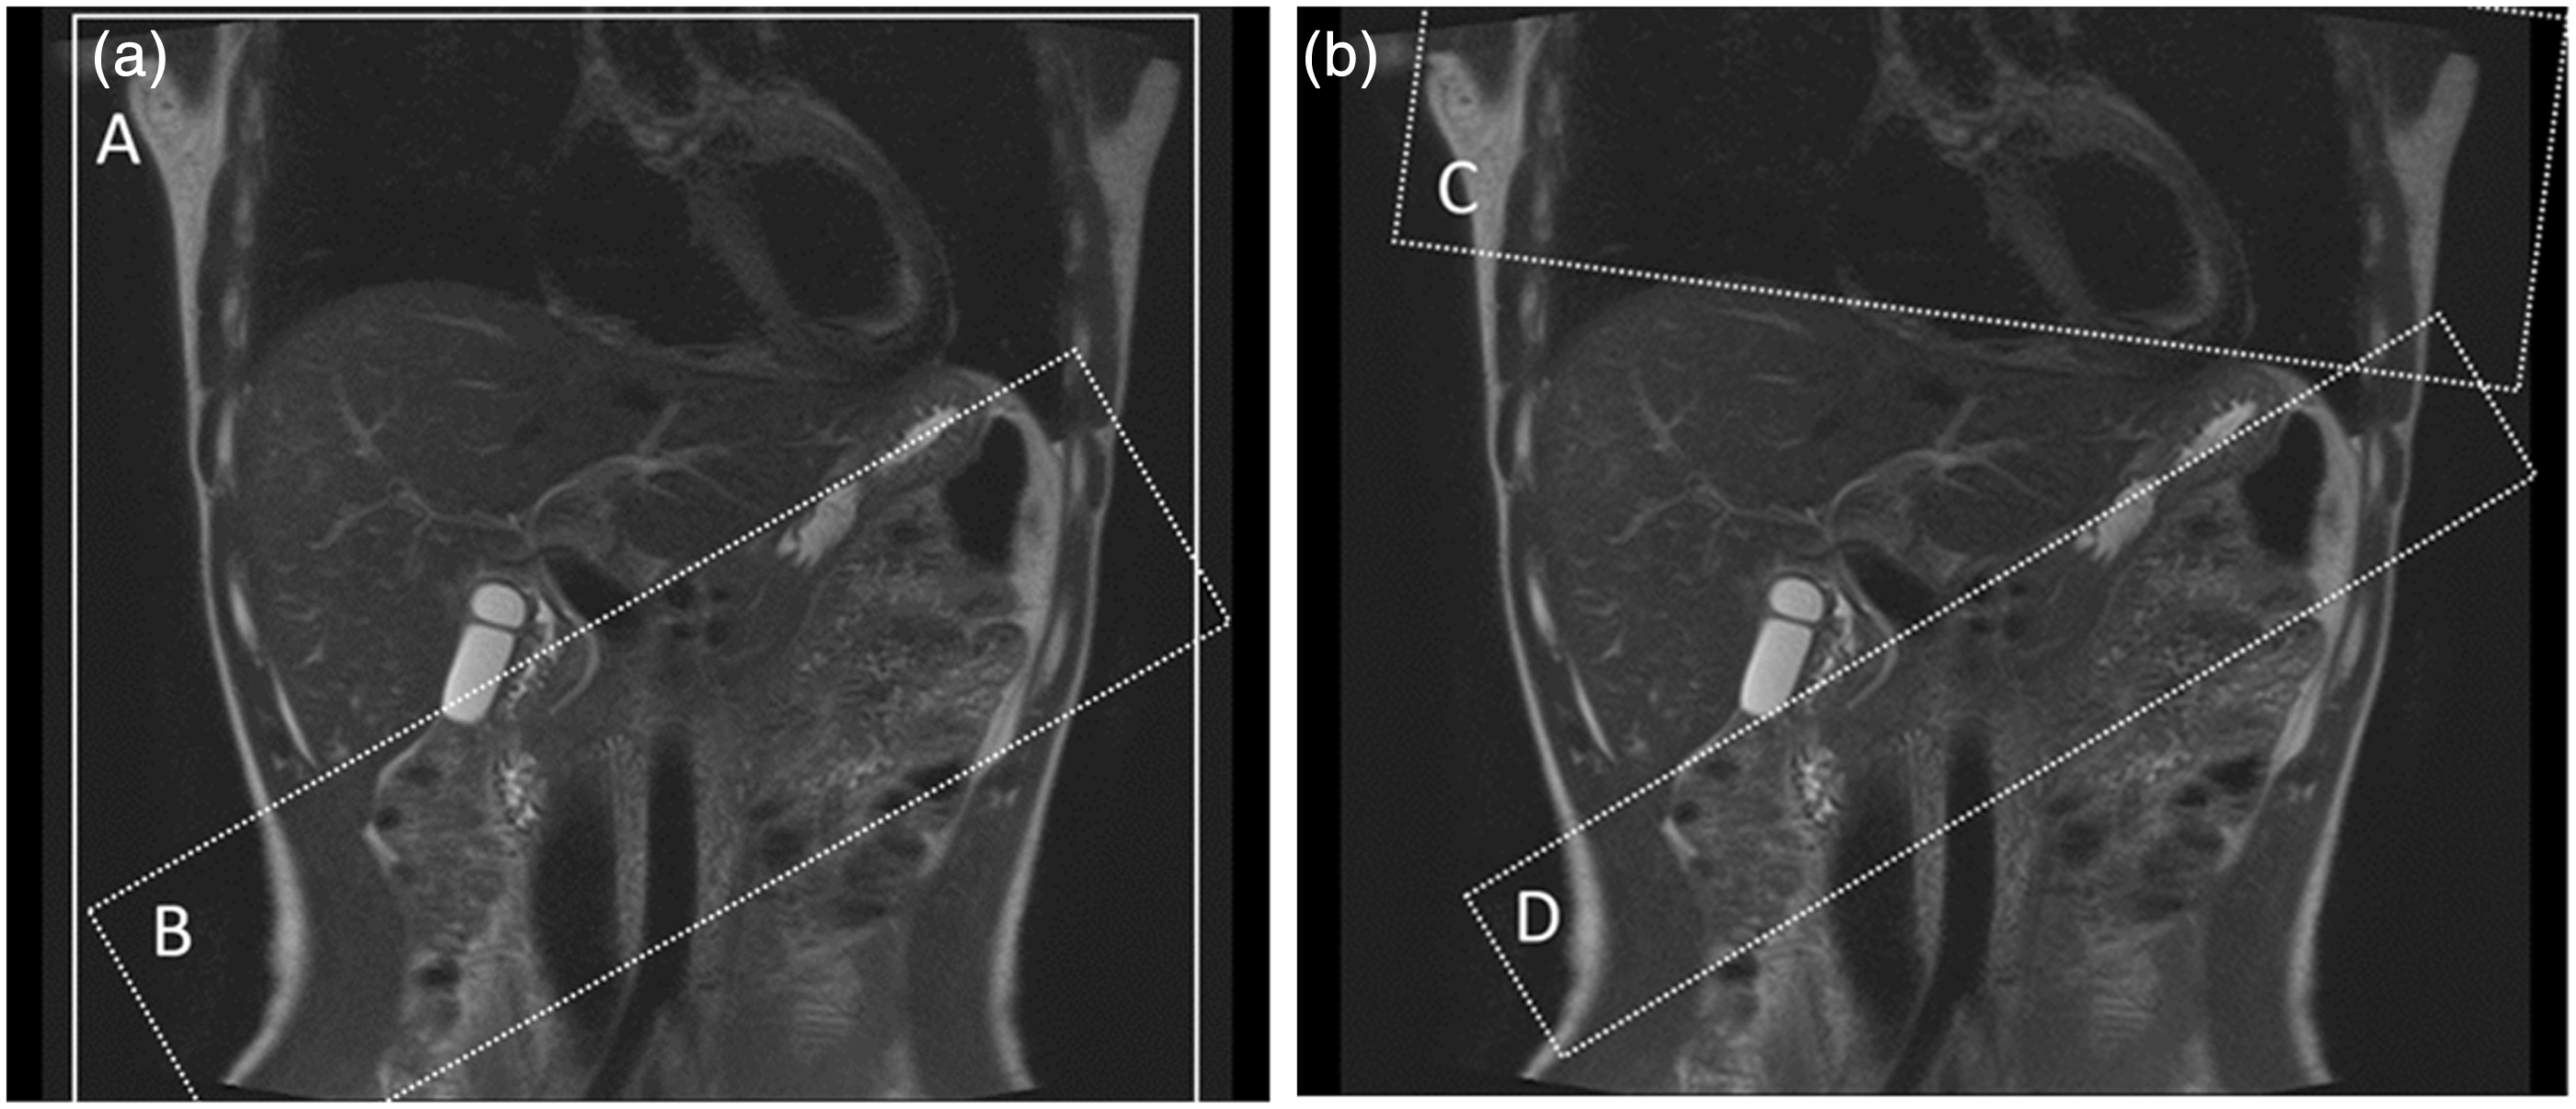
For hepatic venography, two selective tagging pulses were used (Fig. 1b). One was placed in the thorax to cover the heart and thoracic descending aorta, to suppress the signal from the abdominal aorta and the hepatic artery. The tagging pulse was applied to a 150 mm thick slab. The TI of this pulse was 1000 ms at 1.5 T and 1100 ms at 3 T, because it was near the null point of the arterial blood. The other tagging pulse was placed beneath the liver, parallel to the line between the bottom edge of the right lobe and the tip of the lateral segment, to cover a certain area of the splenic and superior mesenteric veins and suppress their inflowing blood signals to the liver. The tagging pulse was applied to a 50 mm thick slab. The TI of this pulse was 1200 ms at 1.5 T and 1500 ms at 3 T.
Image analysis
All quantitative and qualitative assessments of the image quality were performed at a commercially available workstation (Virtual Place Fujin-Raijin, Aze, Tokyo, Japan). Maximum intensity projection (MIP) reconstructions were used in addition to the source images. Quantitative analysis was conducted by a radiologist (TO, with 8 years of experience), and qualitative analysis was performed by two radiologists (HI, with 24 years of experience, and AF, with 12 years of experience).
Quantitative analysis
On the coronal source images of MR portography, regions of interest (ROIs) were placed manually in the main portal vein (MPV), right portal vein (RPV), and left portal vein (LPV), and drawn as large as possible (19–176 mm2). The ROIs in the MPV were placed near the confluence of the superior mesenteric and splenic veins. The ROIs in the RPV were placed near the bifurcation of anterior and posterior segment branches. The ROIs in the LPV were placed in the umbilical portion. The ROIs in the liver parenchyma were at least 40 mm2 and located in a homogenous portion of the liver devoid of vessels and prominent artifacts and close to the portal vein.
On the coronal source images of MR hepatic venography, ROIs were placed in the right, middle, and left hepatic veins (RHV, MHV, and LHV, respectively), 1 cm proximal to the IVC, and drawn as large as possible (15–162 mm2). The ROIs in the liver parenchyma were at least 20 mm2 and located in a homogenous portion of the liver devoid of vessels and prominent artifacts and close to the hepatic vein.
The ROIs were drawn three times at each position, and the mean signal intensity (SI) values were adopted. Because the standard deviation (SD) of the background noise could not be used to calculate the image SNR due to the use of the parallel imaging technique, we calculated SD of signal values in the ROI at the liver parenchyma as the noise (SDnoise) (7). The relative SNR and contrast-to-noise ratio (CNR) were calculated with the following formula: SNRvessel = SIvessel/SDnoise and CNRvessel-liver = (SIvessel - SIliver)/SDnoise. The parameters SIliver and SIvessel are the mean signal intensity of ROIs in the liver parenchyma and vessels (MPV, RPV, LPV, RHV, MHV, and LHV).
Qualitative analysis
The visualization quality was scored on a four-point scale (1, not visible or non-diagnostic image quality; 2, poor image quality without sufficient visualization; 3, good image quality sufficient for diagnosis; and 4, excellent image quality with sharply defined vessels) for assessment of MPV, RPV, LPV, RHV, MHV, LHV, and portal branches of segment 4, 5, and 8 (P4, P5, and P8, respectively). The depiction of the maximum branches of P5 was also scored on a four-point scale (1, only P5 was visible; 2, P5 with the first grade branches was visible; 3, P5 with the first and second grade branches was visible; and 4, P5 with the first, second, and third grade branches was visible). In addition, the evaluators were asked to score the overall image quality based on the degree of whole vessel visualization, motion artifacts, and signal suppression of the background using a four-point scale (1, poor vessel visualization with severe motion artifacts, insufficient background signal suppression, or both; 2, insufficient vessel visualization with motion artifacts, residual background signal, or both; 3, sufficient vessel visualization despite motion artifacts or residual background signal; and 4, good vessel visualization with little or no motion artifacts and good background signal suppression). Any discrepancy was resolved by discussion.
Statistical analysis
Statistical analyses were performed using the MedCalc Statistical Software (version 12.4.0.0, MedCalc Software, Ostend, Belgium). The relative SNR and CNR were compared using a paired t-test. The qualitative results of two different magnetic field groups were compared using a Wilcoxon signed-rank test. A P value of <0.05 was considered to indicate a significant difference.
Results
MR portography
The means and SDs of SNR and CNR are shown in Table 2. Non-contrast-enhanced MR portography at 3 T showed higher CNR values than at 1.5 T. Statistically significant difference was seen in the CNR of RPV. The SNR of MPV also significantly increased at 3 T, compared with SNR at 1.5 T. The scores for visualization quality and overall image quality are shown in Table 3. A summary of image quality data revealed greater image quality, in general, on non-contrast-enhanced MR portography at 3 T compared with images at 1.5 T (Fig. 2). At 3 T, the visualization quality scores of P4, P5, and P8 were significantly higher than images obtained at 1.5 T. Non-contrast-enhanced MR portography at 3 T was also significantly superior in the depiction of P5 maximum branches and overall image quality than at 1.5 T.
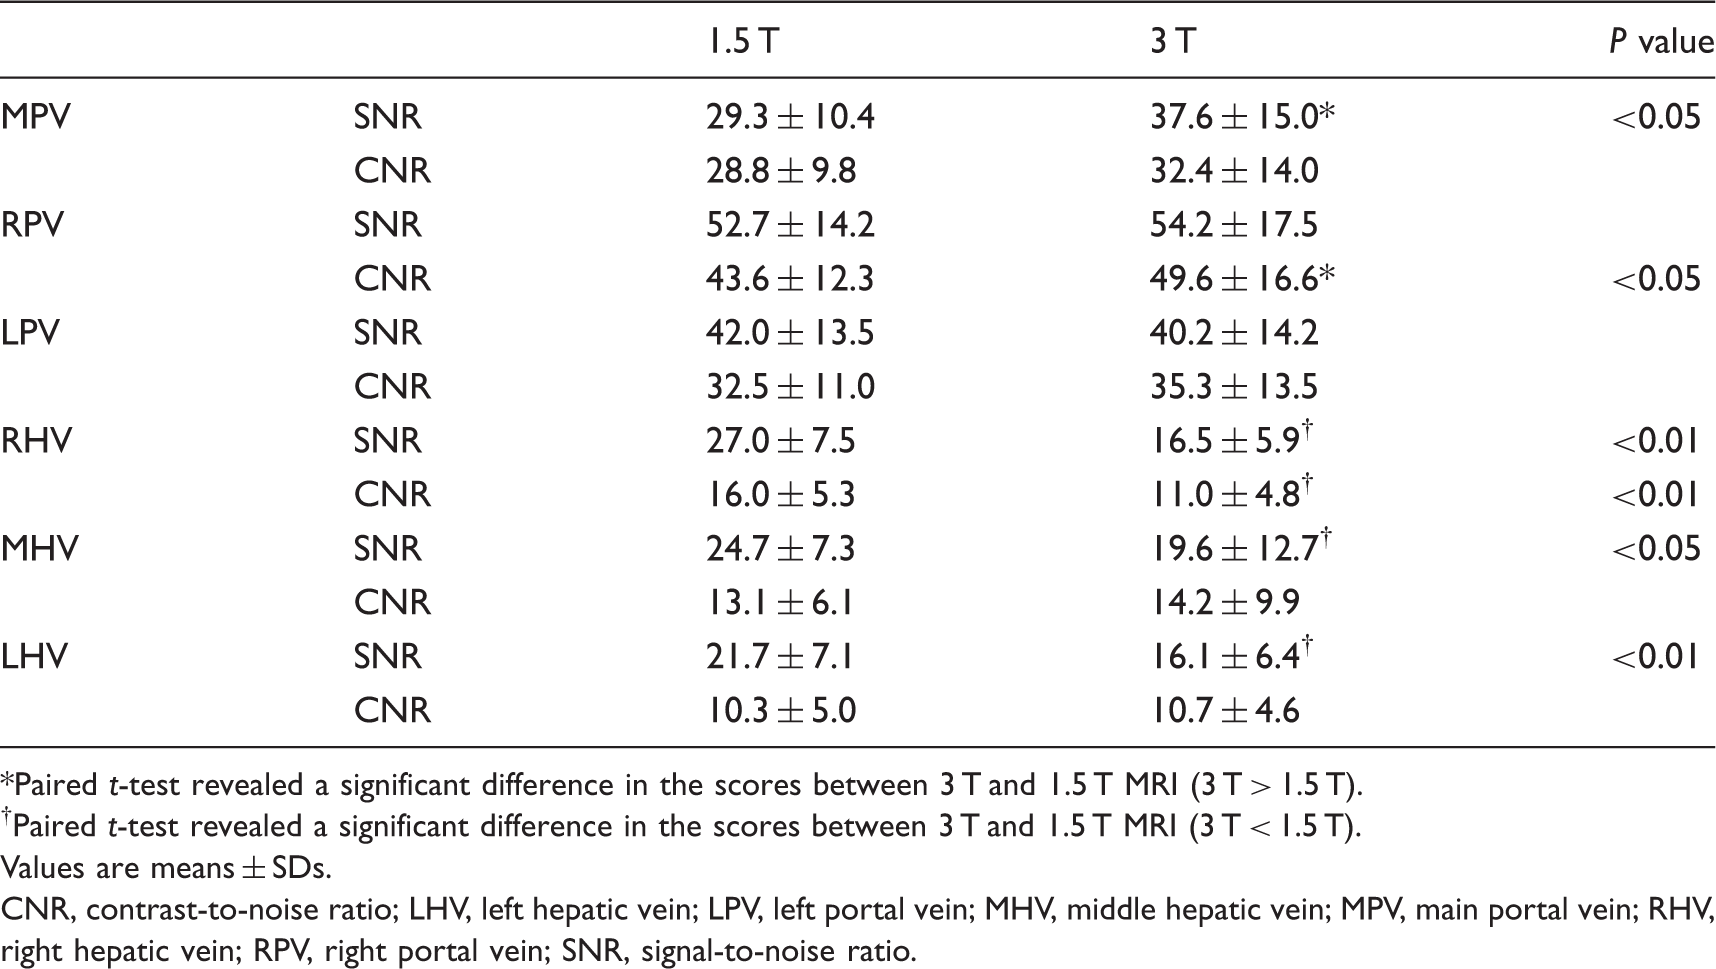
Non-contrast-enhanced MR portography with Time-SLIP at 1.5 T (a) and 3 T (b). (a, b) MIP images of a 34-year-old subject. The visualization of portal venous system was superior at 3 T (b) than at 1.5 T (a). Quantitative results of MR portography and MR venography. Paired t-test revealed a significant difference in the scores between 3 T and 1.5 T MRI (3 T > 1.5 T). Paired t-test revealed a significant difference in the scores between 3 T and 1.5 T MRI (3 T < 1.5 T). Values are means ± SDs. CNR, contrast-to-noise ratio; LHV, left hepatic vein; LPV, left portal vein; MHV, middle hepatic vein; MPV, main portal vein; RHV, right hepatic vein; RPV, right portal vein; SNR, signal-to-noise ratio. Qualitative results of MR portography. Wilcoxon signed-rank test revealed a significant difference in the scores between 3 T and 1.5 T MRI (3 T > 1.5 T). LPV, left portal vein; MPV, main portal vein; P4, portal branch of segment 4; P5, portal branch of segment 5; P8, portal branch of segment 8; RPV, right portal vein.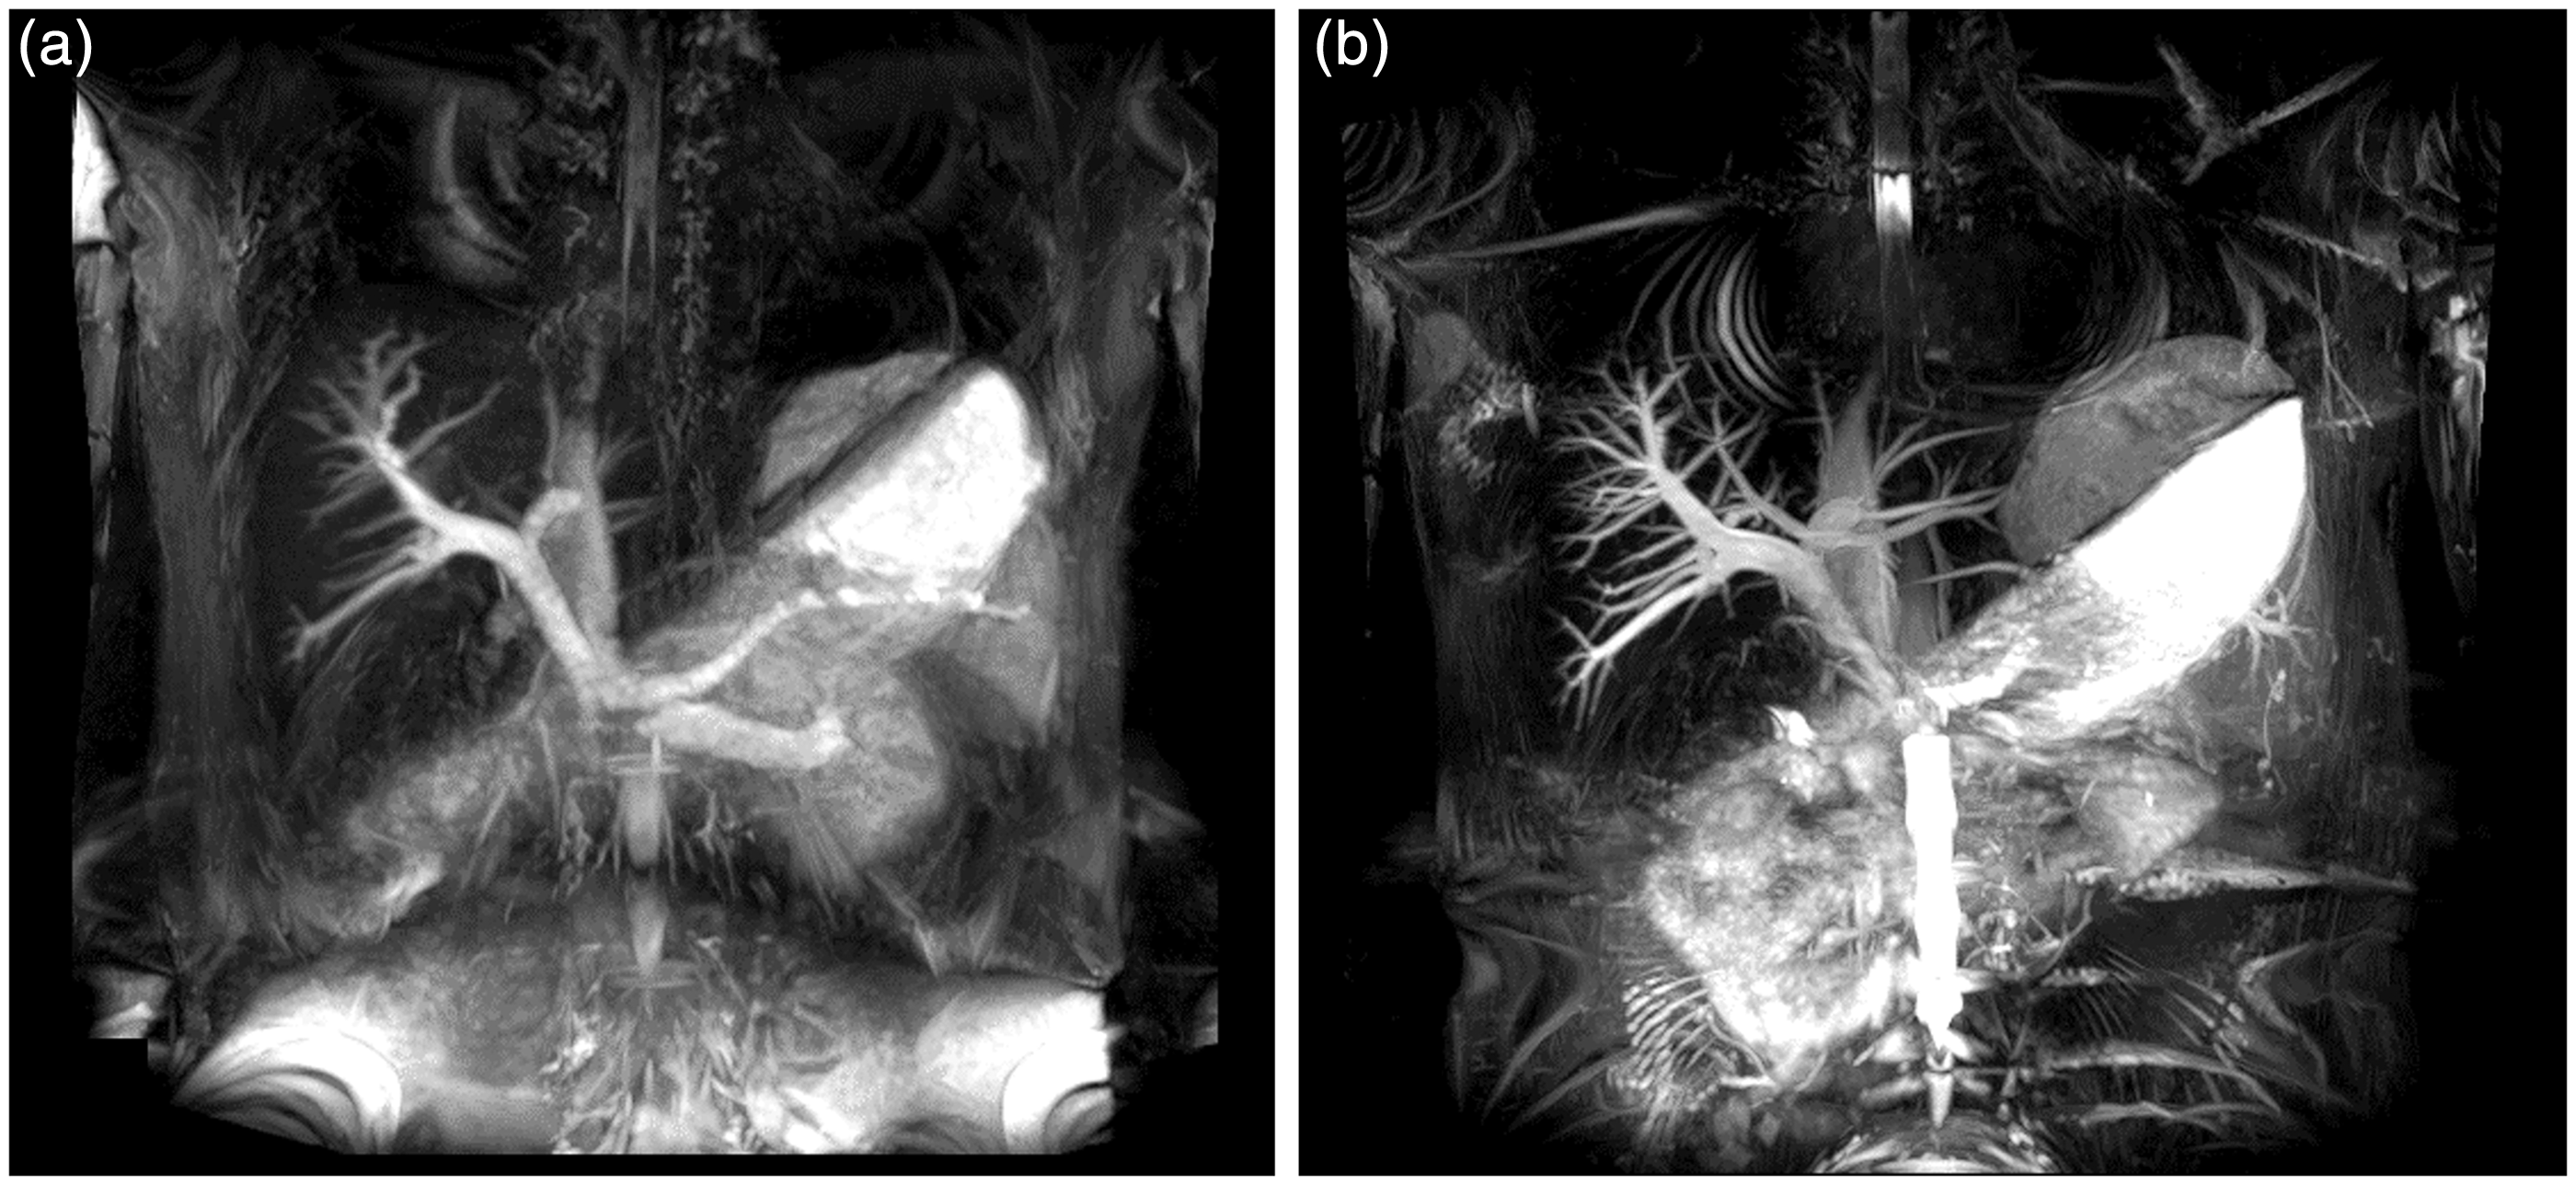

MR hepatic venography
The means and SDs of SNR and CNR are shown in Table 2.
The SNRs of RHV, MHV, and LHV at 3 T were significantly decreased compared with SNRs at 1.5 T. Furthermore, when comparing non-contrast-enhanced MR hepatic venography at 1.5 T, images at 3 T were significantly inferior in CNR of RHV. The scores for visualization quality and overall image quality are summarized in Table 4. For 3 T, we found a trend toward inferior visualization of hepatic veins. Significant difference was present in the visualization of RHV. Additionally, the non-contrast-enhanced MR hepatic venography at 3 T was inferior in overall image quality compared with 1.5 T (Fig. 3).
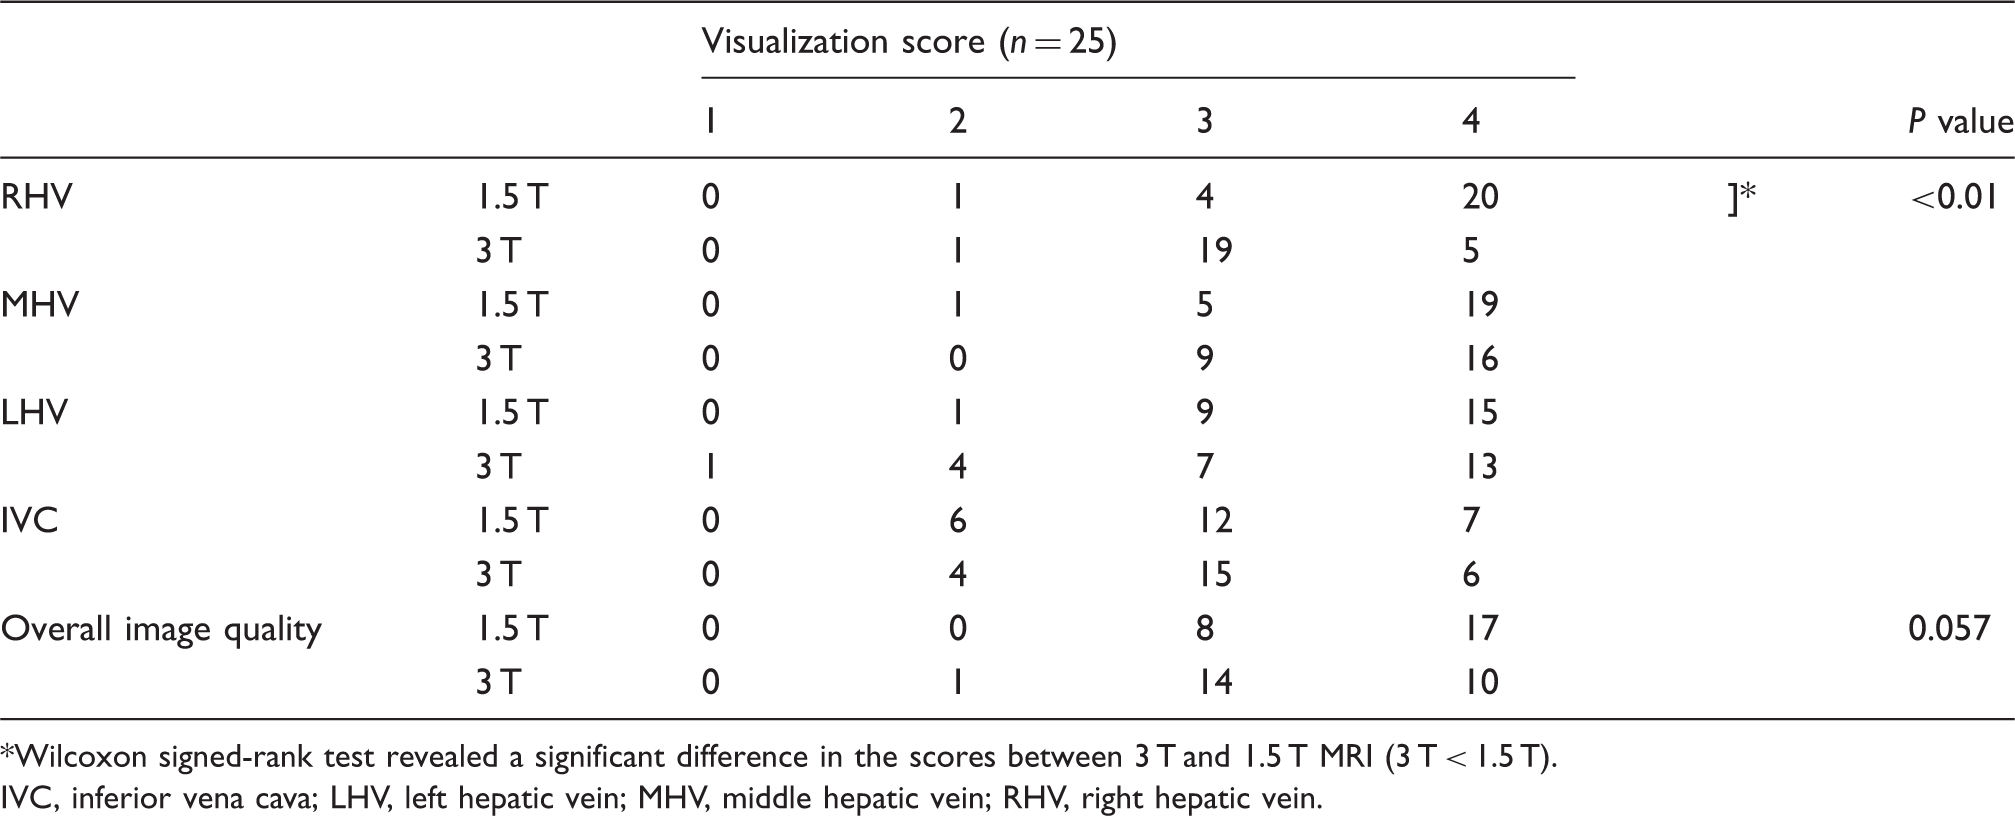
Non-contrast-enhanced MR venography with Time-SLIP at 1.5 T (a) and 3 T (b). (a, b) MIP images of a 33-year-old subject. There was no apparent banding artifact on RHV at 1.5 T (c). Meanwhile, the confluence with inferior vena cava and about one-third proximal of RHV were not visualized at 3 T due to banding artifact (d). Qualitative results of MR venography. Wilcoxon signed-rank test revealed a significant difference in the scores between 3 T and 1.5 T MRI (3 T < 1.5 T). IVC, inferior vena cava; LHV, left hepatic vein; MHV, middle hepatic vein; RHV, right hepatic vein.
Discussion
There are some challenges and advantages for non-contrast-enhanced MRA with bSSFP sequence at 3 T. Sequences, such as bSSFP, with rapidly repeated high flip angles, require adjustment to stay in a safe SAR at 3 T (11). Reducing the flip angle affects image contrast in non-contrast-enhanced MRA with bSSFP. It is also problematic to see various artifacts, including banding (off-resonance) artifacts, in the bSSFP images at 3 T. On the other hand, for non-contrast-enhanced MRA at 3 T, an increased SNR yields improved vessel contrast at high spatial resolution, and the longer T1 relaxation times of background tissues further increased the contrast by improving background suppression. Tagging pulse with longer TI at 3 T also increased the bright signal flow to be visualized on non-contrast-enhanced MR portography and hepatic venography with Time-SLIP.
Regarding MR portography, the most significant finding in our study was the excellent visualization of smaller peripheral vessels at 3 T. We found a significantly superior visualization of P4, P5, and P8 at 3 T. The improved visualization of peripheral segments of the portal vein may be the consequence of higher signal intensities and better vessel-to-liver parenchyma contrast at 3 T owing to increased SNR and prolonged T1 times of the liver (12,13). The improvement of visualization can also be ascribed to the increase in the bright signal flow to visualize the peripheral portal branches using a selective tagging pulse with longer TI at 3 T than at 1.5 T, which allows portal flow to reach more peripheral areas. The SNRs of MPV and RPV, and the CNRs of MPV, RPV, and LPV were better at 3 T than at 1.5 T due to the combination of higher field strength and longer background T1. The SNR of LPV was slightly inferior at 3 T than at 1.5 T, but the difference was not statistically significant. Because LPV is located below the heart and lung, the inferiority at 3 T may be ascribed to various artifacts, such as B1 inhomogeneity, motion artifacts, and banding artifacts, that were increased at 3 T compared with 1.5 T (14).
Regarding MR venography, the CNR of RHV and SNRs of RHV, MHV, and LHV at 3 T were significantly inferior compared with those at 1.5 T. In visual analysis, we found a significantly inferior visualization of RHV at 3 T, so overall inferior image quality was seen on images obtained at 3 T. Theoretically, SNR is superior at higher field strength. However, the SNRs of RHV, MHV and LHV at 3 T were inferior to those at 1.5 T in our study. Because RHV, MHV and LHV are located just under the diaphragm and heart, this result may be ascribed to increased artifacts at 3 T compared with at 1.5 T (14). Furthermore, RHVs were partially or almost completely not visible at 3 T in some volunteers because of banding artifacts. At 1.5 T, there was no apparent banding artifact on RHV (Fig. 3). Because the off resonances from susceptibilities are proportional to the field strength, the bSSFP images at 3 T are the same as the images at 1.5 T at twice the TR regarding banding artifacts (11). Thus, banding artifacts are more severe at 3 T than at 1.5 T. We consider that this may have resulted in the inferior CNR and visualization score of RHV. To avoid banding artifacts, we intended to reduce the field inhomogeneity over the liver by using higher order local shimming procedures that were reported to be efficient in 3 T cardiac SSFP imaging (15). However, we could not remove these artifacts on the liver in our study. For planning surgical procedures for liver resection and transplantation, it is important to evaluate the anatomy of hepatic venous system, such as size, number, and distance from caval insertion of accessory inferior hepatic veins to the RHV-caval confluence, in order to prevent hepatic congestion due to venous outflow blockage. Our study suggested non-contrast-enhanced MR venography at 3 T might not be appropriate for a preoperative study at this rate. It was also reported that adjusting F0 changes the location of the on-resonance and off-resonance artifacts (15). Thus, shifting F0 may move the banding artifacts and make the RHV-caval confluence visible at 3 T.
Our study had several limitations. The main limitation of our study is the lack of a reference standard to compare the results of our qualitative analysis. Ideally, a comparative study with contrast-enhanced CT or surgical exploration would have provided definite results of the hepatic venous anatomy in each subject. However, even contrast-enhanced CT or MRI seems to be excessive in a volunteer study and would not be approved by our institutional review board for human investigation. This study aimed at the comparison of images from the same subjects using MR with different magnetization field strength. Therefore, the absence of a reference standard may not constitute a significant issue, so the consensual interpretation was performed by abdominal radiologists. Another limitation is that, though we intended to use identical scan parameters at 1.5 T and 3 T, a lower flip angle was applied at 3 T due to SAR restrictions. Numerical simulations with bSSFP MRA of the coronary arteries have shown a decrease in vessel signal intensity with smaller flip angles (14). We cannot exclude the possibility that our results were influenced by the difference in flip angles. Further studies need to be carried out for the optimization of sequences. Our data provided the needed starting point to design MR imaging protocols at 3 T. Furthermore, only healthy adult subjects were examined. The proposed method for MR portography depends on the portal inflow signal, but the flow is reduced or even reversed in some patients with portal hypertension (16). Clinical utility of 3 T in evaluating pathological states need to be examined in a patient study.
In conclusion, non-contrast-enhanced MR portography with Time-SLIP at 3 T has a potential to improve visualization of the peripheral branch compared with 1.5 T. On the other hand, non-contrast-enhanced MR hepatic venography with Time-SLIP at 1.5 T provided better visualization than at 3 T. Further studies, such as using F0 adjusting technique, are required to obtain sufficient image quality on non-contrast-enhanced MR hepatic venography taken at 3 T.
Footnotes
Acknowledgements
This study was conducted as a part of the project, “R & D of Molecular Imaging Equipment for Malignant Tumor Therapy Support”, supported by NEDO (New Energy and Industrial Technology Development Organization), Japan. The authors thank Mr. Hiroshi Kusahara, Ms. Ayako Ninomiya (Toshiba Medical Systems Corporation) and Kyoko Takakura, RT (Kyoto University Graduate School of Medicine) for their excellent technical assistance and advice on sequence optimization and all volunteers who were willing to participate in our study.
Conflict of interest
This study was supported by a sponsored research program, “Researches for improvement of MR visualization (No. 150100700014)” provided to one of the authors, Professor Kaori Togashi, by Toshiba Medical Systems Incorporated, Japan.