
Abstract
Despite an impressive rise in school enrolment rates over the past few decades, there are concerns about growing inequality of educational opportunity in China. In this article, we examine the level and trend of educational mobility in China, and compare them to the situation in Germany, the Netherlands, the UK and the USA. Educational mobility is defined as the association between parents’ and children’s educational attainment. We show that China’s economic boom has been accompanied by a large decline in relative educational mobility chances, as measured by odds ratios. To elaborate, relative rates of educational mobility in China were, by international standards, quite high for those who grew up under state socialism. For the most recent cohorts, however, educational mobility rates have dropped to levels that are comparable to those of European countries, although they are still higher than the US level.
Keywords
Introduction
One of the most important social changes in China over the past few decades has been the massive expansion of its education system (Treiman, 2013). Since the launch of the market reform in the late 1970s, educational qualifications have become increasingly important for achieving economic success. A basic nine-year education has become almost universal even in the remotest regions, and the number of higher education entrants has increased from 0.9 million in 1995 to 10.9 million in 2015 (National Bureau of Statistics of China, 2016: Table 21–7). The achievements of the Chinese school system were highlighted in 2010, when a sample of Shanghai students topped the global PISA (Programme for International Student Assessment) rankings in all three subjects of mathematics, science and reading.
Scholars have, however, noted that these success stories mask large socioeconomic gaps in educational opportunity, particularly between rural and urban areas. There are also indications that inequality in educational attainment has widened in recent years (Wu, 2010; Yeung, 2013; Zhou et al., 1998). Wang et al. (2011) attribute this to the market-oriented reforms, which have made senior high school and college virtually unaffordable for low-income families. However, these studies consider China in isolation. Thus, we do not know how China compares with other countries.
In this article, we examine educational mobility in China, Germany, the Netherlands, the UK and the USA. Educational mobility is defined as the net association between parents’ and children’s education. Our analyses contribute to the literature on educational stratification in China (e.g. Li, 2006; Wu, 2010; Yeung, 2013) by providing an international benchmark, and to the comparative literature on the trends in educational inequality (e.g. Blossfeld et al., 2016; Breen et al., 2009; Pfeffer, 2008) by adding the distinctive case of China. We start by briefly describing the key characteristics of the education systems of the five countries. We then provide descriptive statistics on educational attainment across birth cohorts, followed by an analysis of educational mobility.
Institutional features of education systems
Education systems can vary according to a number of dimensions. In this study, we focus on four of them, namely: (a) horizontal differentiation; (b) centralisation of funding and resources; (c) standardisation of curricula and tests; and (d) marketisation. Each of these dimensions has important implications for educational mobility (Pfeffer, 2008; Schütz et al., 2008; Van de Werfhorst and Mijs, 2010).
Horizontal differentiation refers to the sorting of students into different tracks (Van de Werfhorst and Mijs, 2010), typically vocational tracks, which prepare some students for working-class jobs, and more prestigious academic tracks, which that prepare other students for university. The opposite of tracking is the comprehensive education model, in which students of different abilities and interests are taught in the same schools and classrooms for as long as possible. It is generally found that horizontal differentiation reduces educational mobility, because high-status parents are in a better position to ensure that their child chooses the ‘right’ educational track (Brunello and Checchi, 2007; Pfeffer, 2008).
Education systems also differ in the degree of centralisation of funding and other school resources, such as teacher training and allocation. Greater disparities in the quality of teaching and facilities are often found in decentralised systems. As a result of parental influence, admission criteria and residential segregation, students from less advantaged backgrounds tend to be clustered in lower-quality schools, even in nominally comprehensive school systems (Triventi et al., 2016). Thus, we expect that decentralisation of funding and resources is associated with less educational mobility.
The centralisation of curricula and testing is also referred to as ‘standardisation’ (Van de Werfhorst and Mijs, 2010). The opposite of standardisation is school autonomy, in which there are no nationally enforced educational standards. Although excessive standardisation is often criticised for limiting teachers’ independence and creating a test-oriented learning culture, moderate levels of standardisation, particularly in examinations, have been shown to reduce the influence of social origin on student performance (Schütz et al., 2008; Wößmann, 2003).
Finally, marketisation describes the extent to which the cost of education is borne by parents and students in the form of tuition fees. It also refers to the existence of private schools and colleges alongside public ones. A high degree of marketisation is likely to reduce educational mobility (Schütz et al., 2008).
The Chinese education system
China’s education system is characterised by a linear sequence of educational stages. Children start primary school at age six or seven. Similar to the US system, in China, primary school, which takes six years, is followed by junior high school (three years), senior high school (three years) and junior college (three years) or university (four years). At the high school level, a distinction can be made between vocational high schools, general high schools and prestigious ‘key point’ high schools.
Historically, education policy in China was tightly controlled by the central government (Ross and Pepper, 1997; Tsang, 2000). Under state socialism (1949–1978) the emphasis was on basic education, in line with the state’s objective of levelling social inequality. Previous studies have shown that educational inequality was exceptionally low in this period (Deng and Treiman, 1997; Zhou et al., 1998).
The market transition that began in 1978 brought about a radical break in education policy. The ideological goals of the Maoist period were replaced by a system oriented towards efficiency and growth (Tsang, 2000). This involved a gradual marketisation of the education system as well as an increased emphasis on standardised tests for entry into advanced levels of education (Hannum et al., 2011). Enrolment rates have increased rapidly since the early 1980s, and basic education (primary and junior high school) is now almost universal (Treiman, 2013). A second wave of reforms in the late 1990s rapidly expanded access to higher education, which had been very limited up to that point (Yeung, 2013). The emphasis on nationwide testing and curricula has resulted in an exceptionally high degree of standardisation. However, school resources were decentralised following the educational finance reforms of the 1980s. This has led to massive and persistent regional differences in the availability and quality of education, particularly between rural and urban areas. Under the policy of household registration (hukou), rural children cannot attend urban schools, even if their parents have migrated to urban areas. It is only at the tertiary level that rural and urban students attend the same colleges, although regional quotas continue to disadvantage rural children (Wu, 2012).
The German education system
Education in Germany is largely funded by regional governments (Bundesländer). It is characterised by a strong and early differentiation between vocational and academic tracks. Compulsory education starts relatively late, at age 7. After four years (around age 11), children are sorted into three types of secondary school according to their grades. The most basic level (Hauptschule) takes five years and has a strong vocational focus. The middle level (Realschule) takes six years and provides access to advanced vocational and administrative degrees, including lower-tier tertiary degrees, at Fachhochschulen. Only the Gymnasium, which takes eight or nine years and attracts about a third of all high school students, prepares students for the university entrance qualification (Abitur).
A distinctive aspect of the German education system is its strong emphasis on vocational training. Following the Hauptschule or Realschule, most students enter the ‘dual system’ of part-time schooling combined with an apprenticeship at a workplace (Schneider, 2008b). This type of vocational training typically takes three years and leads to a specific occupational qualification. Although the dual system is considered part of (upper) secondary schooling, the German system also offers a variety of post-secondary vocational degrees. Advanced vocational training is offered at technical colleges (Fachschulen) and vocational academies (Berufsakademien). It is sometimes argued that Germany’s strong vocational tradition alleviates some of the negative effects of tracking, because it provides less academically oriented students with an alternative path to advanced qualifications and high-status jobs (Brunello and Checchi, 2007).
Finally, Germany has a dual higher education system, which distinguishes between polytechnics (Fachhochschulen) and traditional universities. Although tertiary education is (almost) free of charge, university attendance is comparatively low (see Figure 1 and Figure 2).
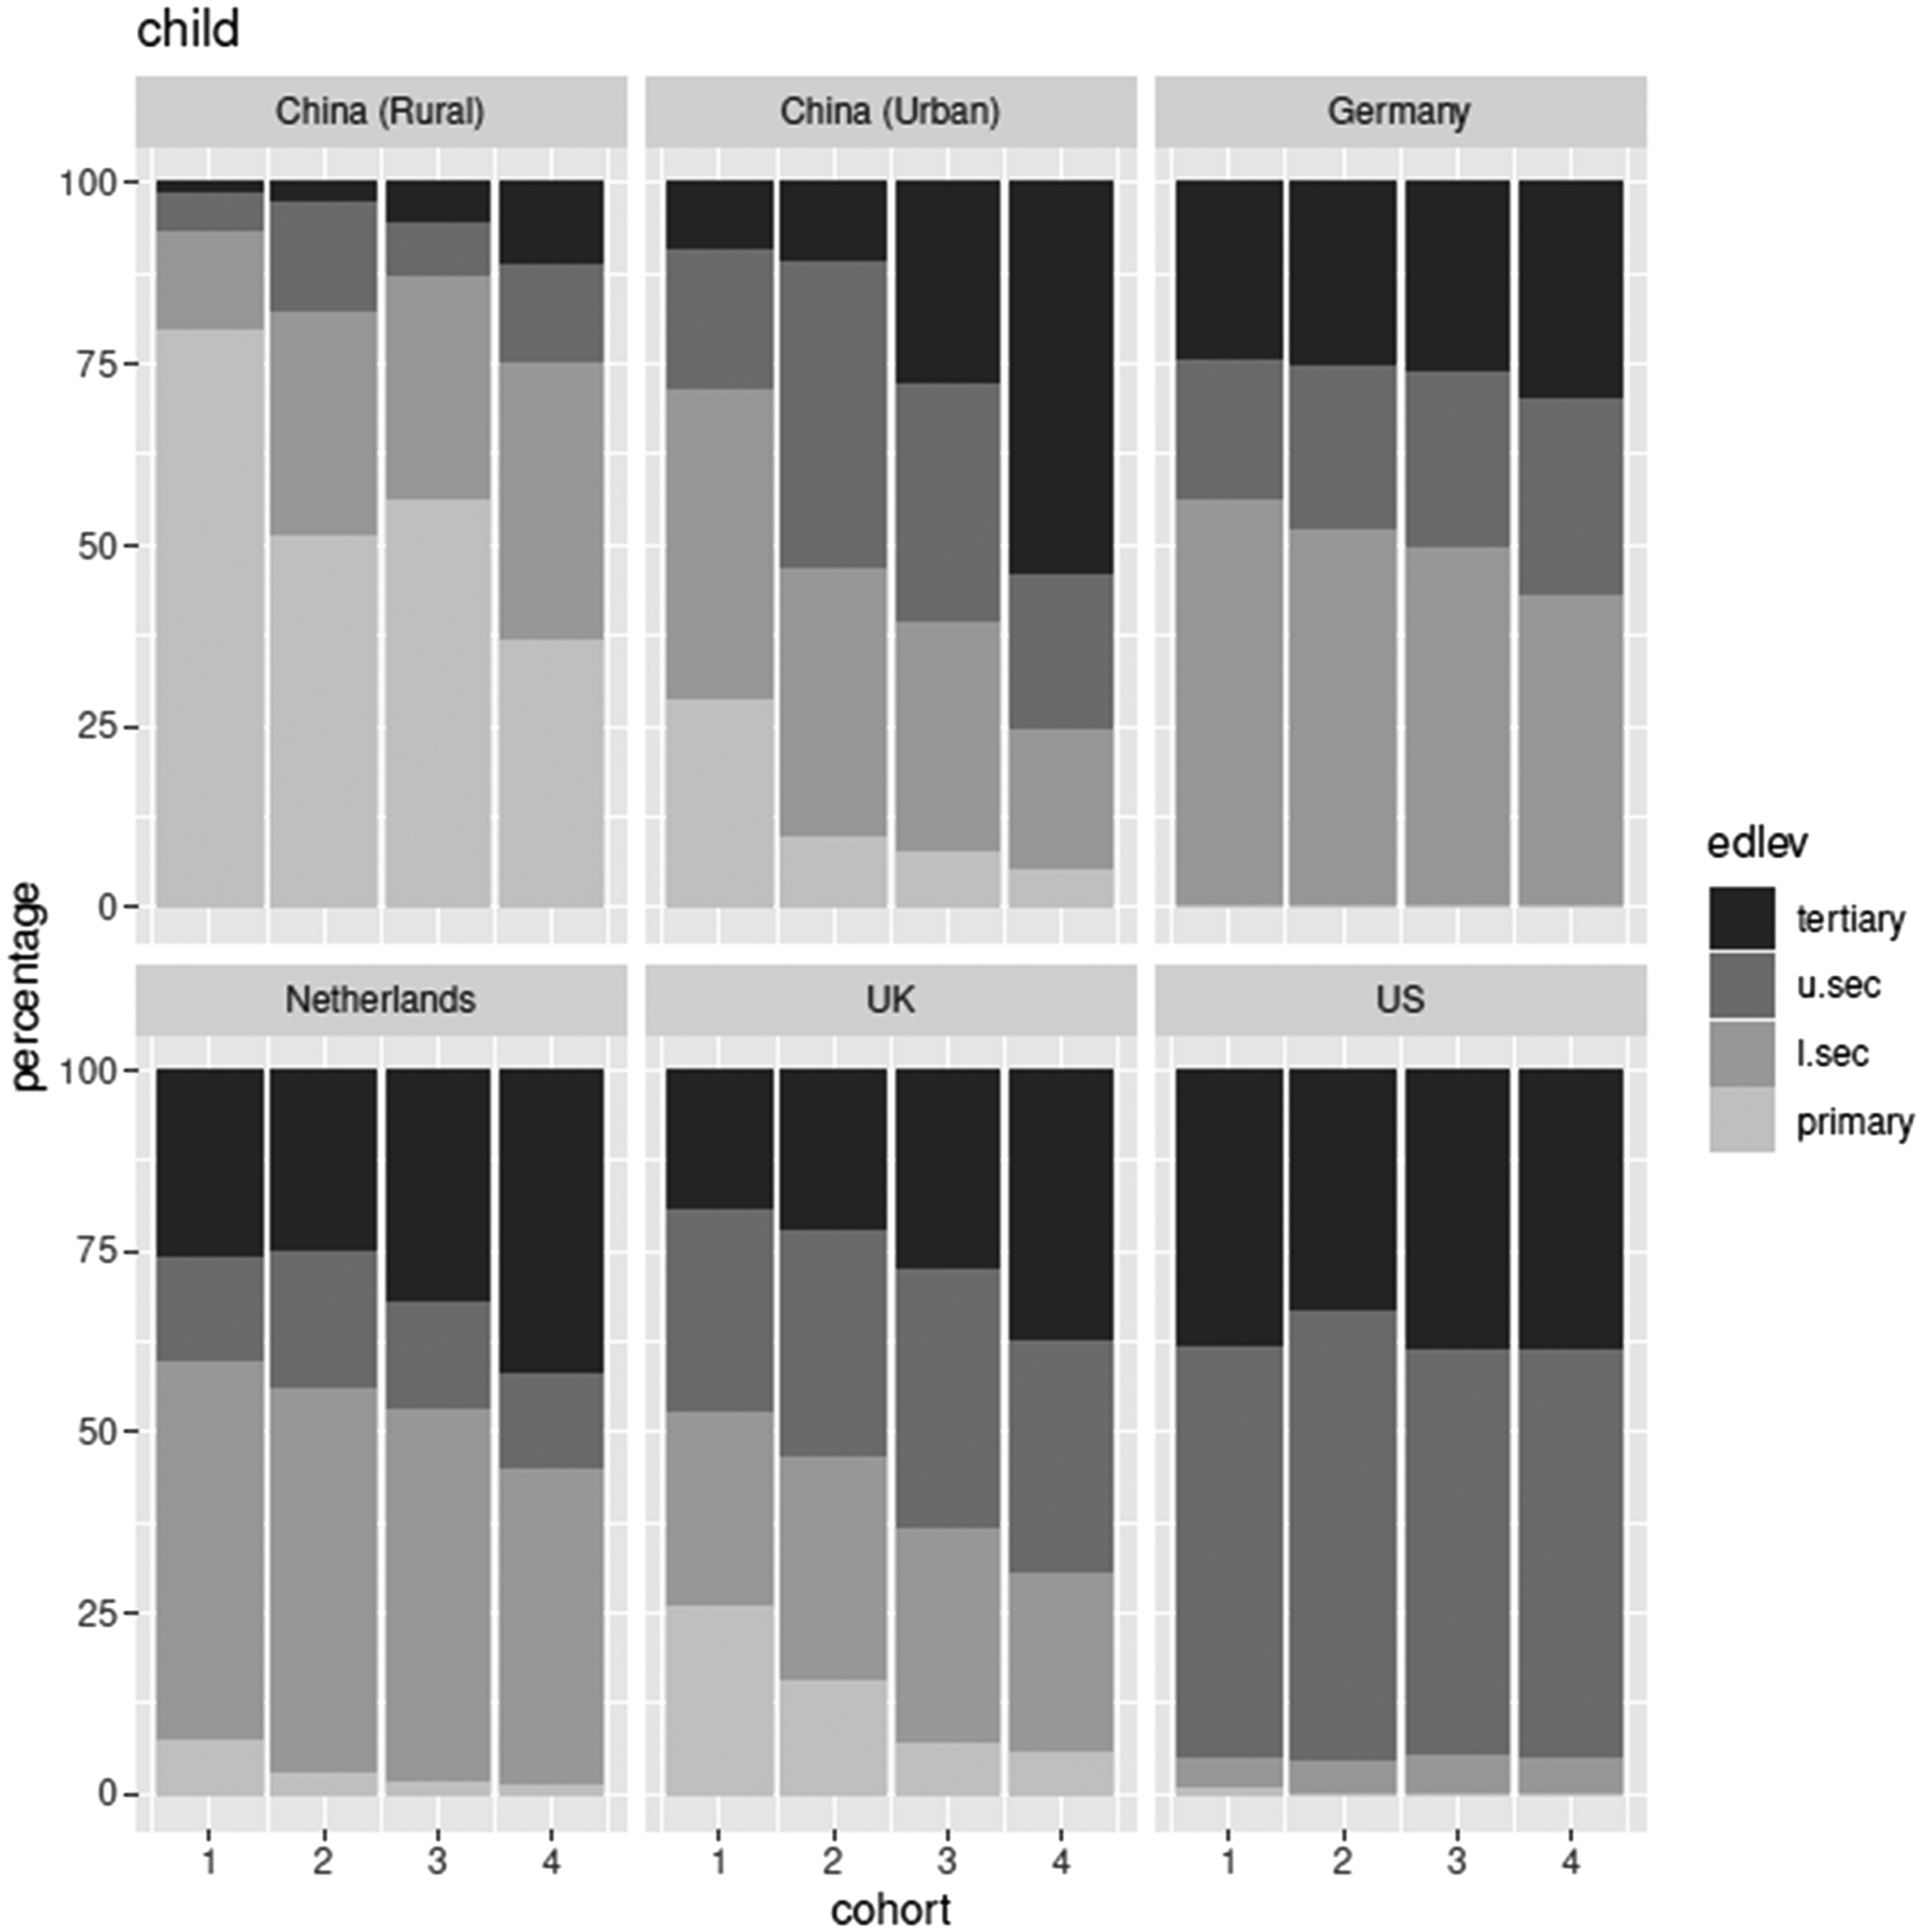
Distribution of respondents by parental education by country and cohort. Distribution of respondents by their own education by country and cohort.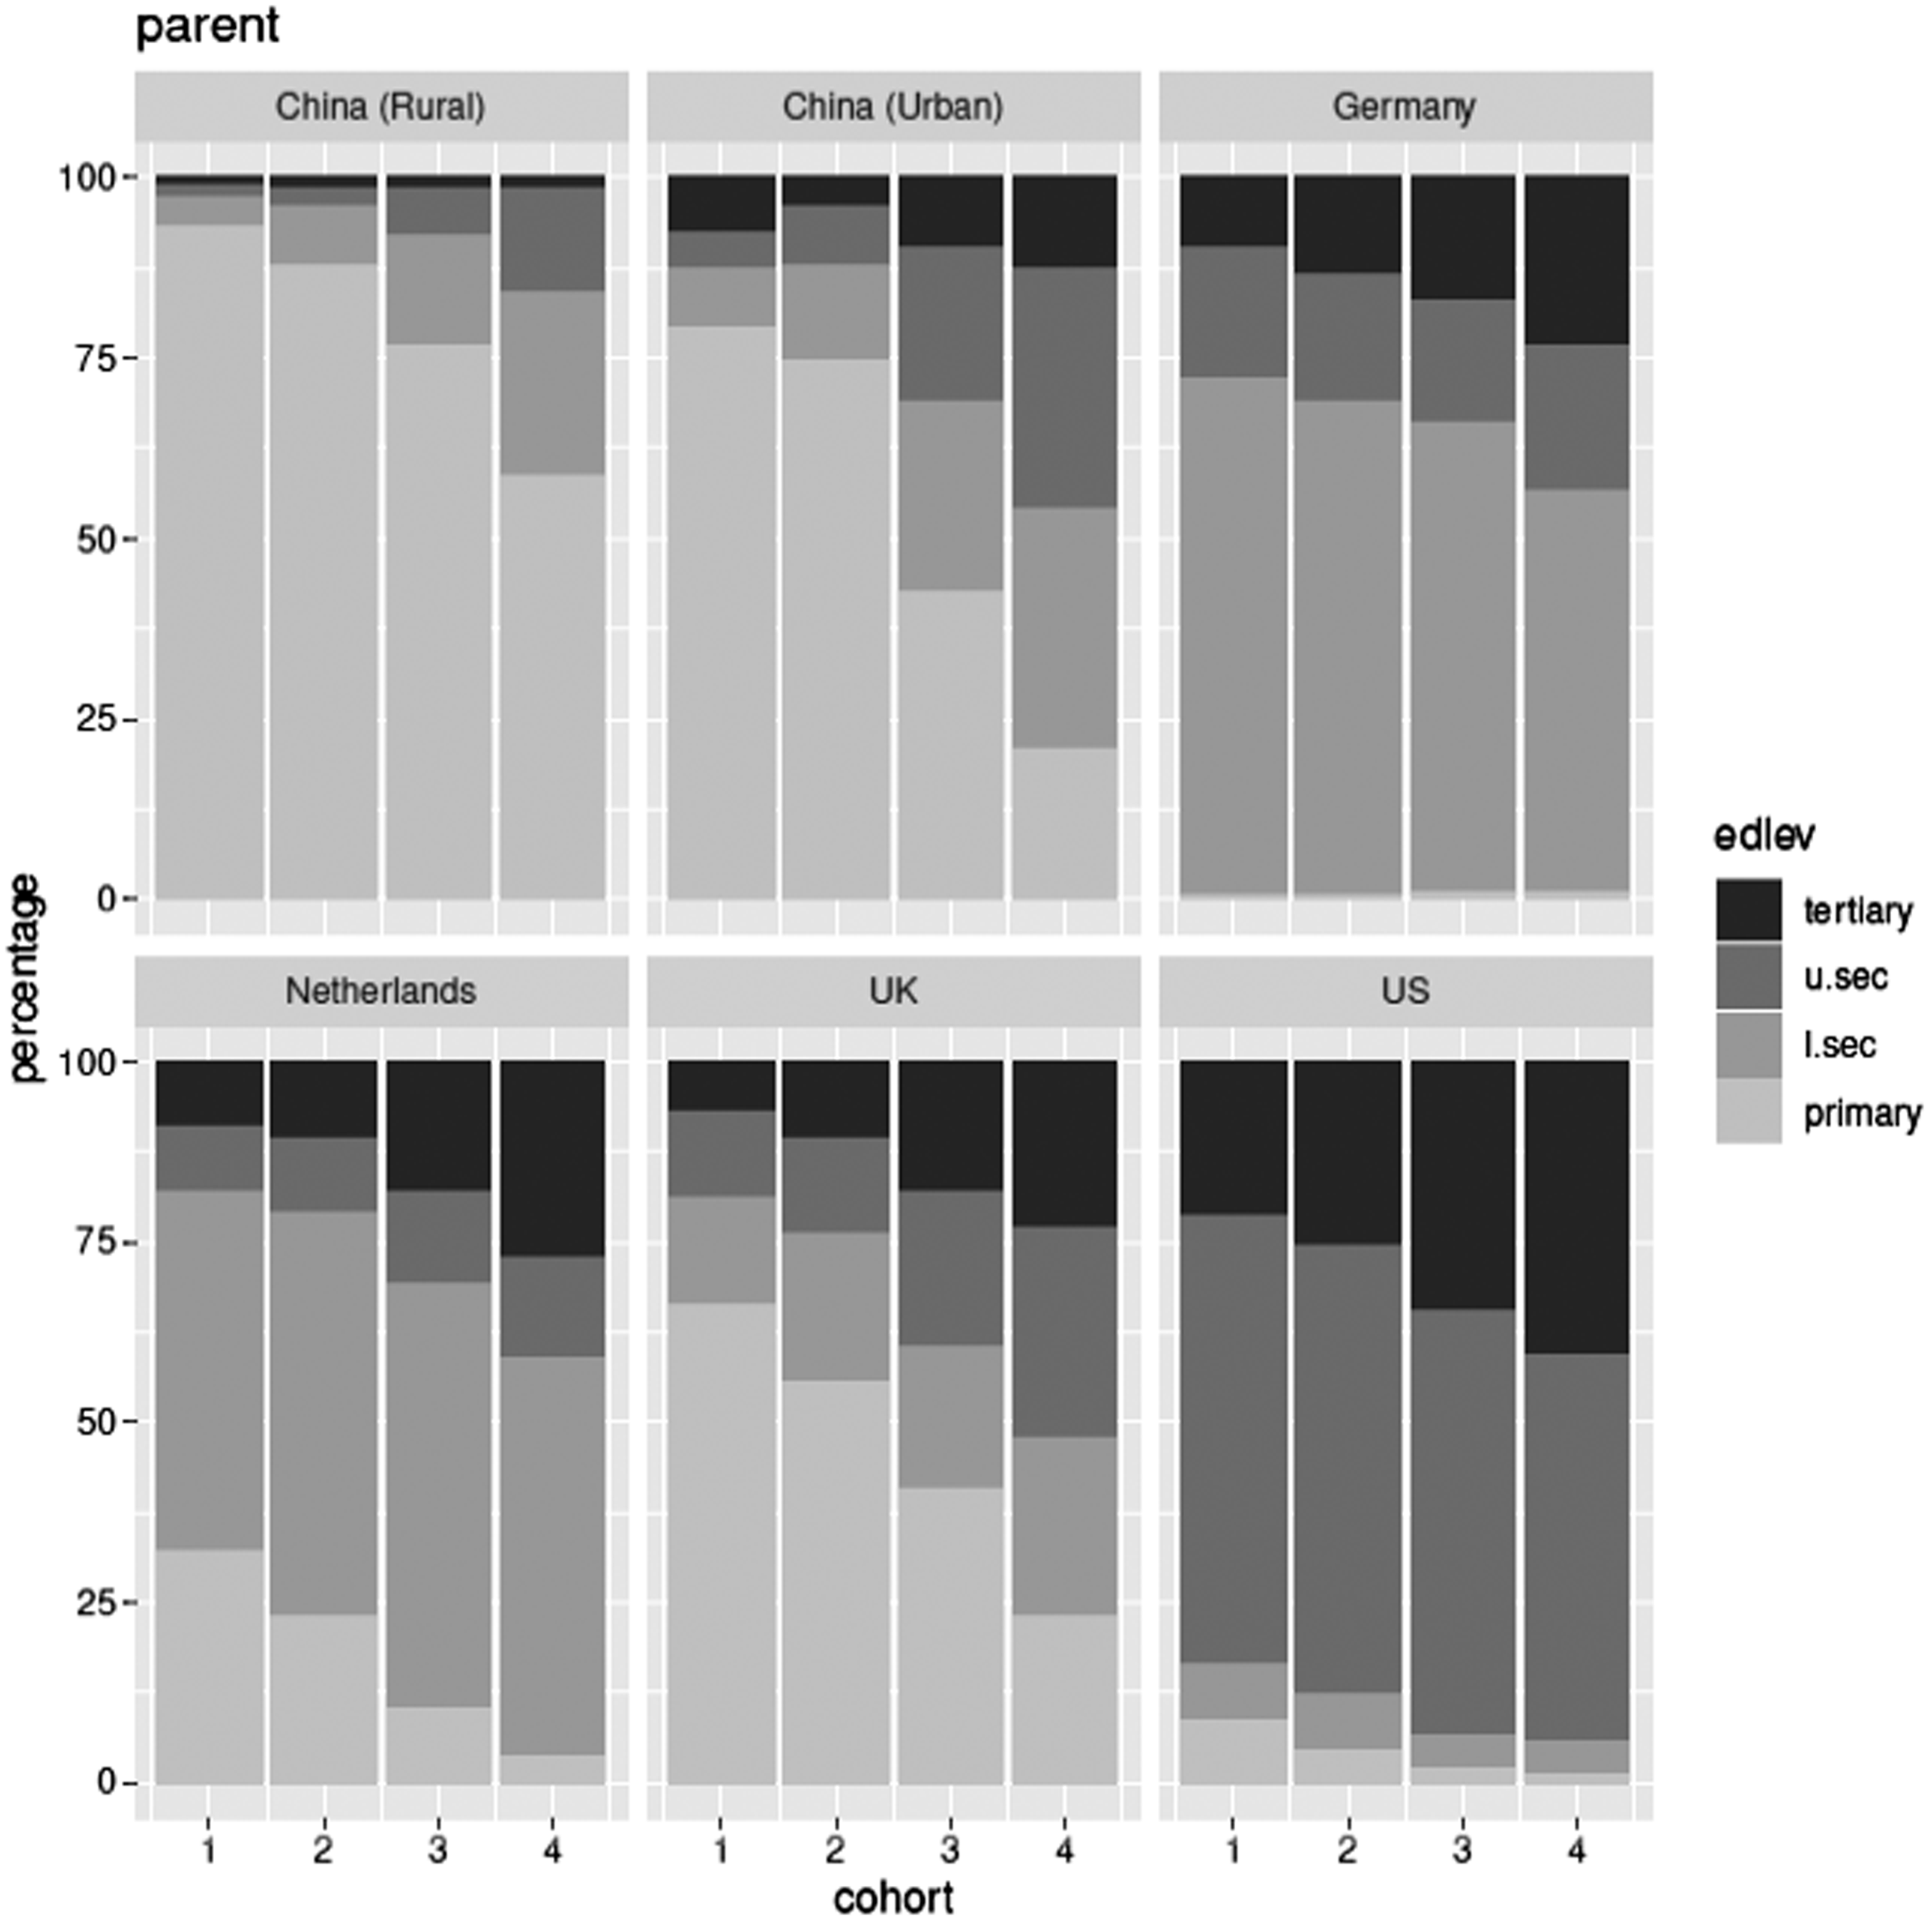
The Dutch education system
In the Netherlands, schooling is compulsory between the ages of 5 and 16. Children finish primary school at age 12, at which point they are sorted into different secondary tracks based on teacher recommendations and standardised test scores (the CITO test). Although the structure of secondary education has been reformed several times in recent decades, its basic tenets have remained the same. Over half of all students attend pre-vocational secondary education (VMBO), which is further divided into different tracks. VMBO schools provide four-year courses in four sectors (commerce, health, agriculture and technology), combined with a more general curriculum. Pre-vocational education is typically followed by a vocational degree (MBO), although some students also proceed to Grade 4 of the next level of secondary education (HAVO). HAVO takes five years and provides direct access to polytechnic colleges (HBO). The highest level of secondary education (VWO) takes six years and prepares students for university education. HAVO and VWO are normally offered by the same schools, and the first one or two years of these tracks are typically combined (Luijkx and de Heus, 2008). Similar to Germany, the Netherlands has a binary system of higher education that distinguishes between polytechnics (HBO) and academic universities (WO). Currently, around 24% of all secondary students proceed to HBO, and 15% to university. There is little difference in quality or prestige between tertiary institutions, and most universities take all applicants with the required qualifications.
Although there are a significant number of private schools in the Netherlands, they are typically denominational schools that are funded by the state. These follow the same curriculum as ordinary public schools. Education, including higher education, is mostly free or highly subsidised. The wide range of secondary and vocational degrees offered by the Dutch education system ensures that very few students leave the school system with no qualifications. Moreover, student mobility across tracks and levels has become more common in recent years (Luijkx and de Heus, 2008).
The English education system
The four home nations of the UK, that is, England, Wales, Scotland and Northern Ireland, have similar but not identical education systems. However, given the numerical dominance of England (about 84% of the UK population live in England), we will describe the English system in this section.
Primary school starts at the age of five and continues until age 11, followed by (lower) secondary education, which takes five years (first to fifth form). Historically, many students left the education system at this point, with or without one or more GCSEs (General Certificate of Secondary Education). Upper-secondary education, GCE Advanced level (A-level), prepares students for university. As Figure 2 shows, the share of students obtaining A-levels and post-secondary qualifications has increased steadily across cohorts.
In contrast to the Dutch and German systems, England does not have a strong tradition of vocational education (Schneider, 2008b). A tracking system used to exist whereby students were educated in either grammar, secondary modern, or technical schools. However, this tripartite system was replaced by comprehensive schools in the mid-1960s. Some selective grammar schools still exist and 8–10% of secondary school students attend private (sometimes boarding) schools, which generally charge substantial fees (Schneider, 2008a). All schools technically follow the same national curriculum and provide access to higher education, although within-school ability tracking exists.
England has a unified higher education sector, but universities differ considerably in quality, prestige and entry requirements. University enrolment has increased rapidly in recent decades and is currently around 35% (Boliver, 2011).
The US education system
The US education system is radically different from its European and Chinese counterparts, mainly because of the more limited role of the federal state. Education is primarily the responsibility of state and local governments, resulting in large regional disparities in education policy and funding (Karen, 2002). Moreover, the private sector plays an important role, particularly in higher education. Many colleges are run on a for-profit basis, and even public colleges typically charge considerable fees.
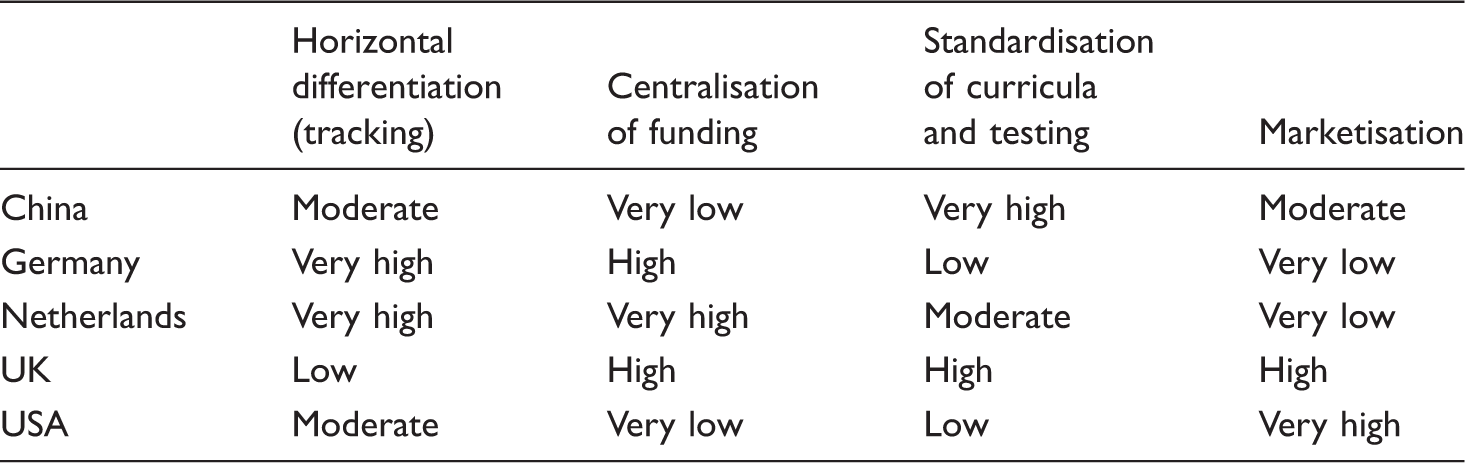
Features of the education system in the five countries.
The implications of the US education system for educational mobility are ambiguous. On the one hand, it offers a high degree of flexibility and openness. On the other hand, marketisation and regional differences imply that children from lower socioeconomic backgrounds typically attend inferior schools and have higher dropout rates.
Summary
A summary of the institutional characteristics of our five cases is provided in Table 1. Compared to the systems in the four Western countries, China’s education system is highly standardised, with a strong emphasis on centralised testing for progression to higher levels. The funding of education, however, is very decentralised, and this has led to large regional differences in the quality and availability of schooling. Private education remains rare in China, although tuition fees for (senior) high school and university have increased sharply since the mid-1990s (Wang et al., 2011). In the following sections, we will explore how this translates into levels and trends in educational mobility.
Method
Data and sample
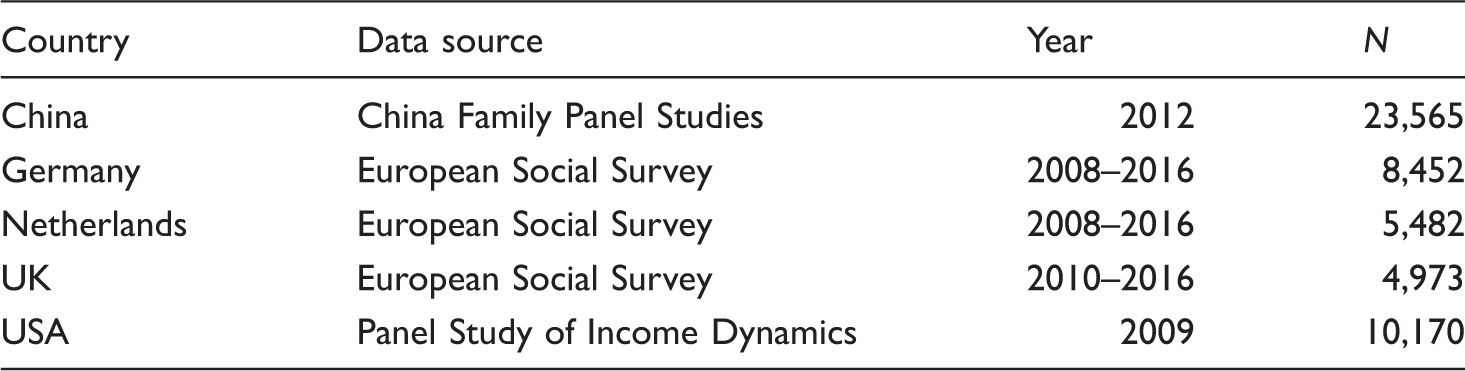
We draw on data from three recent, large-scale and high-quality surveys that provide comparable measures of educational attainment. For China, we use the second (2012) wave of the China Family Panel Studies (CFPS). The CFPS is a large biennial household panel survey of the Chinese population, managed by a team of researchers at Peking University. For Germany, the Netherlands and the UK, we rely on the European Social Survey (ESS), which is a repeated cross-sectional survey of the European population that takes place every other year. We use Waves 4–8 of the ESS (2008–2016), as they contain uniform measures of respondents’ and parents’ education. For the USA, we use the 2009 wave of the Panel Study of Income Dynamics, which provides data on the educational attainment of the main respondents (household head and his/her spouse or cohabiting partner) and their parents.
Data sources.
Analytical approach
We use parental education as a proxy for social origin. Although parental education is not the only aspect of social origin that is relevant for children’s educational attainment, it is causally prior to other family background variables, such as social class and household income, and is strongly correlated with them (Pfeffer, 2008). Previous studies in China or elsewhere that include multiple indicators of social origin generally find that education has the strongest independent effect (Buis, 2013; Shavit et al., 2007; Yeung, 2013). This is because parental education not only proxies for socioeconomic status but also reflects intangible resources that are available in a household (Bukodi and Goldthorpe, 2013).
We use two sets of analytical tools in this article, the first of which are ordered logit models. Recent applications of ordered logit models in educational inequality research include Breen et al. (2009) and Torche (2010). These models provide a parsimonious measure of inequality in educational attainment, so long as the educational outcomes can be ranked from low to high, even if they do not follow a single sequence of stages (Torche, 2010). This is important, as there are parallel educational tracks in many European school systems.
Second, we analyse the data as three-way origin by destination by cohort contingency tables using loglinear and logmultiplicative models. These models provide formal tests of whether or not the origin–destination association has changed over cohorts. Moreover, using the uniform difference or unidiff model (Erikson and Goldthorpe, 1992; Xie, 1992), we will have a one number summary of the change in the origin–destination association across cohorts (Pfeffer, 2008).
There is an ongoing debate about how reliable group comparisons are using non-linear probability models (NLPM) such as ordered logit or loglinear models. It is well known that NLPM parameters are estimated up to scale only. In addition, because the response variable might be more variable in some groups than in others, the underlying scale might be different across groups. This makes group comparisons based on NLPM problematic, even if the unobserved source of variation in the response variable is uncorrelated with the predictor of interest (Allison, 1999; Breen et al., 2014; Mood, 2010). In the present context, this means that it is unreliable to use NLPM to make claims about whether the association between social origin and educational attainment is higher (or lower) in some cohorts (or countries) compared to others. However, Kuha and Mills (2018: 1) argue that ‘these concerns are usually misplaced’, especially if the response variable concerned is truly categorical in nature, in which case ‘the causal effects and descriptive associations are inherently group dependent and can be compared as long as they are correctly estimated’ (see also Buis, 2017; Rohwer, 2012). In any case, we believe the between-country and between-cohort differences that we report in this study are too large to be attributed entirely to unobserved heterogeneity.
Measures
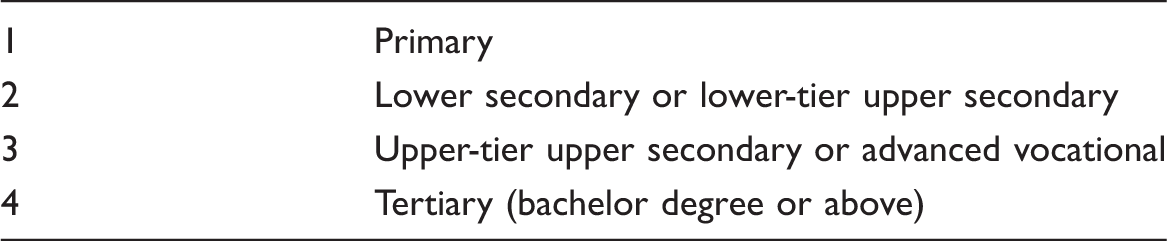
An important challenge for us is to develop a set of educational categories that would support cross-national comparison on the one hand and is sensitive to the idiosyncratic features of each country’s education system on the other. Given the large differences among the education systems of the five countries, these are, to some degree, incompatible goals. We proceed pragmatically. In the main text, we use a four-fold educational classification that is identical for the five countries. In Appendix B, we report supplementary analyses for the Western countries based on more detailed classification schemes that differentiate between the intermediate educational levels. Broadly speaking, the results of the supplementary analyses are very similar to those reported in the main text.
Our starting point is the ESS version of the International Standard Classification of Education (ES-ISCED), which has been implemented in the ESS since 2008 (European Social Survey, 2014). A cross-national validation exercise shows that the ES-ISCED is better at predicting various outcomes, such as income, than alternative measures of educational attainment, including the original ISCED scale (Schneider, 2010). The ES-ISCED has six categories, namely: (1) less than lower secondary; (2) lower secondary; (3) lower tier upper secondary; (4) upper tier upper secondary; (5) advanced vocational/sub-degree; and (6) tertiary.
Four-fold educational classification.
All ordered logit models in this study control for the respondent’s gender. Although gender is an important aspect of educational stratification and is of inherent interest, gender difference in educational mobility is not the focus of this study. Finally, a feature of social stratification that is unique to China is its household registration system, hukou (Wu, 2012). Given the radically different levels of socioeconomic development and public service provision in rural and urban China, and also because of the barriers to geographic mobility, we analyse the data for rural and urban China separately.
Results
Educational attainment
Figure 1 reports the distribution of the respondents by parental education for the five countries and the four cohorts separately. Two points are immediately obvious. First, there are very large cross-national differences. Consider, for example, those respondents born between 1946 and 1955 (see the first column of each panel): 93% of those in rural China and 79% of those in urban China are from the lowest origin category (i.e. their parents have no more than primary qualifications). In Germany, the USA, the Netherlands and the UK, the corresponding figures are 1%, 9%, 32% and 67%, respectively.
Second, all countries have seen large changes over time. For rural and urban China, the share of respondents from the lowest origin category drops progressively across cohorts, reaching 59% and 21%, respectively, for those born between 1976 and 1985. For the Netherlands and the UK, this also drops to 4% and 23%, respectively. For the USA and, especially, Germany, there are very few people from the bottom origin category even in the first cohort. Thus, most of the change in the distribution by social origin takes place further up the educational ladder. The share of respondents with tertiary-educated parents goes from 21% to 40% in the USA, and from 9% to 23% in Germany.
Figure 2 reports the distribution of the respondents by their own educational attainment. Again, we see large cross-national differences and, except for the USA and Germany, large changes over cohorts. The pace of change is especially remarkable in urban China. Only 9% of the urban Chinese from the 1946–1955 cohort have tertiary qualifications. However, for the 1976–1985 cohort, this figure rises to 54%, surpassing the level of Germany (29%), the UK (37%), the USA (38%) and the Netherlands (42%).
Overall, we observe a strong upgrading of education across cohorts. This is, of course, due to the educational expansion in the second half of the 20th century. The cross-national differences in Figure 1 and Figure 2 reflect well-known structural and institutional characteristics of the education systems in the five countries. For example, although a substantial number of British people leave school with no qualifications, this is quite uncommon in Germany or the Netherlands. Compared to the rest of the world, Americans used to have higher levels of educational attainment, because the USA led the world in educational expansion at the secondary and tertiary levels (Goldin and Katz, 2008). Figure 1 and Figure 2 show that many European countries are catching up with the USA. However, the most striking feature of these two figures is the very rapid educational expansion in (especially urban) China over the past few decades.
Educational mobility: Ordered logit models
To gauge the association between parents’ and children’s educational attainment, we fit ordered logistic regression models to the data for each country and cohort separately. These models control for the respondent’s gender. However, we are primarily interested in the estimates for parental education, which are entered as dummies.
Figure 3 plots the cohort trends of the parameters of interest. Although there are interesting exceptions, generally, the flat dotted line, representing the reference category of tertiary education, is at the top of each panel. Below it is the line representing upper-secondary origin, followed by the line for lower-secondary origin and, finally, that for primary origin. This simply means that, as expected, respondents from lower social origins are generally at a greater disadvantage in educational attainment.
Ordered logit parameter estimates by country and cohort.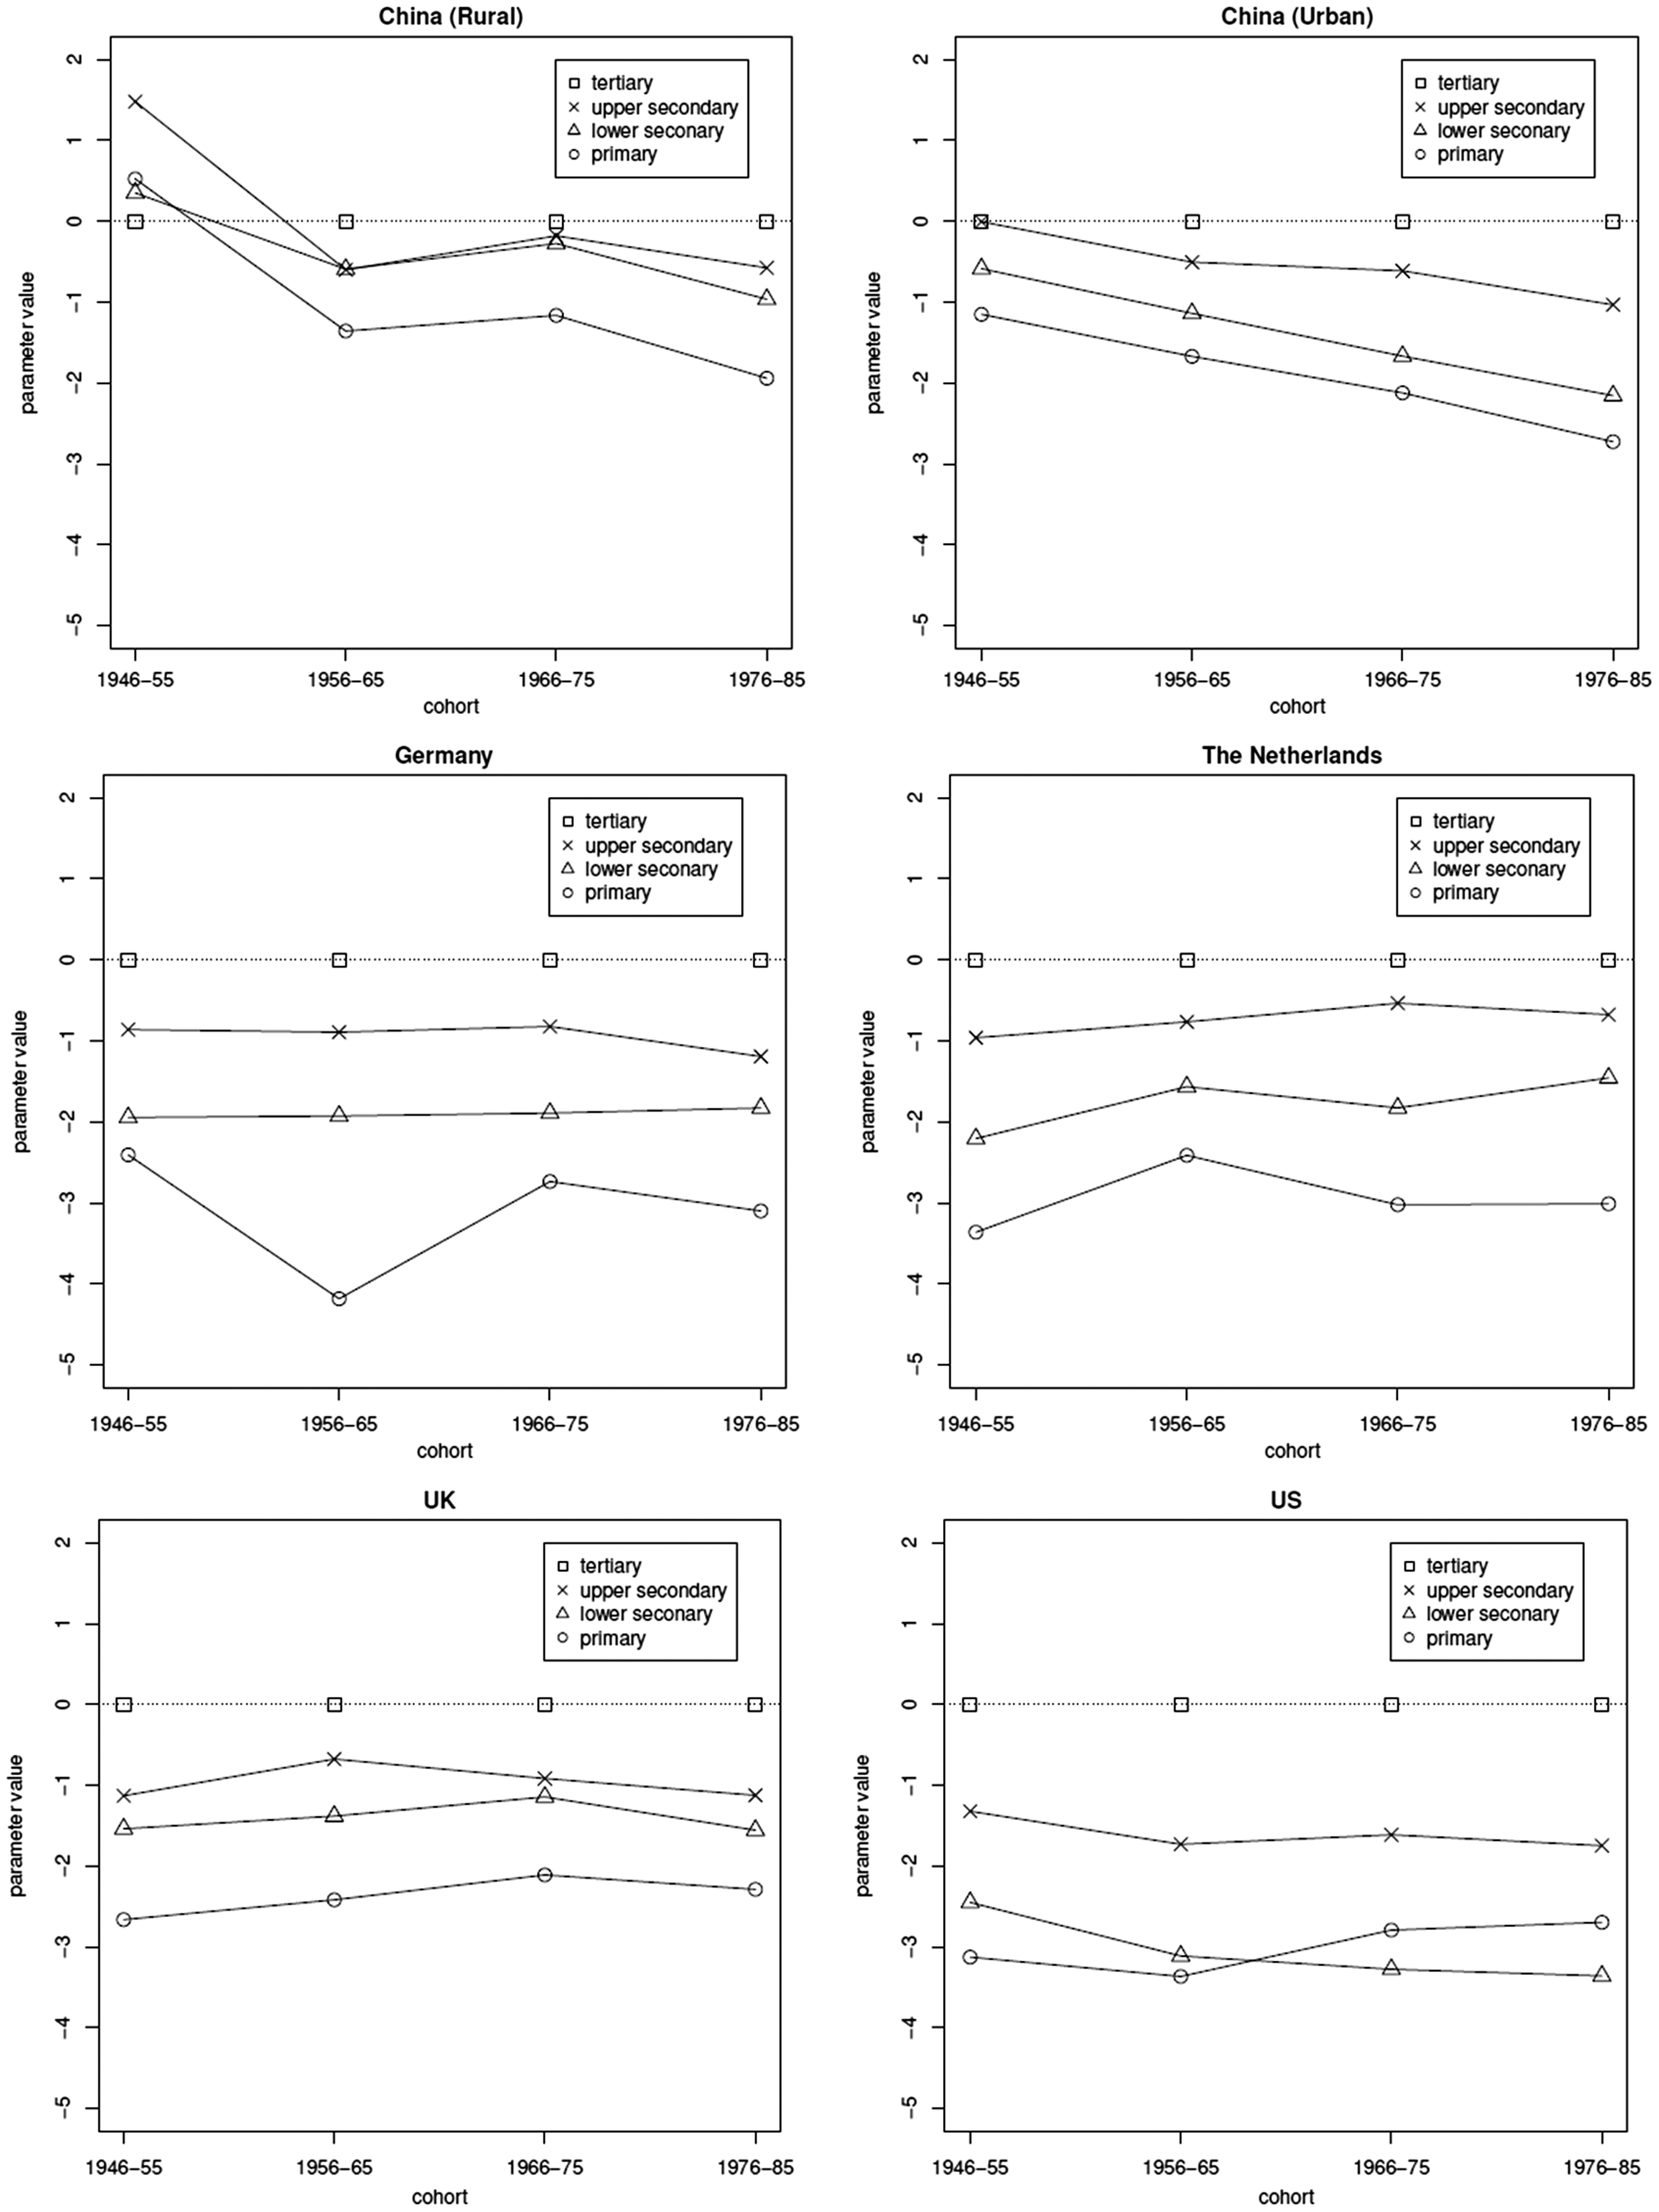
The most interesting exception to this general pattern concerns the first cohort of rural Chinese (see top-left panel of Figure 3), in which respondents with tertiary-educated parents have, on average, the worst educational outcomes. 1 Given that very few rural Chinese from the first two cohorts have tertiary-educated parents (see Figure 1), there is a risk of over-interpreting this unusual pattern. However, it is also worth noting that the first two cohorts of Chinese grew up during the Maoist period. Many of them have experienced severe disruption of education as a result of the social and political turmoil of that period. During that period, political loyalty was often prized over technical expertise, and intellectuals were sometimes considered to be politically unreliable. All these factors might have contributed to the unusual pattern (Deng and Treiman, 1997; Zhou et al., 1998).
We are interested in how the association between social origin and educational attainment has changed over cohorts. This can be inferred from the slope of the cohort trend lines in Figure 3. A flat line would suggest that the gap between the relevant origin category and the reference category has remained stable, that is, persistent inequality. An upward sloping trend line would imply that the gap is getting smaller, that is, a weakening association. Conversely, a downward sloping line would imply that the relevant origin–destination association is getting stronger.
Figure 3 shows that the pattern for China is strikingly different from those observed for the four Western countries. Overall, the cohort trend lines for Germany, the Netherlands, the UK and the USA are generally flat. Thus, there is no evidence that educational mobility has risen or fallen for these countries. In China, however, the trend lines all have clear negative slopes. This means that, across cohorts, the association between parental origin and educational attainment is getting stronger. For the younger cohorts of the Chinese who grew up during the market-reform period, educational mobility has become harder to achieve.
Educational mobility: Log-linear analysis
We now examine the data with log-linear and log-multiplicative models. To elaborate, we arrange the data for each country as a three-way contingency table that cross-classifies the respondents according to their origin (O, i.e. parent’s education), destination (D, i.e. their own education) and cohort (C). To each contingency table, we first fit the conditional independence model (con.ind), which can be represented as follows

Goodness of fit of loglinear and logmultiplicative models fitted to origin by destination by cohort tables.
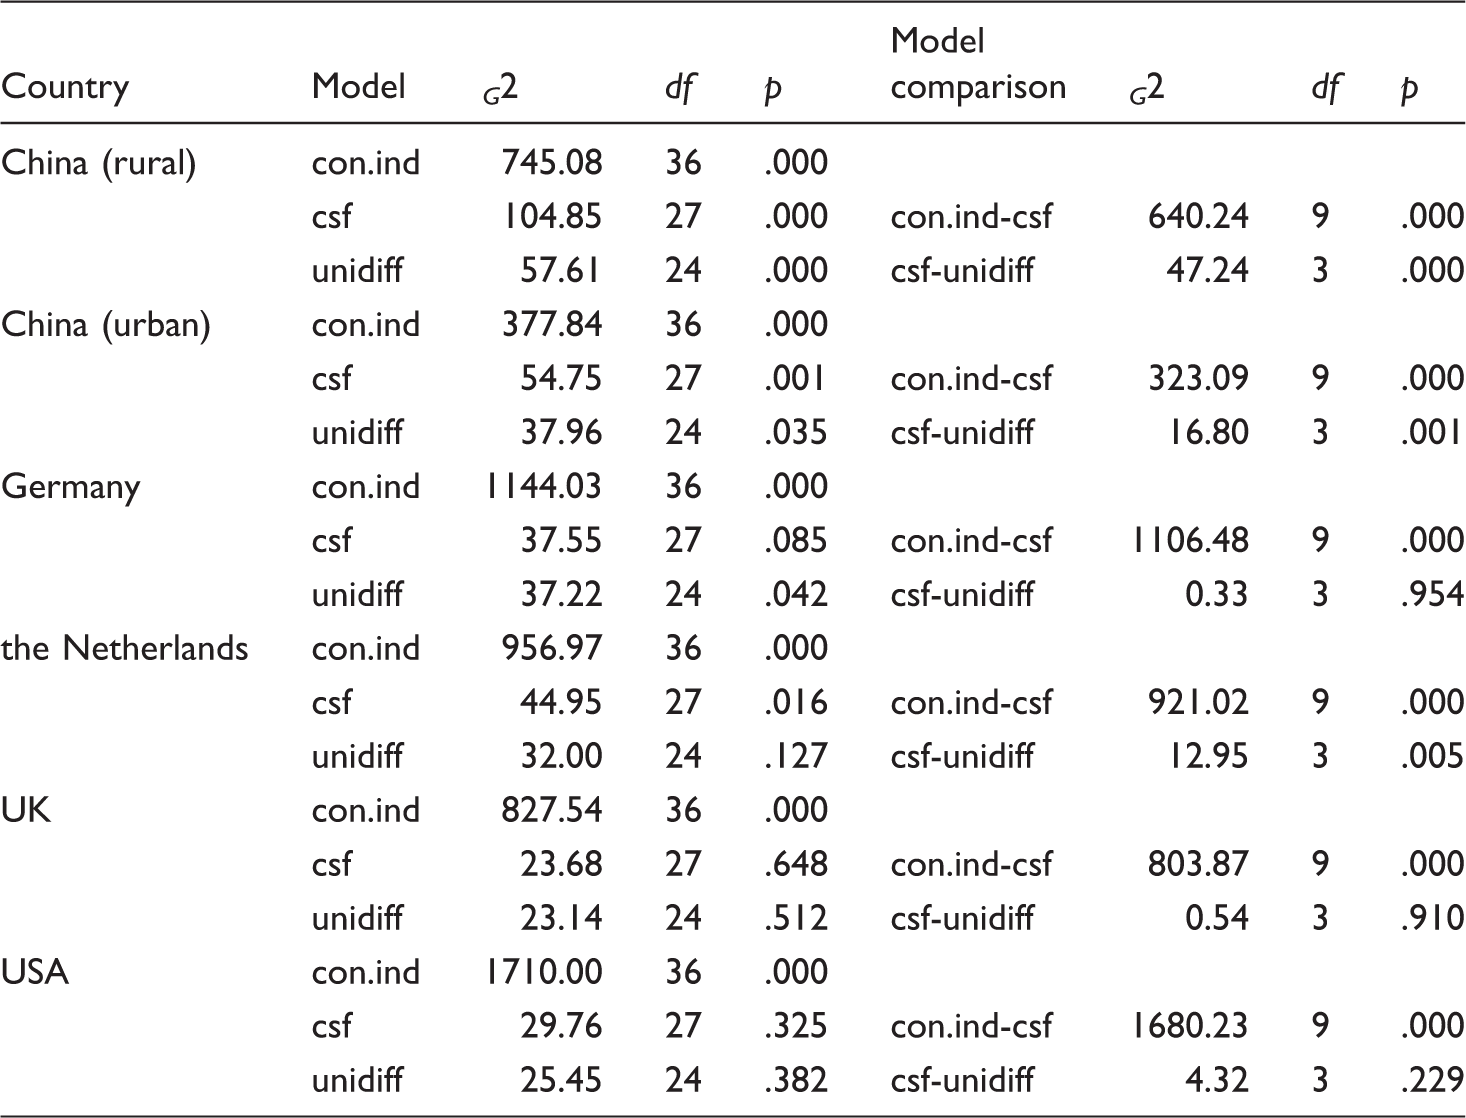
The second model that we fit is the constant social fluidity model (csf), which is basically the conditional independence model plus the 
Table 4 shows that we cannot reject the csf model for the UK, the USA and Germany (p > .05 for these three countries). Thus, for these three countries, our log-linear analyses confirm the results reported in Section 4.2, that there was no change across cohorts in the association between parents’ and children’s educational attainment. For China and the Netherlands, however, although the csf model represents a large improvement over the conditional independence model, it still does not fit the data by the conventional criterion of 5% Type I error.
To investigate further, we fit the uniform difference or unidiff model to the data. The unidiff model requires that the pattern of the OD association be the same across cohorts. However, unlike the csf model, it allows the strength of that association to vary between cohorts by a scalar, φk. The unidiff model can be represented as follows

Table 4 shows that the unidiff model fits the data for the Netherlands, but not the data for rural or urban China. However, when compared to the csf model, the unidiff model does represent a significant improvement in fit in all three cases. Given these results, we report in Figure 4 the estimates of the unidiff parameter, along with their 95% confidence interval. Because of the unusual pattern concerning the first cohort of rural Chinese (see Figure 3), we use the last birth cohort as the reference category for φk (i.e. φ4 = 0) in Figure 4. Given this parameterisation, a negative φk parameter would imply that the OD association is weaker for cohort k as compared to that of the last cohort.
Unidiff parameter estimates by country and cohort.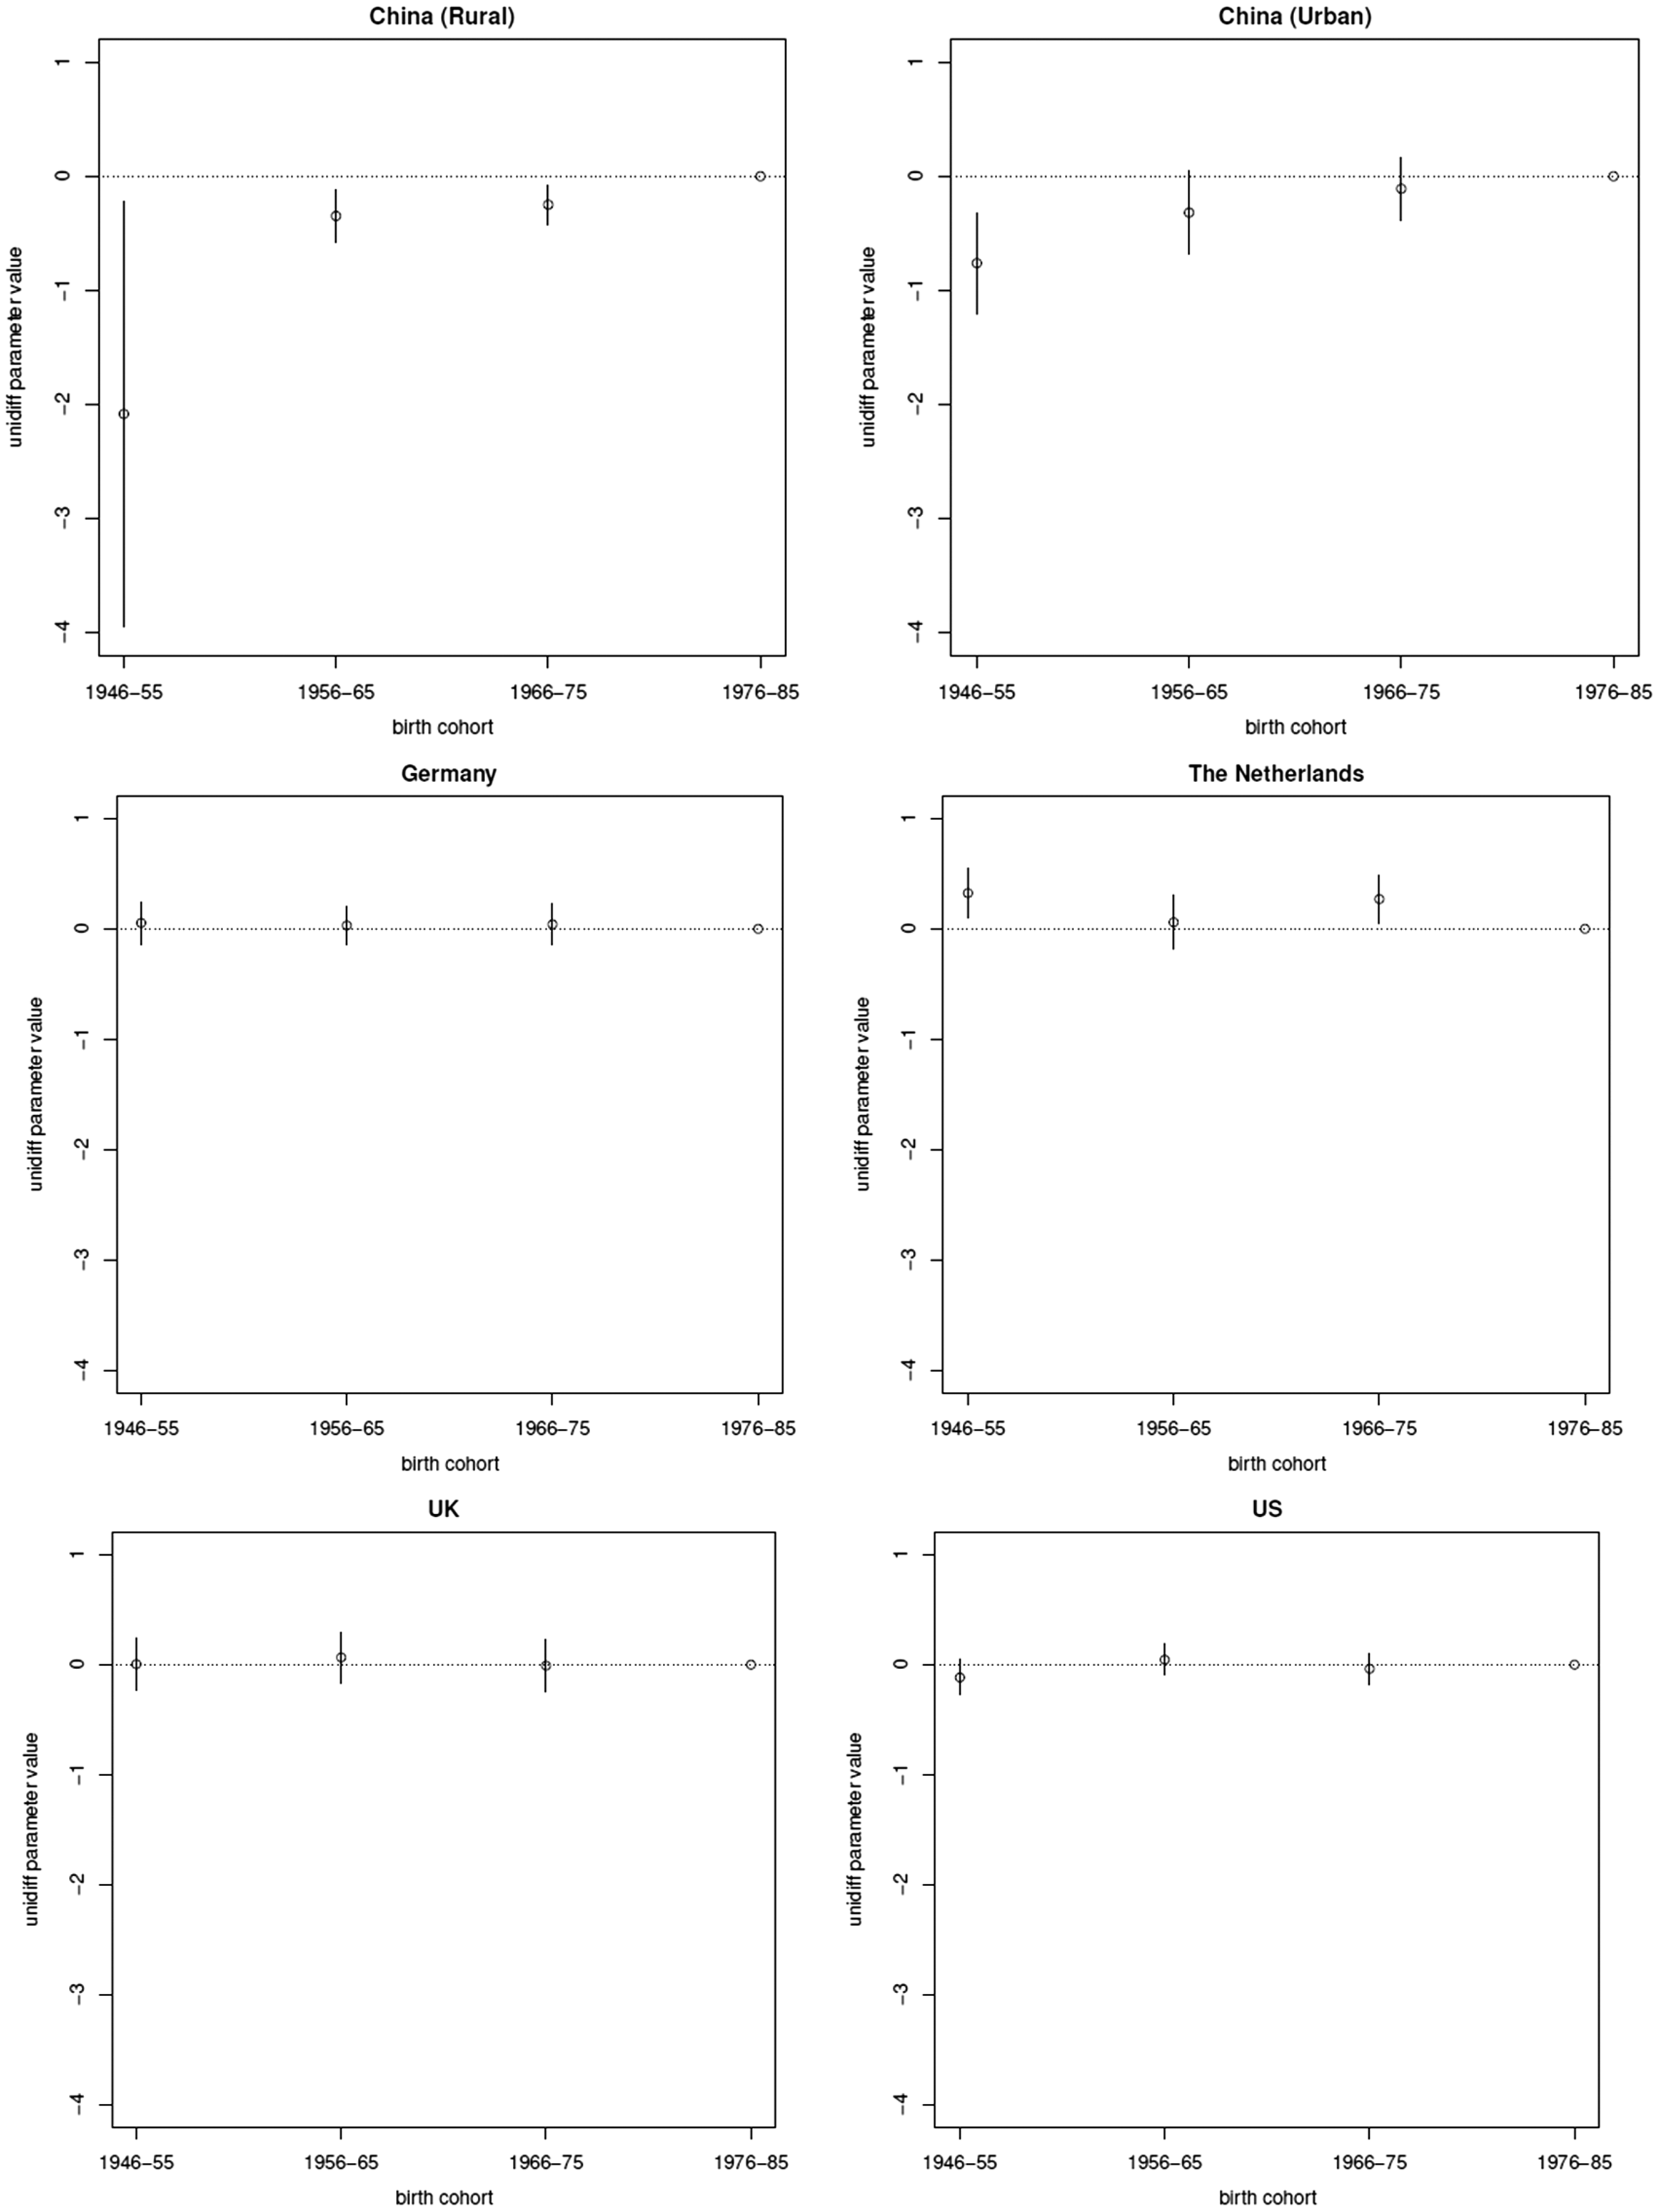
It is clear that for Germany, the UK and the USA, the strength of the association between the parents’ and children’s education, as measured by φk, has not changed significantly by cohort (the relevant confidence intervals cross the horizontal dotted line). This is consistent with the observations that, for these three countries, the csf model fits the data and the unidiff model does not improve on the csf model.
In the Netherlands, however, there is evidence that, when compared to the fourth cohort, the OD association is significantly stronger in the first and third cohorts, but not in the second cohort. Thus, the pattern for the Netherlands is best described as trendless fluctuation.
The pattern for rural and urban China cannot be more different: ϕk consistently becomes less negative, implying that the association between parents’ and children’s education becomes progressively stronger over cohorts. This result is consistent with the ordered logit results reported in Section 4.2. Quite opposite to the pattern of persistent inequality for Germany, the UK and the USA, or the pattern of trendless fluctuation for the Netherlands, we have seen declining intergenerational educational mobility in China.
So far, we have been analysing the data for each country separately, and the results speak to the cohort trends within country. However, it is also important to ask how the countries compare with each other. To this end, we stack the three-way origin by destination by cohort tables together, and reanalyse the data using the last cohort of urban Chinese as the reference category. Figure 5 shows the estimated unidiff parameters for Germany, the Netherlands, the UK and the USA by cohort. In each panel, we also report the unidiff parameters for urban Chinese.
Unidiff parameter estimates of Western countries and urban China by cohort.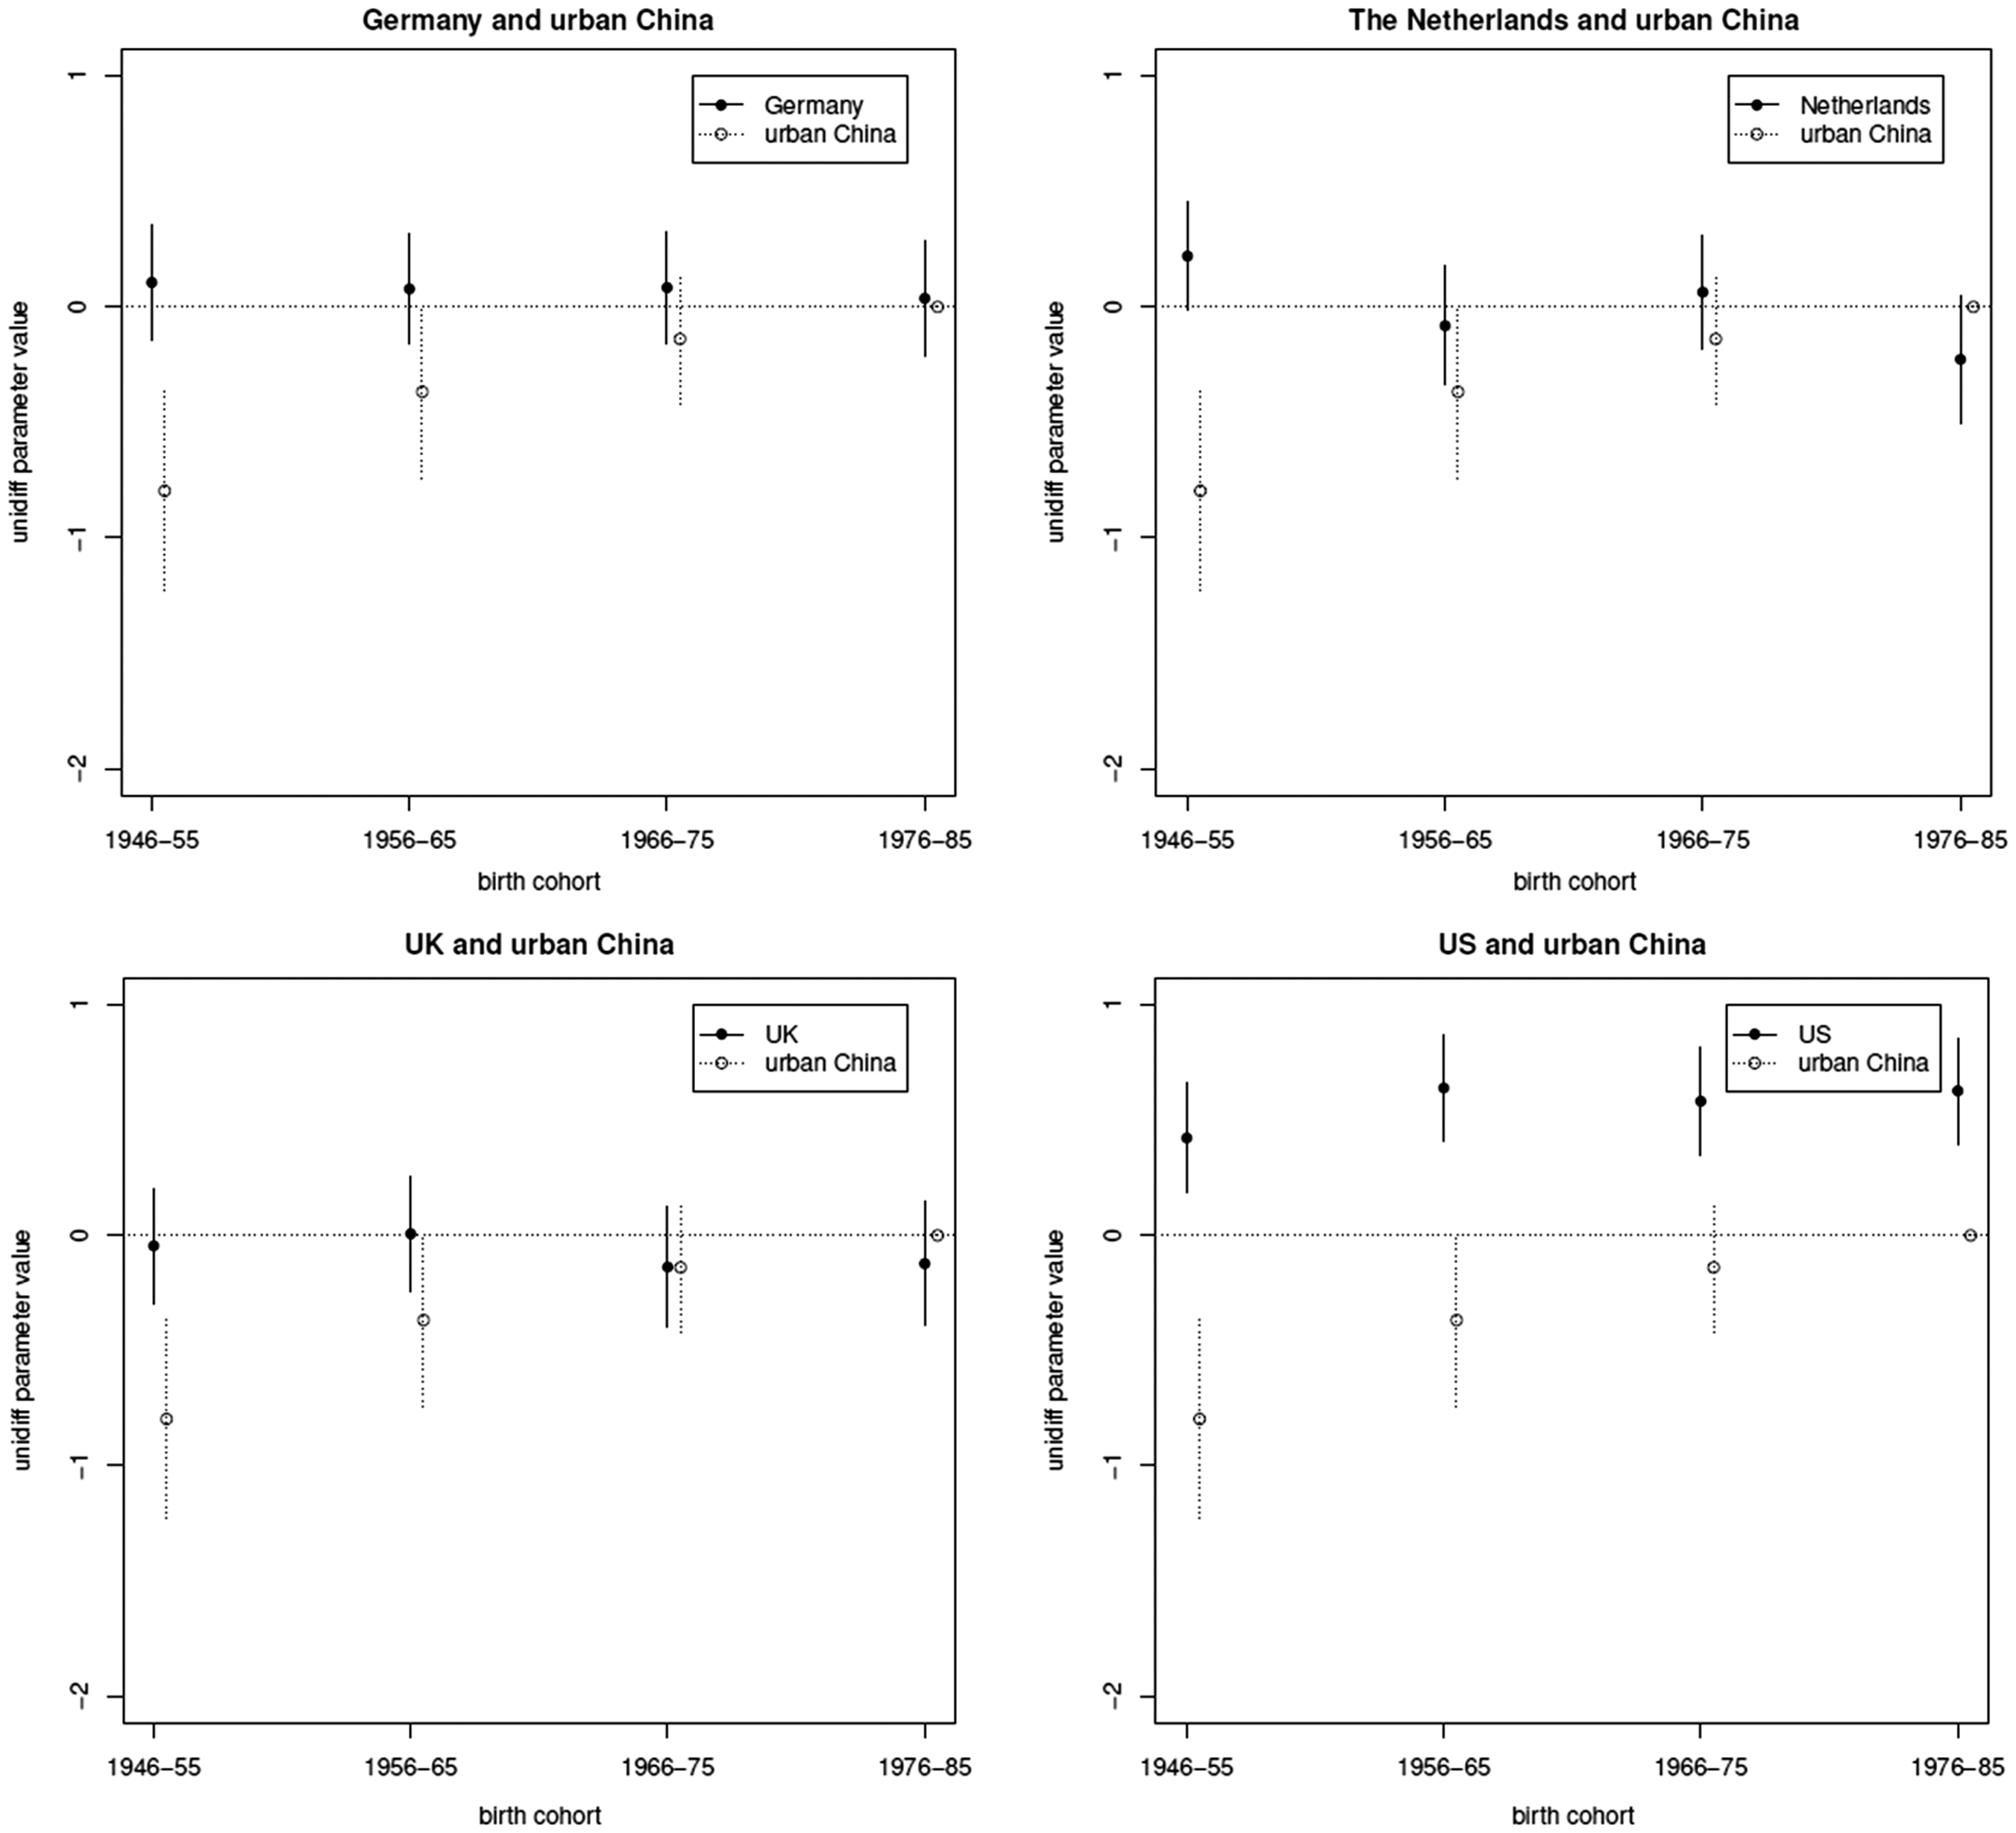
Consistent with what we have seen so far, Figure 5 shows that although the OD association has stayed roughly constant in the Western countries, it has been going up in China. Moreover, whereas the OD association for the last cohort of urban Chinese is still significantly below that for the USA, it is at the same level as Germany, the Netherlands and the UK. In other words, there is more educational mobility in urban China than in America. However, the Chinese rates are broadly comparable to the European levels.
Why has educational inequality increased in China?
In comparative education research, the finding of sustained increase in inequality of educational outcome is rare, particularly during a period of economic growth and educational expansion. Torche (2010) reports increasing class inequality in educational attainment in four Latin American countries during the 1980s. However, that was a decade of deep economic crisis for those countries, and many children from poor households were pulled out of school so they could work and contribute to the household income. Perhaps more similar to the Chinese case is the experience of post-communist Russia. Gerber (2000) finds that enrolment in education in Russia declined during the chaotic transition period, while inequality increased. In China, at the beginning of the market reform, as the radical educational policies of the decade before were reversed, there was a temporary decline in (rural) enrolment rates (Treiman, 2013). However, the market transition in China is very different from that in Russia. For one thing, income inequality in China actually fell in the initial few years of the market reform (Khan et al., 1992). In any case, this argument could not explain why educational inequality continues to rise for the 1976–1985 cohort, who grew up in a period of rapid economic growth and educational expansion.
How could inequality increase even as overall access to education improves? The maximally maintained inequality (MMI) hypothesis states that children from more advantaged social origins tend to be the first to take advantage of the opportunities provided by educational expansion (Raftery and Hout, 1993). Equalisation of opportunities will only occur when the demand from more advantaged groups has been saturated at that level.
Before 1978, access to education at the upper-secondary or tertiary level has long been suppressed, even for children with highly educated parents. For example, in an analysis not shown in this article, we find that, for the 1956–1965 cohort, only about half of the respondents whose parents had senior high school qualifications went on to complete senior high school themselves. In addition, under state socialism (1949–1977), the economic returns to education were very low, and the state actively sought to level class differences in access to education (Zhou et al., 1998).
This changed with the start of the market transition in 1978. As part of Deng Xiaoping’s call to ‘respect knowledge and talent’, the egalitarian goals of the Maoist period were replaced by the principle of efficiency. Market-based education policies, such as the introduction of selective ‘key-point’ schools and the increase in tuition fees for senior high school and college (from the mid-1990s onwards) made access to schooling considerably more unequal. Moreover, the market transition process was accompanied by a sharp rise in income inequality (Xie and Zhou, 2014) as well as rapidly increasing economic returns to education (Zhou, 2014). These broader increases in socioeconomic inequality have been mirrored by the rise of inequality in educational opportunity.
Increasing regional and rural–urban differences in the availability and quality of education may have also contributed to the decline in educational mobility. The expansion of advanced education, which is considered necessary to build a new class of cadres and technical experts, has a strong urban bias. In combination with admissions criteria that favour local residents, this creates a structural disadvantage for rural students (Tam and Jiang, 2015). Moreover, the decentralisation of educational financing that took place in the early 1980s increased regional disparities in educational spending, exacerbating regional inequality in access to and quality of education. For example, Golley and Kong (2013) find that children born in Beijing, Shanghai or Tianjin were 35 times more likely to attend college than children born in rural areas (see also Hannum and Wang, 2006).
Summary and discussion
This article compares the level and trend of educational mobility in China with the situation in Germany, the Netherlands, the UK and the USA. In brief, our findings can be summarised as stable (or persistent) mobility rates in Europe and the USA, and declining mobility in China. The pattern of persistent inequality in European countries contradicts Breen et al. (2009), who find a gradual decline in class-based educational inequality across cohorts for most European countries in the 20th century, including Germany, the Netherlands and the UK. There could be several reasons for this discrepancy. First, whereas Breen et al. (2009) look at cohorts born between 1908 and 1964, our cohorts were born between 1946 and 1985. For the two birth cohorts that overlap with our study (1945–1954 and 1955–1964), Breen et al. (2009: 1495) find no clear decline in educational inequality. Second, we look at inequality based on parental education rather than parental class. Parental education is a stronger predictor than class because it is strongly correlated with material as well as immaterial resources available in the household (Shavit et al., 2007). Previous studies have found that the effect of education has been more persistent than that of social class (Buis, 2013).
In the Chinese case, we observe a sustained increase in inequality of education outcomes. In the comparative literature on educational inequality, which now covers most of the industrialised world, such a finding is highly unusual, particularly during periods of robust economic growth and educational expansion (e.g. Blossfeld et al., 2016; Pfeffer, 2008). The reason for this finding should be sought in China’s recent history, that is, the transformation from a relatively egalitarian socialist system (1949–1978) to a highly unequal market system (1978–present). Previous studies confirm that advantaged groups have benefited disproportionately from the educational reforms and expansion that followed the market transition (Deng and Treiman, 1997; Zhou et al., 1998). We show that inequality increases even further for the ‘second market generation’, who came of age during the early 1990s, mirroring broader increases in socioeconomic inequality during this period (Xie and Zhou, 2014).
This finding, which is consistent with other recent research (Wu, 2010; Yeung, 2013), is probably due to a combination of factors. First, market-based educational reforms, such as the introduction of tuition fees for senior high school and college in the 1990s, increased the importance of parental resources for children’s educational success. In addition, increasing economic returns to education strengthened the correlation between parental education and other aspects of social origin (especially income) over time. Second, the decentralisation of educational funding in the 1980s increased regional disparities in the availability and quality of schools. As a result, children from rural and poorer backgrounds tended to leave the education system before they reached the more advanced educational stages. In addition, there has been long-standing discrimination against people with rural hukou. All these factors have led to a situation in which educational expansion at the tertiary level mainly benefits already privileged urban residents (Tam and Jiang, 2015). Any effort to counter the trend of rising educational inequality in China should, therefore, focus on reducing attrition and improving access to quality education in rural and less developed areas.
Our findings contribute to the comparative study of educational inequality in a number of ways. By adding the case of China, we expand the comparative literature that has so far focused on OECD countries (Blossfeld et al., 2016; Breen et al., 2009; Pfeffer, 2008). Moreover, our finding of increasing inequality challenges arguments such as the MMI (Raftery and Hout, 1993) and effectively maintained inequality (EMI) (Lucas, 2001), which set out to explain the persistence of inequality. Future theoretical development should consider situations in which educational inequality can increase over sustained periods of time, particularly in transitional societies.
That said, a number of limitations should be taken into account when interpreting our results. First, the trends described in this article refer to inequality based on parental education. Other aspects of social origin, such as region of birth, family structure and parents’ occupational status, may have additional effects on children’s educational outcomes. Furthermore, the harmonisation of educational credentials necessarily involves a degree of compromise, which may mask important differences in the quality of particular educational degrees in different countries. In China, differentiation within nominally the same level of education (e.g. between rural and urban schools) may be larger than in Europe, where regional inequality is generally smaller.
Footnotes
Acknowledgements
We thank Maja Djundeva and Yu Xie for their comments on an early draft.
Declaration of Conflicting Interests
The author(s) declared no potential conflicts of interest with respect to the research, authorship, and/or publication of this article.
Funding
The author(s) disclosed receipt of the following financial support for the research, authorship and/or publication of this article: Our research is supported by an ESRC research grant, award number ES/L015927/1.