
Abstract
Individuals and society as a whole seem to be particularly fearful of cancer. A web-based study with data collected from Qualtrics panels in the United States (N = 810) was conducted to investigate the antecedents, consequences, and correlates of fear of cancer. Comparisons were made across four cancers (lung, thyroid, pancreas, and melanoma) that varied in prevalence and death rate, and three non-cancer diseases (heart attack, diabetes, and HIV/AIDS). Individuals were indeed particularly scared of cancer. Their fear was influenced by threat appraisals related to both disease and treatment side effects. Risk estimates for diseases were influenced jointly by emotion and threat appraisal.
Cancer is scary. In a poll by MetLife Foundation published in 2011, 41% of the individuals polled reported cancer as their top health fear. There seems to be fear of cancer at the society/government level as well. The US Congress passed the National Cancer Act in 1971, which reflected the collective affect of the legislative body (and their constituents) toward cancer. Over the years, among all the units within the National Institutes of Health (NIH), the National Cancer Institute (NCI) has consistently received the lion’s share of the NIH budget (Health and Human Services (HHS), 2018), despite the fact that cancer is not the leading cause of death. 1 There are legitimate reasons for individuals to be scared of cancer due to the pain and suffering that come with it. On the other hand, fear of cancer can also seem disproportionate. For example, two-thirds of human beings will never get cancer, even the majority of heavy smokers do not get cancer, because the same mutations in the human body that cause cancer can also produce active resistance against cancer (Klein, 2009). The disproportionate fear of cancer can be seen in the ubiquitous media coverage of cancer-related stories, and occasionally celebrities keeping cancer in the headlines when they discuss their own cancer diagnoses and/or their efforts to prevent cancer, as in the example of the Angelina Jolie effect (Desai & Jena, 2016).
Excessive and disproportionate fear of cancer can be dysfunctional and counterproductive. First, it can negatively affect intentions to get cancer screening and the use of health services, and adherence to follow-up recommendations, which inhibits the effectiveness of cancer prevention efforts (e.g. Zanella & Banerjee, 2014). Second, it can be distressing and long-lasting, and negatively impact daily functioning and quality of life for both patients and their families (e.g. Butrow et al., 2018). Third, it can lead to unnecessary tests (cf. Desai & Jena, 2016), overdiagnosis, and overtreatment, which can be not only expensive but also dangerous (e.g. Abbott et al., 2011). In a word, excessive fear of cancer might do more harm than the actual disease, especially when diagnostics and therapeutics for cancer are propagating and improving at a rather fast pace. For example, the overall death rate from cancer in the United States dropped by 26% between 1991 and 2016 (NIH, 2018).
It is recommended that excessive fear of cancer should be discussed, forewarned about, and assessed (Butrow et al., 2018). Cognitive behavioral therapy and psychological counseling seem to be part of the solution. Yet, prevention might be ethically, economically, and psychologically more cost-effective than treatment. Further understanding of the causes, consequences, and correlates of fear of cancer is, therefore, imperative for its prevention and treatment. Such is the goal of this article. Hypotheses and research questions will be derived from the emotion literature. Data from a mixed-design, web-based study will be presented. Implications for fear of cancer, risk estimate, and health communication will be discussed.
Fear of cancer as a discrete emotion
There are a multitude of definitions for emotion. After surveying 34 emotion researchers, Izard (2010) found that there were as many theories and as many definitions of emotion as there were emotion theorists. The discrete emotions approach argues that emotions are distinct patterns of changes in multiple systems: expressive, motivational, cognitive, and physiological, and that discrete emotions have unique elicitors (Lazarus, 1991; Öhman, 2000). Cognitive appraisal theories (cf. Scherer et al., 2001) argue that emotions arise from evaluations that individuals make about the implications of their environment for their own well-being, and that appraisal theorists contend that appraisals are the antecedents and causes of emotions and that differences in appraisal can account for individual and temporal differences in emotional responses. Lazarus’ (1991) cognitive motivational relational theory suggests the primary (if and how an encounter is relevant to a person’s well-being) and secondary appraisals (i.e. an evaluation of the person’s options and resources for coping with the situation and future prospects) determine the core relational themes that correspond to discrete emotions. The core relational theme for fear/fright is facing an immediate, concrete, and overwhelming physical danger (e.g. when someone is diagnosed with aggressive terminal cancer), while that for anxiety is facing uncertain and existential threat (e.g. when someone has known cancer risk factors such as family history). Therefore, across individuals, fear of cancer can encompass both fright and anxiety in Lazarus’ terms.
The primary and secondary appraisals of fear suggest that assessment of the danger and threat is positively associated with fear. Models of threat/fear appeal are in line with Lazarus. The extended parallel process theory (Witte, 1992) and protection motivation theory (Rogers & Prentice-Dunn, 1997) both suggest that perceived severity (i.e. the degree to which the physical and social consequences are harmful) and perceived susceptibility (the probability that such harms happen to oneself) are correlated with fear. Meta-analyses in the fear appeal literature have consistently demonstrated the positive association between fear and threat appraisal (Tannenbaum et al., 2015; Witte & Allen, 2000). Literature on risk and decision-making has produced similar findings (e.g. Slovic, 2000; Slovic et al., 1981). In the case of cancer (or in any other diseases), the potential negative consequences (i.e. threat) can be caused by (1) the disease itself and (2) potential harmful side effects that come with its treatment. Hence, it was predicted that
The core relational theme for the emotion fear (i.e. an immediate and concrete danger) suggests that the proximity and imminence of the danger and threat are directly associated with the intensity of fear (e.g. Arnaudova et al., 2017). The distance can be physical and/or psychological. The construal-level theory (Trope, 2012) argues that psychological distance consists of temporal, spatial, social, and hypothetical components. The Zanella and Banerjee (2014) study suggests that the psychological distance of (co-workers’) breast cancer diagnosis impacts the intensity of fear. Psychological distance to diseases can be informed by one’s experiences with the disease under consideration, either one’s own or by other people in their social and interpersonal relationships. Along with this line of argument, it was predicted that
Research has suggested that in general fear of cancer is not due to the prevalence of cancer diagnoses or death rate. Among cancer patients, fear is not strongly associated with objective prognostic markers such as tumor size and stage of cancer, but is highly correlated with repeated and prolonged treatment (e.g. Yang et al., 2017). This suggests that there might be something fundamentally more frightening and scarier in cancer. Barrett’s theory of constructed emotion (Barrett, 2017) suggests that this might be the case. The central tenet of the theory is that the human brain uses past experience, organized as concepts, to give meaning to subjective experiences and to guide actions. When the concepts involved are emotions, the brain constructs instances of emotions. The ingredients of the construction consist of (1) interoception, which is the sense of the internal state of the body that produces the basic affective feelings; (2) concepts, which are embodied knowledge from one’s (sub)culture; and (3) social reality, which provides the collective agreement and language that make the perception of emotions possible among individuals within the same (sub)culture. In extreme cases, if one’s language does not have a vocabulary for a specific emotion, then one could experience that specific emotion. In general, one’s experience of a specific emotion is shaped by the vocabulary for the emotion. That is, the experience of fear of cancer would be shaped by the word cancer in a particular language and/or used in a particular culture. There has been some evidence that emotions (i.e. worry) vary across diseases and there might be a unique pattern for cancers (Shiloh et al., 2013). However, it is not clear whether there would be a cluster of cancers when it comes to the emotion fear. Hence, a research question was asked:
The impact of fear on threat appraisals
The relationship between cognition and affect, or the primary of either, has been the topic of the Lazarus-Zajonc debate (see Lazarus, 1999), suggesting that mutual or reciprocal influences between emotion/affect and cognition/perceptions are possible. There are theories and empirical evidence that affect can influence cognitive responses and perceptions as well. The literature on incidental affect and message processing has argued that (1) affect can reduce one’s cognitive capacity (Mackie & Worth, 1989), (2) or be used as a resource (Trope et al., 2001) to process risk information, (3) affect can be used as informational input in risk perception (Bohner et al., 1992), or (4) can introduce biases into the processing of risk information (Wegener & Petty, 1994). Oatley’s (1992) communicative theory of emotions suggests that cognition and affect interplay in the process of perception and attitude formation/change. The protection motivation theory suggests that there are mutual influences between fear and threat appraisals (Rogers & Prentice-Dunn, 1997).
From the evolutionary psychology perspective, fear is an adaptive strategy designed to protect an organism from risks and dangers (e.g. a predator) (Tooby & Cosmides, 2008; LeDoux, 2019). As a superordinate system, the emotion of fear strategically mobilizes resources, for example, accelerated heart rate, increased skin conductance, and widens the cornea (e.g. Lee et al., 2014), to enhance attention, recognition, and processing of risk and danger information. Along this line of argument, if the adaptive function of fear is to protect an organism from the harms of danger or threat, then perceptions relevant to threat and risk are expected to be influenced by the emotion. There has been empirical evidence that fearful individuals overestimate the size of danger and risk when they are self-relevant: Spider-fearful individuals rated spiders as larger than controls (Leibovich et al., 2016), people fearful of heights perceive heights as taller than those unafraid (Stefanucci & Proffitt, 2009). There is also well-established evidence in research on risk that affect drives risk perception without much cognitive input (e.g. Braman et al., 2007). Therefore, two alternative hypotheses regarding the relationship between fear and threat appraisals:
Note that there are theories and empirical evidence for both the impact of cognitive appraisals on fear (H1) and that from fear on cognitive appraisals (H3). This means that their relationship might not be mutually exclusive, but rather simultaneous and complementary to each other. Furthermore, it is well established in research on risk and decision-making that affect and cognition interplay to influence risk estimates (i.e. statistical/percentage estimates of risk) (Braman et al., 2007; Slovic, 2000). The affect can be fear, anxiety, or worry (e.g. Peters et al., 2006; Shiloh et al., 2013). Hence, it is predicted that
Method
Study design
Participants responded to questionnaires on two disease topics. These two diseases were either cancer or non-cancer and randomly selected from a total of four topics within cancer or non-cancer. The disease topics within cancer or non-cancer also varied in terms of fatality and prevalence. Thus, the different versions of the questionnaires constituted a 2 (fatality rate: high vs low) × 2 (prevalence: high vs low) × 2 (cancer vs non-cancer disease) × 2 (topics) mixed design, with cancer (vs. non-cancer) and topic as within-subject factors. The cancers were lung cancer (high fatality, high prevalence), pancreatic cancer (high fatality, low prevalence), melanoma (low fatality, high prevalence), and thyroid cancer (low fatality, low prevalence). The non-cancer diseases were heart attack (high fatality, high prevalence), type II diabetes (diabetes henceforth) (low fatality, high prevalence), and HIV/AIDS (high fatality, low prevalence) (cf. Centers for Disease Control and Prevention (CDC), 2017a, 2017b, 2017c; NCI, 2019). There was no low-prevalence, low-fatality non-cancer disease because that would be almost equivalent to the overall baseline. The particular diseases were selected to introduce variance in the appraisal variables, which were not experimental manipulations of fatality or prevalence per se. Each participant was randomly assigned one of the four fatality prevalence cells and responded to questions related to one cancer and one non-cancer disease that were each randomly selected from their respective group.
Participants (N = 810) were recruited through a national paid opt-in online panel comprising individuals who registered with Qualtrics panels in the United States. Ages ranged from 18 to 85 years old (M = 45.84, SD = 16.81). The demographic and geographic profiles of the sample represented the census data through quota sampling: The proportion of men and women was almost identical
Procedure
Data were collected in the form of a web-based questionnaire, through Qualtrics. Following consent, participants were randomly assigned to one of four cancers and one of three non-cancer diseases. The cancer- and non-cancer-related questions were presented in a random order. After reading an informational description of the disease and its treatment options, which was adapted from information from the American Cancer Society, NIH, and CDC, participants reported emotional responses and cognitive perceptions related to the severity and susceptibility of the disease and the severity and susceptibility of the side effects associated with the treatment for the disease. To mitigate possible methodological artifacts when testing the competing hypotheses regarding the reciprocal relationships between fear and appraisals, the emotional responses and the cognitive appraisal questions were presented in a random order. For each specific disease, participants also reported if (1) they themselves have been diagnosed with it, (2) if they have family members and/or friends/coworkers/acquaintances who are diagnosed with it, and (3) a percentage estimate of their own risk of getting the diseases. Toward the end, the participants reported their demographic information and responded to questions on trait anxiety. The entire participation lasted 4.31 to 21.18 minutes (M = 12.35, SD = 3.15). For quality control purposes, participants who spent less than one-third of the median duration in the soft launch were dropped from the data. Participants who failed at the attention check questions planted in the survey were also automatically removed from the sample. The sample of N = 810 was the final sample size after the low-quality cases were dropped.
Measures
The uni-dimensionality of multi-item scales was established with confirmatory factor analyses (CFAs) for non-repeated measures and multilevel CFA for disease-specific measures that were repeated. For repeated measures scales, multi-level alpha reliabilities were assessed following the procedures in Nezlek (2016).
Fear
Fear responses were assessed with a three-item 5-point scale ranging from 0 = none of this feeling to 4 = a great deal of this feeling (Dillard & Shen, 2006). Items were fearful, scared, and afraid. Items were averaged into a composite score (α = .92, M = 2.38, SD = 1.35).
Cognitive appraisals of disease
Appraisal of disease was assessed with two measures: perceived susceptibility and perceived severity. Susceptibility was assessed by a four-item (i.e. “it is likely that I will get it”) 5-point scale ranging from 1 = strongly disagree to 5 = strongly agree (adapted from Witte, 1996). Items were aggregated to form a composite score (α = .98, M = 2.67, SD = 1.10). Perceived severity of disease was assessed with a four-item (e.g. “is harmful”) 5-point scale ranging from 1 = strongly disagree to 5 = strongly agree (Witte, 1996). Items were averaged into a composite score (α = .95, M = 4.11, SD = 0.86).
Cognitive appraisals of treatment side effects
Perceived susceptibility to treatment side effects was assessed with four items (e.g. “it is likely that I will get it”) 5-point scale ranging from 1 = strongly disagree to 5 = strongly agree (adapted from Witte, 1996). Items were aggregated to form a composite score (α = .87, M = 3.65, SD = 0.79). Perceived severity of treatment side effects was assessed with a four-item (e.g. “is harmful”) 5-point scale ranging from 1 = strongly disagree to 5 = strongly agree (Witte, 1996). Items were averaged into a composite score (α = .92, M = 3.60, SD = 0.77).
Risk estimate
The estimate of one’s risk of getting the disease under consideration was measured by a single question in the slider format, asking the participants to report the percentage likelihood (0%–100%) that they would get the disease (M = 28%, SD = 26.85%).
Experience with the disease
Participants reported whether they themselves (yes = 5%, n = 39 for caners, and yes = 9%, n = 76 for non-cancer diseases), or anyone from their family members, friends, colleagues, and acquaintances had been diagnosed with the particular disease. An index was created by taking the sum of these items to reflect one’s experience with disease (M = 1.05, SD = 1.29). A zero means that including themselves, nobody in their social and personal relationships had been diagnosed with the disease. For cancers, 55.5% of the sample (n = 449) scored 0. For non-cancer diseases, 41.3% of the sample (n = 335) scored 0.
The following variables that were not of theoretical interest, but likely to correlate with threat and cooing appraisals, and fear were measured as controlled covariates, including household income, education, health insurance, and previous behaviors that are related to risks of cancers, heart attack, diabetes, and HIV/AIDS. We also considered and controlled for individual differences in trait anxiety because both theory and empirical evidence have demonstrated their robust associations (e.g. Witte & Allen, 2000).
Household income
A single question asked participants’ annual household income: What is your annual household income? The response options were as follows: below $10k (12%), $10–$50k (31.1%), $50–$100k (34.1%), $100–$150k (16.7%), and over $150k (6.1%).
Education
A single question asked the participants to report their education level: less than high school (2.1%), high school or equivalent (32%), associate degree or community college (24.3%), bachelor’s degree (27%), master’s degree (12.3%), PhD or professional degrees (e.g. JD, MD) (2.2%).
Health insurance
Three questions asked about insurance-related issues. The first question asked whether the participants had health insurance (yes = 89%). The second asked whether they were Medicare recipients (yes = 33%), and the third was about Medicaid benefits (yes = 23%).
Tanning behavior
Previous tanning behavior was assessed with three items (i.e. “how often do you try to suntan,” “how often do you use a sunlamp,” and “how often do you use a tanning bed”) on a 6-point scale ranging from 0 = never to 5 = very frequently. The items were averaged into a composite score (M = 0.58, SD = .98). Since the items were considered as formative indicators of a healthy diet, alpha reliability was not relevant (Bollen & Diamoantopoulos, 2017).
Smoking behavior
Previous smoking behaviors were assessed with two questions: “On how many of the last seven days did you smoke a cigarette—even one puff?” and “How many cigarettes did you smoke, on average, a day in the past seven days?” The product of responses to these two questions (i.e. smoking days by cigarettes per day) yielded an estimate for the number of cigarettes smoked in the past week. Sixty-eight percent of the sample smoked zero cigarettes (n = 554). The variable was transformed by taking the square root to reduce heteroskedasticity (M = 2.90, SD = 4.81).
Sexual behaviors
Two questions were asked about respondents’ sexual behaviors. One about safe sex practice: “Have you ever had unprotected sex, including oral, vaginal, and/or anal?” (72% reported yes, n = 406). The other asked them to report the number of sex partners in the past year (M = 3.73, SD = 3.63).
Exercise behaviors
Participants’ exercise behaviors were assessed with two items: “On how many of the last seven days did you participate in at least 30 minutes of physical activity? (Total minutes of continuous activity, including walking)” and “. . . participate in a specific exercise session (such as swimming, walking, biking) other than what you do around the house or as part of your work?” These two items were averaged to form a composite score (M = 3.25, SD = 2.22, α = .84).
Diet
Two questions asked about the respondents’ diet: On how many of the past 7 days did you have five servings of fruit and vegetables? And on how many of the past 7 days did you space out carbohydrates evenly through the day? The two items were averaged into an index (M = 3.64, SD = 1.90). Since the items were considered as formative indicators of a healthy diet, alpha reliability was not relevant (see Bollen & Diamoantopoulos, 2017).
Trait anxiety
The short form of the Spielberger inventory on a 4-point scale (0 = not at all, 3 = very much so) (Spielberger et al., 1983) was used to measure individual differences in trait anxiety. The items were averaged into a composite score (M = 1.16, SD = 0.79, α = .89).
Results
Data analyses strategy 2
Given the disease-specific questions were repeated measures, multilevel models were estimated with individuals at the higher level and disease as repeated measures clustered within individuals, and with measurement occasions (i.e. diseases nested within individuals) specified as the random-effects factor (see Raudenbush & Bryk, 2002) to test H2 and to answer the RQ. Given the potential nature of competing or complementary relationships between the alternative hypotheses (i.e. H1 vs H3), they were tested within the framework of multilevel structural equation modeling (SEM). To the degree that the alternative hypotheses are complementary to each other, the impact of cognition and fear on risk estimates (H4) cannot be properly assessed until the reciprocal causation between the two stabilizes and reaches an equilibrium (as in non-recursive models). Therefore, H4 was also tested via multilevel SEM.
Statistical power
Statistical power for multilevel analyses in this study was estimated using the Optimal Design Plus Software (Version 3.0) (Spybrook et al., 2011). With repeated measures design for randomized study, assuming
Hypothesis 2 and the research question
Series of multilevel models were estimated to predict the fear with cancer (vs non-cancer), experience with diseases nested within individuals as the random-effects factor, and with demographic variables (sex, race, education, income, status of health insurance, Medicare, and Medicaid), previous health behaviors (smoking, tanning, diet, exercise, and sexual behaviors), and trait anxiety as controlled covariates. There was a significant main effect for experience on fear: F(1, 948.6) = 23.19, p < .001. Individuals with experience reported more intense fear (M = 2.58, SE = 0.15) than those without (M = 2.28, SE = 0.15). There was no significant interaction between cancer and experience: F(1, 689.70) = 0.003, p = .95. H2 received support.
There was also a significant main effect for cancer (vs non-cancer) (RQ1): F(1, 548.5) = 8.74, p = .003. Individuals reported significantly higher levels of fear of cancers (M = 2.50, SE = 0.15) than non-cancer diseases (M = 2.36, SE = 0.15). Notably, these means were above the mid-point of the scale (i.e. moderate level of fear).
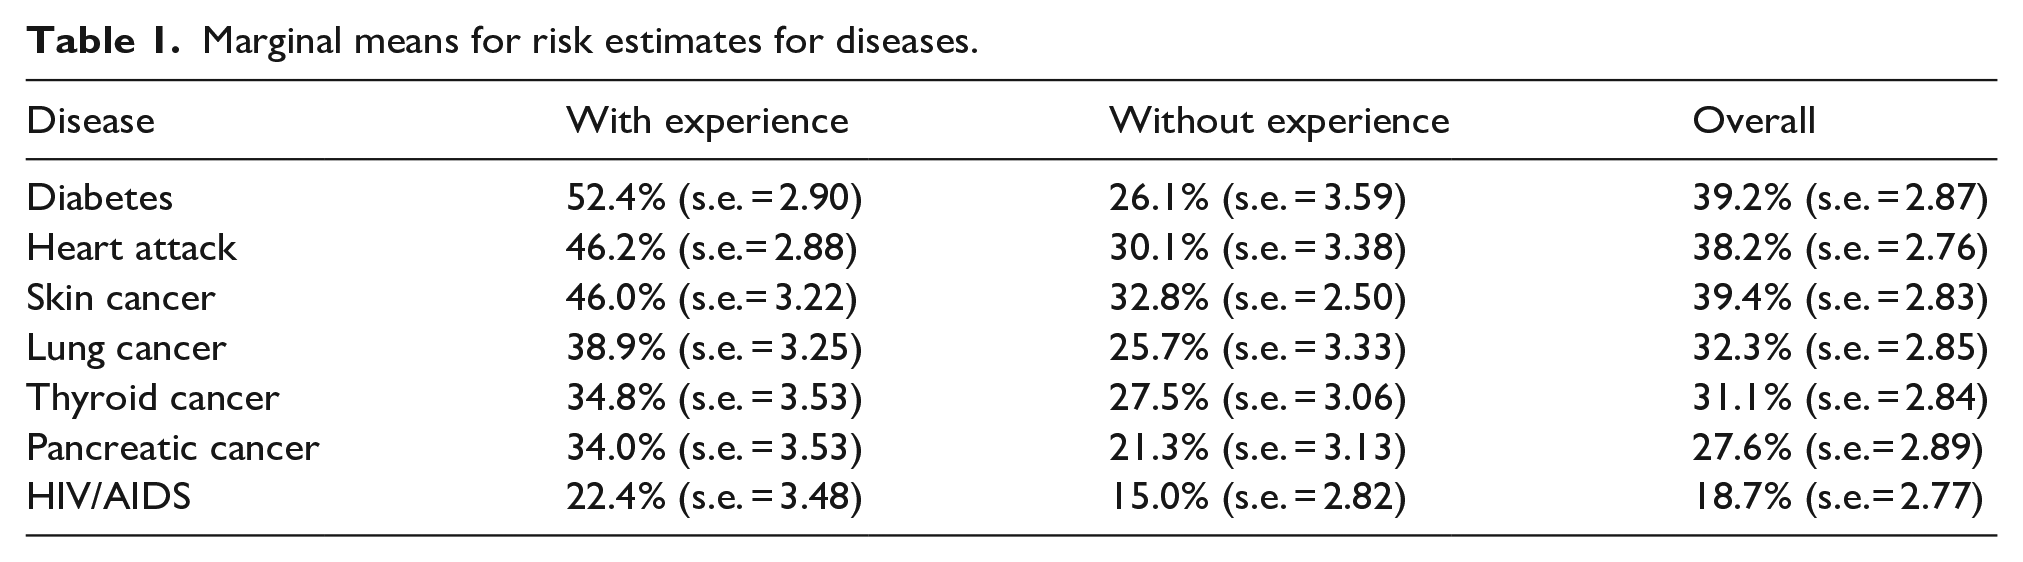
Multilevel models were also estimated to predict risk estimate with diseases and experience as fixed-effects factors and individuals as the random-effects factor, and with demographic variables (sex, race, education, income, status of health insurance, Medicare, and Medicaid), previous health behaviors (smoking, tanning, diet, exercise, and sexual behaviors), and trait anxiety as controlled covariates. Results showed that there was a significant main effect of disease: F(6, 1323.9) = 24.67, p < .001 as well as a significant main effect of experience with disease: F(1, 1552.1) = 119.20, p < .001. These two main effects were qualified by a significant interaction between the two: F(6, 1394.3) = 4.23, p < .001. Table 1 presents the marginal means of risk estimates for each disease among respondents overall, among those with and without experience of the disease.
Marginal means for risk estimates for diseases.
H1, H3, and H4 were tested with the multilevel SEM. Essentially multilevel SEM analyses involve estimating a two-group model: one group as between clusters (i.e. diseases) and the other as within clusters (i.e. diseases), with trait anxiety as a within-cluster variable (i.e. it only varies between individuals who were nested within specific disease topics). Three models were estimated, where paths were specified from the two disease appraisals (but not the two side effects appraisals) and fear to risk estimate (H4), as well as a path from experience with the disease to risk estimate (as a controlled covariate). The differences among the models were as follows: (1) In Model 1, paths were specified from (a) the disease and side effects appraisal variables, (b) experience with the disease, and (c) trait anxiety to fear (H1). (2) In Model 2, (a) paths were specified from experience with disease and trait anxiety to fear, and (b) paths were specified from fear to the four appraisal variables, which were allowed to correlate due to their conceptual proximity (H3). And (3) Model 3 has (a) all the paths in Model 2, and (b) additional paths from the four appraisals to fear (i.e. H1|H3). Because Model 1 and Model 2 were nested within Model 3,
The covariance matrix of the variables was submitted to Mplus 8.6 for multilevel SEM analyses using maximum likelihood estimation, with disease as the clustering factor. Table 2 presents the fit indices for model testing and comparisons. Results showed that Model 1 was a good fit to the data across the indices. Model 2 was clearly not a good fit to the data. Model 3 was also a good fit to the data across the indices. The difference in
Fit indices for model testing and comparisons from multilevel SEM.
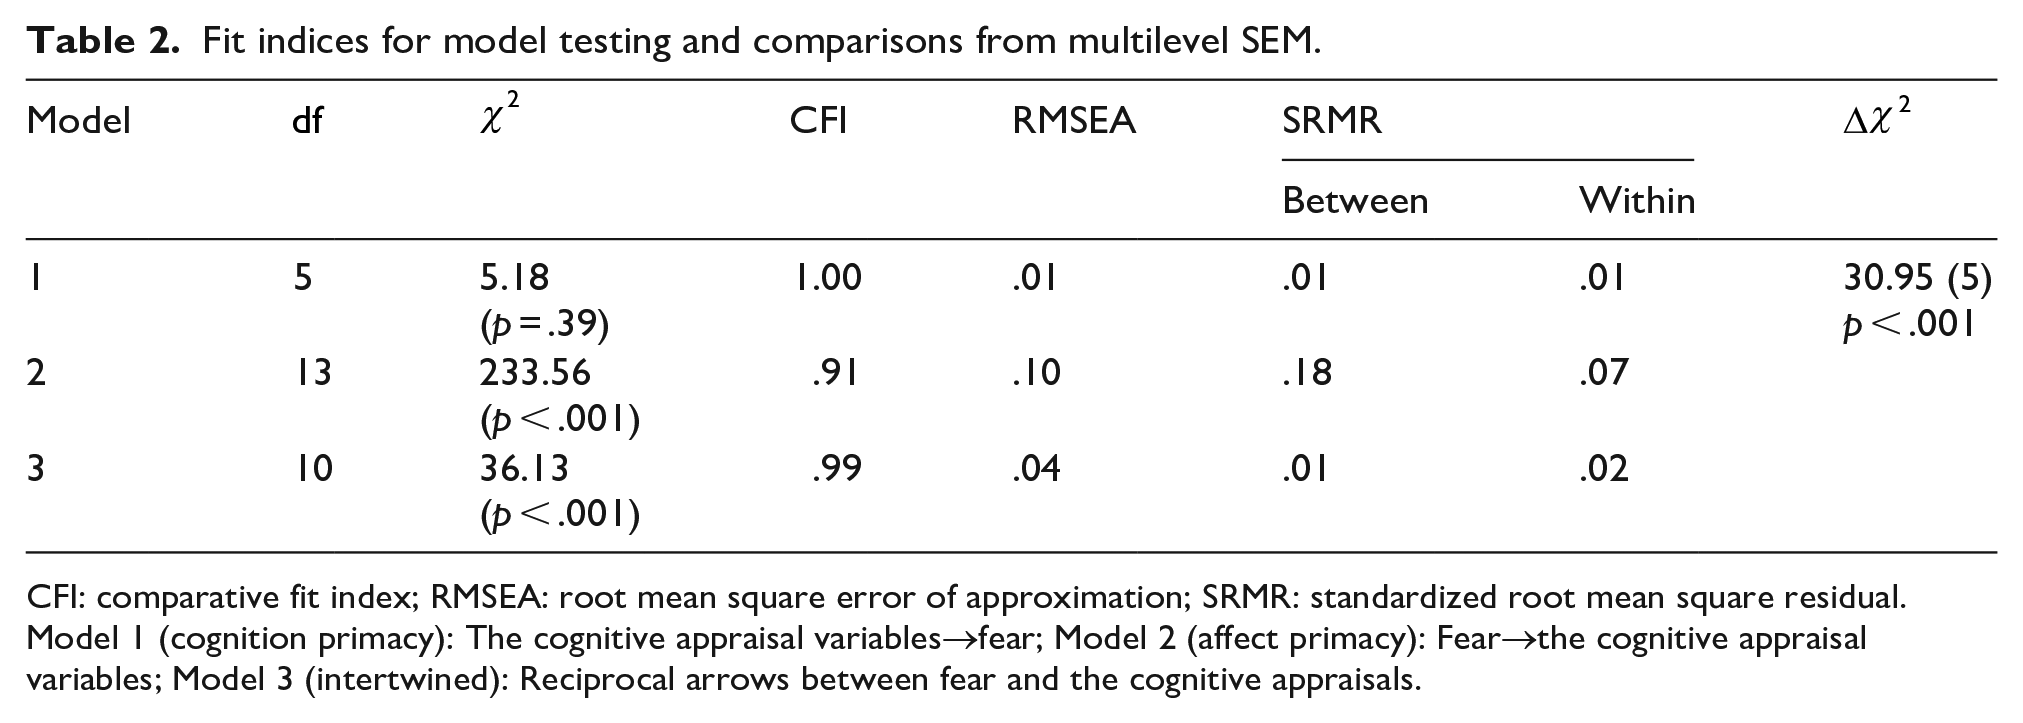
CFI: comparative fit index; RMSEA: root mean square error of approximation; SRMR: standardized root mean square residual.
Model 1 (cognition primacy): The cognitive appraisal variables→fear; Model 2 (affect primacy): Fear→the cognitive appraisal variables; Model 3 (intertwined): Reciprocal arrows between fear and the cognitive appraisals.
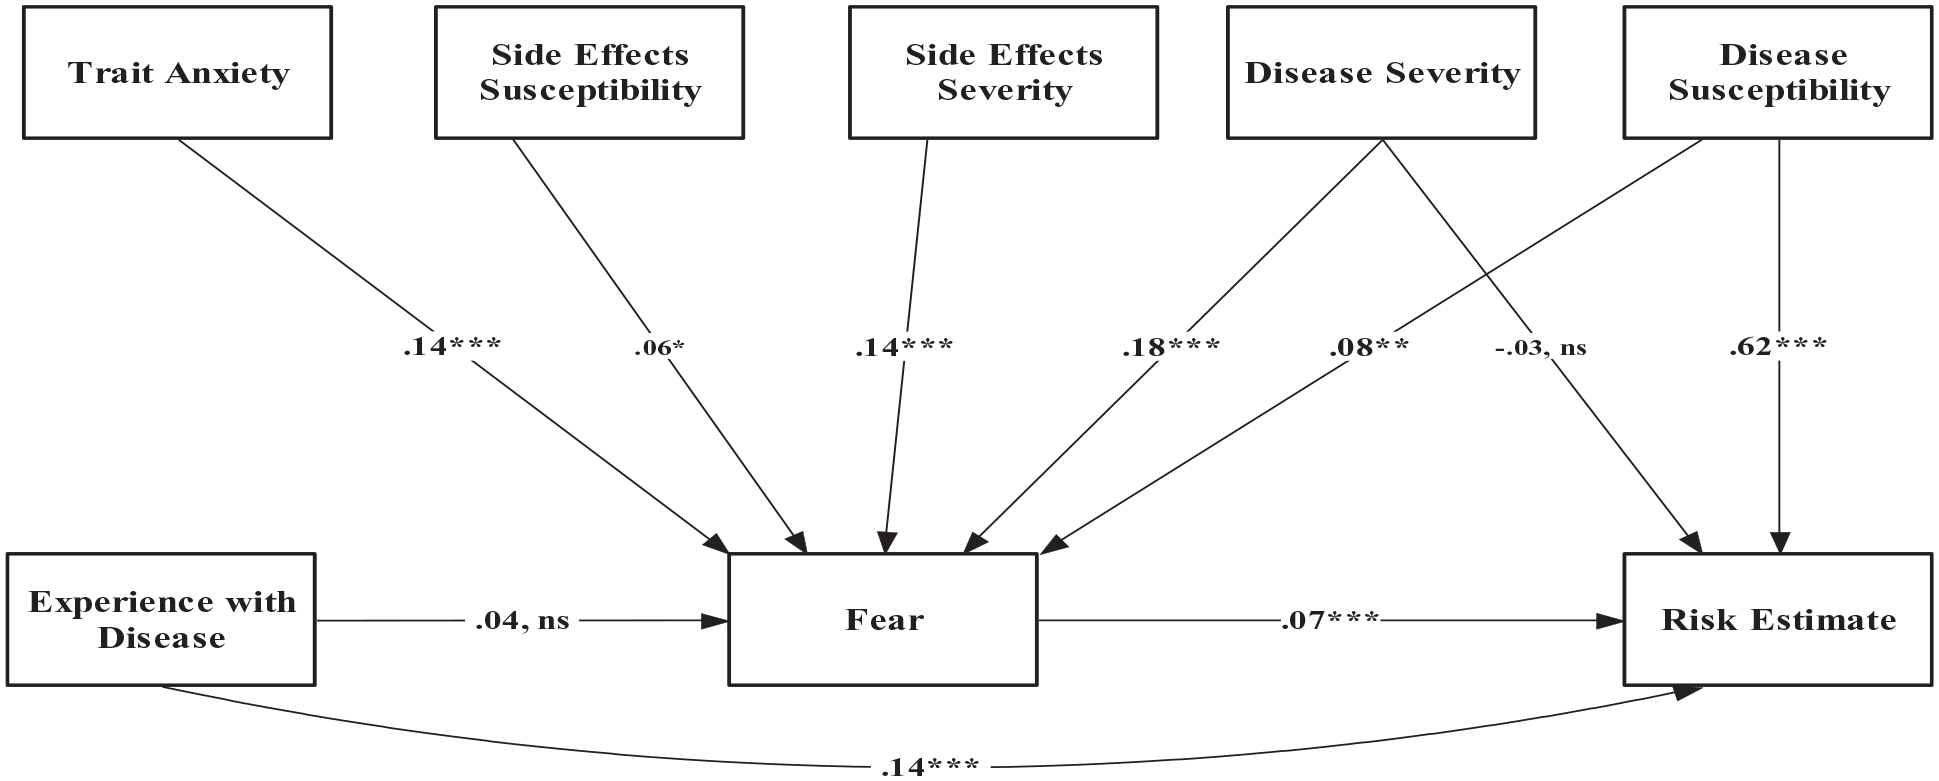
Standardized path coefficients in Model 3.
H1 predicts that threat appraisals related to diseases and side effects from treatments positively predict fear. Standardized path coefficients showed that perceived disease severity
Discussion
Given the ostensible fear of cancer at the societal and individual levels, we set out to advance the understanding of the fear of cancer, regarding its antecedents and consequences, as compared to non-cancer diseases with comparable prevalence and death rates. We also tested competing predictions concerning the mutual relationship between appraisal variables and fear, and their joint impact on disease risk estimate. Overall, individuals are more scared of cancers than of non-cancer diseases despite their comparable levels of threat to well-being. Moreover, individuals overestimate their risk of facing a cancer diagnosis to a much greater degree than they overestimate getting more common diseases such as diabetes. In addition, experience with a disease increased individuals’ fear of the disease and their estimates of vulnerability to that disease. Findings also show reciprocal causation between fear and threat appraisals, as well as main effects from both fear and perceived susceptibility on individuals’ risk estimates for diseases.
Affect-cognition relationship in the risk perception process
The impact of the four (disease and treatment side effects) threat appraisals on fear suggests that, in constructing their subjective experience of fear, people account for information on multiple aspects of the danger or threat they are facing. These multiple threat appraisals pertain to the symptoms of the disease itself and the treatment side effects. One key novel contribution of this study was simultaneously assessing the reciprocal causal relationship between the appraisal variables and fear. Although such reciprocal causal relationships have been alluded to (e.g. PMT; Rogers & Prentice-Dunn, 1997), they have not been rigorously tested in empirical studies. The meta-analytic evidence has been primarily based on data that only assessed the one-directional relationship (i.e. appraisals → fear; e.g. Tannenbaum et al., 2015), or tested each direction one at a time (e.g. Witte & Allen, 2000). The intertwined model with reciprocal paths between cognitive appraisals and fear was a significantly worse fit than the cognition primacy model with only paths from appraisals to fear. The absolute model fit for Model 3; however, suggests the reciprocal paths might be plausible, except that the evidence in this study was clearly in favor of Model 1. It should be acknowledged that the results in this study might have been due to sampling error and better evidence for the relative advantage of Model 1 over Model 3 should come from replications in future studies. The possibility that Model 3 might be a better alternative to Model 1 could not be ruled out solely based on this study. On the other hand, Model 3 suggested that the extant parameter estimates for the relationship between appraisal variable and fear, and their respective impact on risk estimates might have been biased, if the reciprocal causations were not assessed simultaneously in data analyses.
Experience with a disease through either one’s prior diagnosis or the diagnosis of someone in one’s social network was positively associated with fear of and estimates of one’s own risk for the disease. This finding supports the relational core theme of fear presented in Lazarus (1991), which proposes that the proximity and imminence of a threat or danger are inherent to the experience of fear and make for more intense feelings of fear. This finding is further in line with the concept of psychological distance in the construal-level theory (Trope, 2012), which is informed by the social context of the person. In this study, this social context includes the knowledge of a cancer diagnosis and presumably the conversations that will happen surrounding cancer when someone in one’s social network is affected.
The greater fear of cancer compared to other diseases illustrates boundary conditions of threat models of emotions but is compatible with constructivist theories of emotions such as Barrett’s (2017) theory of constructed emotion. Specifically, although threat appraisals of diseases and side effects are influential to individuals’ fear, they cannot fully account for this experience. Instead, there are other aspects of diseases such as the word cancer that contribute to individuals’ experience of fear—such that the linguistic construction of cancers or the concepts that people associate with it given how it’s talked about by the media, government, and society at large. The reciprocal causation among appraisal variable fear detected in this study, however, suggests that how cancers (vs non-cancer diseases) are talked about could have been caused by fear. These findings thus provide insight into the processes, including public discourse and everyday talk, that influence the social and subjective construction of fear and how they can at times override more objective assessments such as the actual likelihood of cancer. While the treatment and prevention of excessive fear of cancer, especially at the individual level, might have to rely on cognitive behavioral therapy and counseling, the findings from this study suggest that there might be utility in communicating to individuals that one’s fear of cancer level might be “artificially” elevated simply because of the word “cancer,” and that the fatality rate and prevalence rate of cancers might not be that scary, given the advances in medical science.
Fear and risk over-estimation
Descriptive statistics revealed a pattern of overestimating one’s own risk for diseases (Table 1). Individuals estimated there was on average a 39.4%, 32.3%, 31.1%, and 27.6% chance they might get skin, lung, thyroid, and pancreatic cancer. In truth, the respective probability of someone getting these cancers from birth to death is 2.5%–3.7%, 5.9%–6.7%, 0.6%–1.8%, and about 1% (Siegel et al., 2019). In other words, the overestimates were 8 to 20 times as much as the actual risk levels. This overestimation was prevalent for non-cancer diseases as well and diabetes (Gregg et al., 2014). However, the degree of overestimation was much higher for cancers than non-cancers: A factor of no more than 2 in the overestimation of non-cancer diseases, as compared to the factor of 8 to 20 found for cancers. A cognitive explanation for such a pattern lies in pessimistic bias—a cognitive tendency where individuals overestimate their own likelihood of experiencing negative or risk-related events that are relatively rare or uncommon (e.g. Kruger & Burrus, 2004). An affective explanation suggests the impact of fear on disease and side effects threat appraisals might have emerged from media coverage and social constructions, inflating people’s assessments of their risk of cancers (e.g. Bohner et al., 1992; Leibovich et al., 2016). In the case of this study, fear of cancer and non-cancer diseases was shown to cause an upward distortion of people’s risk estimates.
The findings also provided evidence that experience with a disease through the diagnosis of self and known others contributed to the fear. The impact of diagnoses of oneself and kin is supported by research (e.g. Matakidou et al., 2005) and justifiable by the role that genetics and common exposures play in the development of (most of) these diseases. However, in the case of friends, colleagues, and acquaintances, the impact of biased risk estimates due to increased psychological proximity of the disease is more plausible than that of common environmental exposures and lifestyle choices such as cigarette smoking, tanning, diet, and exercise. This lends support to the conceptualization of the relational core theme of fear (Lazarus, 1991), which emphasizes the role of threat or danger imminence in the formation and experience of fear, as well as to the construal-level theory (Barrett, 2017), which claims that proximity of objects or events leads to the concretization of concepts and plans.
Strengths and limitations
The findings reported in this study have to be interpreted with its strengths and limitations in mind. The study had notable strengths. First, four cancers and three non-cancer diseases were used as the substance context. The factor of disease was specified as a random-effects factor throughout the data analyses in this study. This means these seven diseases were considered as a sample from the population of diseases (cancer and non-cancer), just as the participants were a sample from the (human) population. Second, the sample was a national sample from the general public that matched the census data in key demographic variables. The sample size also yielded strong statistical power for both parameter estimation and SEM model testing. Third, the interdependence structure in the data was addressed properly with the multilevel modeling technique, which provided more accurate estimates of standard errors, hence more accurate significance testing. Combined, these features enhanced both internal validity and external validity.
The study also had a few limitations. First, data collection took place online. Although measures were taken (e.g. assessing participation duration, planting attention checkers, and examining straight-lining patterns) to ensure data quality, the researchers did not have much control over or any knowledge of the contexts or environments where the participants were responding to the questions. For example, they could be doing some online shopping while responding to the questions, or they might be distracted by the kids in the house. There is a fundamental tension or trade-off between the convenience of online data collection versus the researcher’s control over and knowledge of the data collection process. Second, only four cancers were considered, and the non-cancer diseases did not concern the same health issues (e.g. the skin, the lungs, the pancreas, and the thyroid). Given that they are non-fictional diseases, there were also not experimental manipulations per se in terms of prevalence and death rate. Hence, there might be the issue of comparing apples and oranges. Future studies that examine more cancer types and more comparison diseases should be able to investigate the potentially unique nature of carcinophobia. Third, there were not enough individuals whose lives were already affected by cancer in our sample. A higher proportion of this group might allow researchers to gain a further understanding of the fear of cancer. Fourth, the presentation of information describing the diseases, the treatments, and the side effects of the treatments might in and of itself have influenced estimates of risk attached to the specific disease. Sawant and Sansgiry (2018) showed, for instance, that communication format is influential to individuals’ risk assessments of medication side effects. Although the decision to provide these descriptors was deliberate in hopes to equalize knowledge about the diseases under consideration, and although risk-related information was excluded from the descriptions, it cannot be ruled out that the presentation of descriptors on illnesses and the side effects of the treatment might have altered risk perceptions by individuals based on the concept/linguistic networks that individuals and society have for the symptoms and side effects described. Future research should test and control for the possibility of a methodological artifact introduced through these descriptions.