
Abstract
People report receiving ads on their mobile device that are seemingly related to previous offline conversations (i.e., conversation-related advertising). They may think that this is because their electronic devices are eavesdropping (i.e., e-eavesdropping). To gain insights into the scope and characteristics of conversation-related advertising and e-eavesdropping beliefs, we conducted a survey in the United States (n = 300), the Netherlands (n = 293), and Poland (n = 293). These countries were chosen based on their differences in privacy regulations and history with state surveillance. We find that belief in conversation-related advertising is a widespread cross-country phenomenon, which is higher in the United States compared with European countries. In addition, between half and two-thirds of respondents believe e-eavesdropping is a likely explanation for it. We find that social media is a main contributing factor through which people hear about and most often see conversation-related advertising. Moreover, in response to such advertising, respondents experience more negative than positive affect. The results show that this is a prevalent and timely phenomenon that warrants more research. This carries implications for the (social) media industry and regulators, as it highlights the importance of transparency and (insufficient) individual understanding of data collection and processing.
With the development of new advertising and marketing technologies and the reach of social media, companies use a variety of strategies to target consumers with personalized communication. Sometimes people report receiving an ad on their mobile device that is seemingly related to a previous offline conversation (Frick et al., 2021), which we call conversation-related advertising. Media users seem to believe that their electronic devices (e.g., smartphones, smart speakers) are listening in on offline conversations, which we call electronic eavesdropping (i.e., e-eavesdropping). Although companies state that they are not engaging in such practices (Hunter, 2021; Meta, 2016), it is technically possible to do so (Kröger & Raschke, 2019). Regardless of whether e-eavesdropping is happening, it seems to be a common concern among media users (Frick et al., 2021; Vitak et al., 2023). Moreover, these perceptions of being surveilled can have unintended ethical side effects and pose a threat to an individual’s privacy (McDonald & Cranor, 2010), autonomy (Büchi et al., 2022), and agency (Reviglio & Agosti, 2020). To get a better understanding of conversation-related advertising, we aim to systematically map the phenomenon in comparative perspective by conducting a cross-country survey in the United States, one Western (i.e., the Netherlands), and one Eastern European country (i.e., Poland). We chose these countries based on their history with state surveillance and regulatory differences related to privacy in Europe and the United States. Furthermore, Eastern European countries have undergone a transition from states with extensive state surveillance practices and limited guarantees of human rights to states embracing the European human-rights standards and enshrining a more robust body of human-rights guarantees in their constitutional orders (Koops et al., 2017). Comparative analysis will give us better understanding if legal frameworks and historical backgrounds interfere with individual privacy perceptions. To our knowledge, this will be the first study to map conversation-related advertising in the United States and compare the results with a Western and an Eastern European country. It contributes to our understanding of comparative research in privacy issues (e.g., perceived surveillance) by examining the phenomenon of conversation-related advertising and e-eavesdropping beliefs in three countries. It advances our theoretical understanding of the omnipresence of surveillance and privacy issues in the media landscape. Furthermore, gaining insights on conversation-related advertising and e-eavesdropping perceptions is vital to combat consumers’ (potential) false beliefs regarding digital advertising, which could have unintended ethical side effects for media users and be detrimental to the industry (Strycharz & Segijn, 2022). The findings of this research highlight the role of transparency regulations and the need for literacy programs. They also show the potential for social media platforms, public actors, and policymakers to correct false beliefs and contribute to the formation of accurate ones.
Theoretical Framework
Dataveillance Effects in Advertising Landscape Framework
The current work is guided by the Dataveillance Effects in Advertising Landscape (DEAL) framework (Strycharz & Segijn, 2022), which explains the relationship between perceptions of surveillance, surveillance beliefs, and how people respond to perceived instances of surveillance. The starting point of the DEAL framework is a surveillance episode, which is a “directly observable instance of data collection” (Strycharz & Segijn, 2022, p. 576). For example, a personalized ad in which media users are targeted for a product or service that matches their online behaviors, interests, or communication styles could be a surveillance episode when the media user believes their online behavior or other personal data have been tracked and processed. Similarly, an advertisement for a product or service that someone recently discussed in an offline conversation (i.e., conversation-related advertising) could be a surveillance episode when someone believes their devices are listening to offline conversations. A surveillance episode does not need to involve actual surveillance but classifies as such when a person believes it involves surveillance. Thus, it is possible that someone believes an ad is based on surveillance or online tracking practices but is not or vice versa.
Whether an event qualifies as a surveillance episode therefore depends on an individual’s surveillance beliefs, which are “the ideas an individual holds regarding the extent and aim of surveillance” (Strycharz & Segijn, 2022, p. 576). An example is that some people believe that their phones are listening in on offline conversations (Frick et al., 2021), which we call e-eavesdropping. In a first explorative survey with a convenience sample of adult internet users, Frick et al. (2021) found that 74.4% of their respondents reported being aware of smart devices listening and approximately half of them said they received conversation-related advertising due to e-eavesdropping. Although companies deny using microphones for advertising purposes without consent (Hunter, 2021; Meta, 2016), it is technically possible to do so (Kröger & Raschke, 2019). Given that perceptions of surveillance could affect people’s responses to such advertising (Strycharz & Segijn, 2022), we are interested in perceptions of e-eavesdropping rather than actual surveillance.
People develop surveillance beliefs over time and through different sources. Experience-driven belief formation could happen through one’s own experiences (i.e., firsthand experience), such as receiving ads that are seemingly related to offline conversations, or other people’s (e.g., partner, friend, family member) experiences that one hears about (i.e., secondhand experiences). Belief formation based on experiences can be explained by folk theories. People use folk theories to understand phenomena in everyday life, such as how algorithmic profiling or algorithms in apps work (Büchi et al., 2021; Huang et al., 2022). Folk theories are not necessarily based on facts but can be speculative, based on first- or secondhand experiences (Rip, 2006). Furthermore, surveillance beliefs could also be formed based on information that is provided through the media or through talks (Strycharz & Segijn, 2022). To get an understanding of the scope of conversation-related advertising, we ask the following research questions:
Beyond mapping the scope of the phenomenon, we aim to gain a more detailed understanding of conversation-related advertising experiences by mapping the details of people’s experiences. For example, we aim to gain more insights into first- and secondhand experiences by identifying who people had an offline conversation with that the ad was related to, what the time between the offline conversation and the ad was, and what the proximity of the device was during the conversation. Similarly, we are interested in more details on the type of media (e.g., social media, podcasts/radio) and talks (e.g., class, workshop) where people read and hear about this phenomenon, what kind of information is provided in the media or talks, and who is organizing these talks (e.g., government, organizations, schools, or universities). Therefore, we ask:
Finally, we are interested in how such experiences make people feel. Previous research on data-driven advertising has shown that this kind of advertising can lead to both positive (e.g., interest, excitement) and negative (e.g., creepy, disturbing) responses (McDonald & Cranor, 2010; Segijn & van Ooijen, 2022). Similarly, conversation-related advertising may lead to positive affective responses, such as interest or excitement, when this form of communication offers personalized personal benefits, such as exclusive promotions, samples, or discounts (Strycharz et al., 2019). However, conversation-related advertising may also result in negative affective responses. According to privacy management theory (Petronio, 2002), people navigate the management of private information through the concealing of disclosure of personal information. They feel ownership over their personal data and the right to control that information (e.g., boundary regulation) (Petronio, 2002, 2010). Unwanted access to personal data is seen as a privacy violation (Masur & Trepte, 2021) or privacy turbulence (Petronio, 2010). Translating that into the current context, when people notice a conversation-related ad—whether actually based on their offline conversation or not—it makes them aware of a possible unwanted disclosure and hence violation of their privacy rules. Consequently, such an ad raises relational tension between the company and the consumer. To this end, we ask:
Cross-Country Differences
As privacy-related perceptions and behaviors (Masur et al., 2021; Nissenbaum, 2004) as well as surveillance effects (Strycharz & Segijn, 2022) are contextual, the current study compares conversation-related advertising experiences across three countries, namely the United States, the Netherlands, and Poland. Comparing this new phenomenon in different countries allows us to verify its universality and its extent (Livingstone, 2003) taking into account that it may also be due to social, cultural, and geographical factors (Wood, 2009). The choice of countries is driven by political differences in terms of privacy regulations and history as well as the levels of surveillance associated with each country (see Masur et al., 2021 for a framework). These differences could suggest different contextual norms (Nissenbaum, 2004).
First, contextual norms can be expressed in laws and regulations as well as privacy policies (Nissenbaum, 2004). The amount of protection offered by the law differs substantially between the United States and the Netherlands and Poland as members of the European Union (Tushnet & Goldman, 2020). The General Data Protection Regulation (GDPR), introduced to unify privacy laws across the European Union, aims to set high standards for the collection and processing of personal data online (Reding, 2011). More specifically, the GDPR impacts how data collection on the web is designed, what data are collected, and how users are informed about these practices (Utz et al., 2019). A key goal of this regulation is to strengthen individual awareness and control in the face of online data collection (Tushnet & Goldman, 2020). In contrast, privacy regulations in the United States are more fragmented (e.g., the Children’s Online Privacy Protection Act focusing on online data collection of children under 13 years old), sector-specific (e.g., the Health Insurance Portability and Accountability Act focused on the medical sector), and an overarching framework is missing. Overall, the existing regulations in the United States focus less on individual awareness and empowerment (except for the California Consumer Privacy Act) and give users less control tools over data collection processes in comparison with the GDPR, relying fully on privacy self-management (Tushnet & Goldman, 2020). Researchers argue that the approach to privacy in the United States fails to secure either desired or desirable levels of privacy (Acquisti et al., 2020).
Second, we may expect differences in contextual norms among the European countries depending on their history of state surveillance. The Netherlands is one of the founding countries of the European Union, while Poland joined more recently in 2004, after a transition from a communist to a democratic state. This transition also meant a shift from a state with extensive governmental surveillance practices and limited guarantees of human rights to a state that embraces the European human-rights standards and has integrated human-rights guarantees in their constitutional orders (Koops et al., 2017). Poland is considered a country with a communist legacy (i.e., cultural effects on peoples’ attitudes that remain from the communist times; Wittenberg, 2015). The historical importance of surveillance including widespread abuse of surveillance information and distrust in public institutions suggest that individuals in Poland have different perceptions of surveillance as most people can be expected to have a relatively clear picture of what surveillance entails and what risks it poses (Svenonius & Björklund, 2018).
Given the cross-country difference listed above, we ask:
Method
To map conversation-related advertising experiences in the United States, the Netherlands, and Poland, we distributed an institutional review board-approved and preregistered 1 online survey in Spring 2023 in the first language of each country (i.e., English, Dutch, Polish). The surveys were translated from the English survey by native speakers of Dutch or Polish with a good command of English. In addition, the translations were checked by a second and third native speaker independently.
Sample
We recruited respondents through online survey panels (i.e., Prolific, PanelClix, SoftArchitext) and requested a quota sampling based on the country’s demographics. Every respondent 18 years or older, living in that country, and using a smartphone on a daily basis could participate. In total, 301 U.S. respondents, 306 Dutch respondents, and 305 Polish respondents completed the survey. Some respondents were removed because they indicated to not use their data (United States n = 1, the Netherlands n = 13, Poland n = 12), resulting in a final sample of 300 U.S. respondents, 293 Dutch respondents, and 293 Polish respondents (Table A1). 2
Procedure and Variables
Respondents self-selected to be part of the study. After obtaining informed consent, they could proceed to the survey. Otherwise, the survey was terminated (United States n = 0, the Netherlands n = 1, Poland n = 0). We started the survey with screening questions to make sure the respondents met the inclusion criteria and were not bots.
First, the respondents were asked to report on their conversation-related advertising experiences. We explained to the respondents “Coincidental or not, sometimes people receive an online advertisement on one of their devices (e.g., smartphone, tablet) for a brand or product that they recently talked about with someone else in an offline conversation.” We asked whether they (1) have experienced such a situation (firsthand experience), (2) know someone else who experienced such a situation (secondhand experience), (3) have read or heard about such a situation being described in the media, or (4) attended a presentation, lecture, class, workshop, or other talk discussing such a situation. For all four contexts, the answer options were “yes,” “no,” and “maybe/not sure.” When respondents indicated “yes” or “maybe/not sure,” they were asked how often this happened to them in the last year, with the answer options being “once,” “a couple of times (2–3 instances),” “several times (4–5 times),” “regularly (more than 5 times)” “I do not know how often but it did happen,” or “it did not happen this year.” For each experience they answered “yes,” respondents were also asked to provide more details on the experience. This means that respondents were asked questions on zero to four of the different contexts (0 = 21.7%, 1 = 12.5%, 2 = 33.5%, 3 = 24.3%, 4 = 7.9%).
To measure e-eavesdropping, respondents who indicated having firsthand experience with conversation-related advertising were asked “Do you think the ad appeared on the device because of what was discussed during the offline conversation?” The answer options were “yes,” “no,” and “maybe/not sure.” Respondents who indicated to not have had such an ad were asked a similar question about a hypothetical scenario. 1
For both the first- and secondhand experiences, we asked respondents to think about one time that this happened to them or that they heard about it and answer all questions about this instance. The first question for both first- and secondhand experiences was how (hearing about) this experience made them feel. We measured this before reporting more details on the experience to avoid priming positive or negative thoughts on the experience. We used a measure of affect based on Edell and Burke’s (1987) study, but we adjusted the categories based on results of affect found in relation to other data-driven advertising situations (Segijn & van Ooijen, 2022). We balanced the categories with five positive affect categories (i.e., pleased, interested, amused, excited, curious) and five negative affect categories (i.e., creeped out, annoyed, disturbed, angry, sad) in random order on a 7-point scale (1 = strongly disagree, 7 = strongly agree). For the analyses, we used both the individual affect categories and a combined score for positive affect (firsthand Cronbach’s alpha = .81, M = 3.56, SD = 1.18; secondhand Cronbach’s alpha = .81, M = 3.48, SD = 1.20) 3 and negative affect (firsthand Cronbach’s alpha = .84, M = 4.04, SD = 1.32; secondhand Cronbach’s alpha = .87, M = 3.86, SD = 1.43). 3
Next, the respondents were asked to provide more details on the conversation-related advertising experience. The questions and answer categories are presented in Table A32 and Tables A5 to A7.1,2 The location of the ad (e.g., Facebook, Instagram, news site) was an open-ended question. Each dataset was coded by two independent coders who are native speakers of the language of the survey. All coders used the same codebook to code either 100% or approximately 25% of the sample indicating for each category whether the category applied (1) or not (0). In addition, we coded 99 when the answer was missing or was gibberish. Krippendorff’s alpha showed good to excellent intercoder reliability for all categories across all three samples (Table A2). 2 Finally, respondents were asked to report individual difference measures and demographics, before thanking them for participating in the study, and giving them a monetary incentive.
Results
Research Question 1: Conversation-Related Advertising Prevalence and Frequency
In all three countries, most respondents reported having received an ad that is seemingly related to a previous offline conversation. The highest numbers were reported in the United States (77.7%, n = 233), followed by the Netherlands (66.5%, n = 195), and finally Poland (52.6%, n = 154). Chi-square tests comparing respondents that indicated yes or no 4 showed that the differences were statistically significant, χ2(2) = 31.806, p < .001. A similar pattern was observed for secondhand experiences (United States = 77.0%, the Netherlands = 62.8%, Poland = 50.5%), χ2(2) = 22.254, p < .001. In addition, about half of the respondents from the United States and the Netherlands heard about conversation-related advertising through the media (United States = 52.0%, the Netherlands = 42.0%), whereas a quarter of the Polish respondents reported hearing about it through the media (25.6%), χ2(2) = 34.624, p < .001. Finally, a small group of respondents heard about the phenomenon through talks, which included less respondents in the United States than in the European countries (United States = 6.0%, the Netherlands = 17.7%, Poland = 12.3%), χ2(2) = 19.125, p < .001. This indicates that the prevalence of the experiences may be country dependent.
Most respondents who had indicated that this happened to them report that this happened at least once in the past 365 days (Figure A1). 2 However, most respondents experienced this more than once (firsthand experience = 74.0%; secondhand experience = 68.7%; media = 50.2%; talk = 44.7%). No significant differences in frequency were found across the three countries (firsthand experience F(2,577) = 1.414, p = 2.44; secondhand experience F(2,542) = 1.869, p = .155; media F(2,351) = 1.036, p = .356; talk F(2,110) = 0.822, p = .442).
Research Question 2: e-Eavesdropping Belief
In all three countries, more than half of the respondents (United States 54.7%; the Netherlands 51.9%; Poland 51.1%) indicated that they believed a conversation-related ad would appear on their device because of a previous offline conversation (Figure 1). From the respondents who indicated having received a conversation-related ad, 61.4% (United States), 59.0% (the Netherlands), and 66.2% (Poland) believed it was because of a previous offline conversation. These respondents are significantly more likely to believe in e-eavesdropping than respondents without firsthand experiences with conversation-related advertising (United States χ2(2) = 35.804, p < .001; the Netherlands χ2(2) = 23.924, p < .001; Poland χ2(2) = 45.311, p < .001). No significant differences for e-eavesdropping beliefs were observed between the three countries for respondents with firsthand experiences (χ2(4) = 2.266, p = .687) or respondents without firsthand experiences (χ2(4) = 2.965, p = .564).

e-Eavesdropping beliefs for respondents with and without firsthand experience across countries.
Research Question 3: Mapping the Experience
All findings about the respondents’ conversation-related advertising experiences can be found in Tables A3 to A7. 2 Most of the patterns were similar across the countries and therefore we will mostly discuss the overall results and highlight observed differences.
Firsthand Experiences
Most respondents reported on a relatively recent experience that happened in the last week (12.2%), in the last month (22.4%), or in the last 3 months (33.6%). About a quarter of the respondents reported on an event that happened this year (21.3%) or longer ago (1–2 years, 4.3%). Finally, 4.3% of the respondents reported that they do not know how long ago the experience happened (Table A3). 2 Most experiences involved an offline conversation with a partner/spouse (33.8%), a friend (28.0%), or an (extended) family member (19.2%; Table 1). In general, it included mostly conversation partners with whom respondents had frequent conversation in general, mostly multiple times a day (39.8%), daily (17.7%), multiple times a week (15.6%), or weekly (12.5%).
Firsthand Experience Results Across the Three Countries.
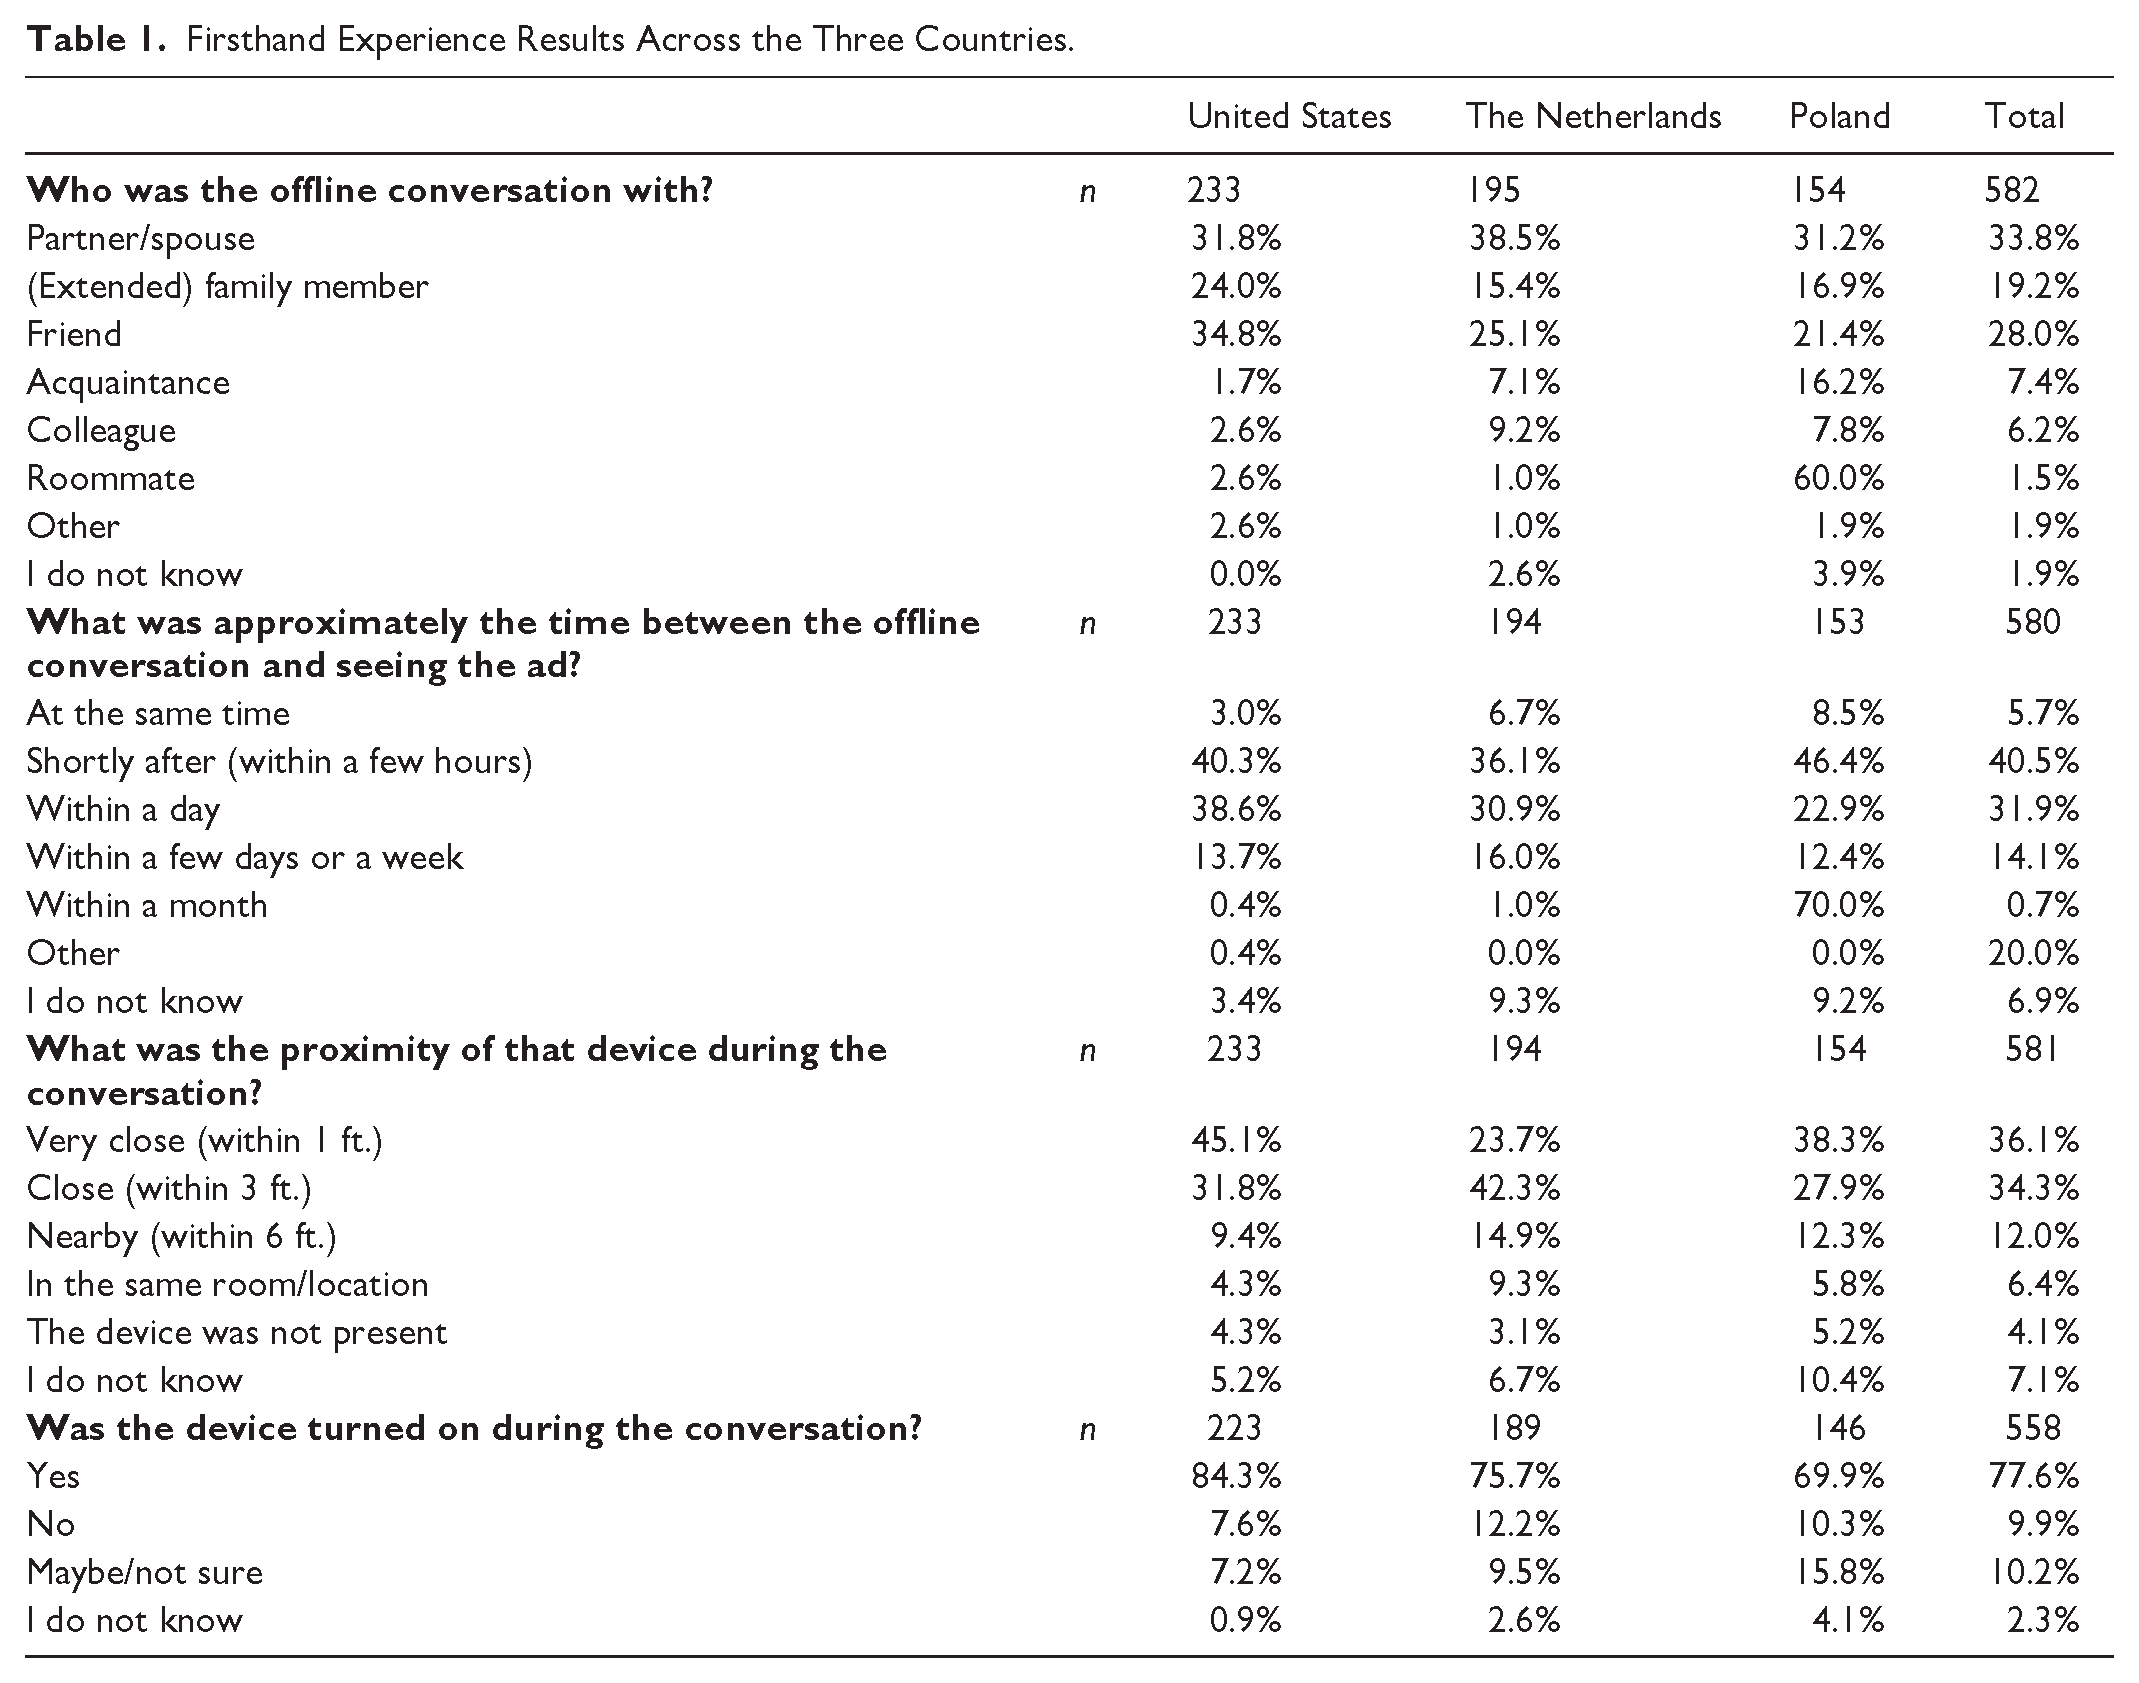
The timing between the conversation and first noticing the ad was mostly within a few hours (40.5%) or within a day (31.9%) after the conversation (Table 1). A smaller percentage reported seeing the ad within a few days or a week after the conversation (14.1%) or during the conversation itself (5.7%). The ads were mostly noticed on social media (Table A4), 2 specifically on Facebook (United States 36.8%; the Netherlands 29.7%; Poland 34.7%), Instagram (United States 15.2%; the Netherlands 13.7%; Poland 4.9%), and YouTube (United States 6.9%; the Netherlands 2.3%; Poland 3.5%). Conversation-related ads were also seen on news (United States 2.6%; the Netherlands 5.1%; Poland 6.9%) and other websites (United States 11.7%; the Netherlands 4.0%; Poland 4.9%).
Most respondents reported that the ad was displayed on a smartphone (79.8%) followed by a laptop (10.3%; Table A3). 2 Most respondents reported an instance where this device was within 1 ft. (36.1%) or 3 ft. (34.3%) during the conversation (Table 1). Among those with the device in the same room/location, the majority had their device turned on (77.6%; Table 1). In addition, from those who had their device turned on, 36.9% reported their device was actively used during the offline conversation. Most respondents who reported that the device was actively used did not use it related to the ad (56.0%), which only a few respondents reported doing (8.0%; Table A3). 2
Secondhand Experiences
Most respondents reported on a secondhand experience that they have heard through someone relatively close to them (Table A5), 2 such as a friend (32.3%), partner/spouse (26.6%), or (extended) family member (20.4%). In addition, Polish respondents also reported relatively often about an experience from an acquaintance (20.9%). These other people had offline conversations with their friend (27.4%), their partner/spouse (4.2%), or an (extended) family member (13.5%). However, many times the respondents also reported not knowing who the conversation was with (19.0%). Overall, these secondhand experiences mostly happened within this year (28.6%), in the last 3 months (26.6%), or in the last month (17.4%).
Media Experiences
Most of the respondents (60.9%) who heard about conversation-related advertising experiences through the media (n = 345) heard about it through social media (Table A6), 2 especially in the United States (71.8%). In addition, respondents heard about it through news media (28.7%), other online sites (23.2%), or radio/podcasts (10.7%). Dutch respondents also reported relatively often (17.9%) that they heard about this in a TV/movie (non-fiction). Most information related to the phenomenon in the media was about an experience by one or more people (42.7%) or a description of the phenomenon (42.1%). When we asked when the most recent time was that they read or heard about it, most respondents reported this year (29.1%) or the last 3 months (23.4%).
Talk Experiences
The respondents who attended a talk in which the phenomenon was mentioned or discussed (n = 106, Table A7) 2 reported that this mostly involved a lecture, class, or course (38.7%), presentation (28.3%), or workshop (18.9%). The latter was more common in the European countries (United States 0.0%, the Netherlands 23.1%, Poland 22.2%). Overall, these talks were mostly organized or given by schools (24.5%) or universities (23.6%), followed by the government (17.0%), commercial organizations (16%), and non-profit organizations (12.3%). In these talks, an explanation (28.3%) or a description (24.5%) of the phenomenon was provided. In addition, technical information was provided on the workings (20.8%). When we asked about the time of the most recent talk, most respondents reported this year (26.1%), the last 3 months (21.7%), or the last month (20.8%).
Research Question 4: How Did This Make Them Feel?
Overall, for firsthand experiences, respondents felt more negative affect (M = 4.04, SD = 1.32) than positive affect (M = 3.56, SD = 1.18), F(1,576) = 30.889, p < .001, η 2 = .051. A similar pattern was found for secondhand experiences (negative affect M = 3.86, SD = 1.43; positive affect M = 3.48, SD = 1.20), F(1,560) = 19.521, p < .001, η 2 = .034. Both patterns were found for all three countries (Figure 2), except for the secondhand experience in Poland (p = .146).
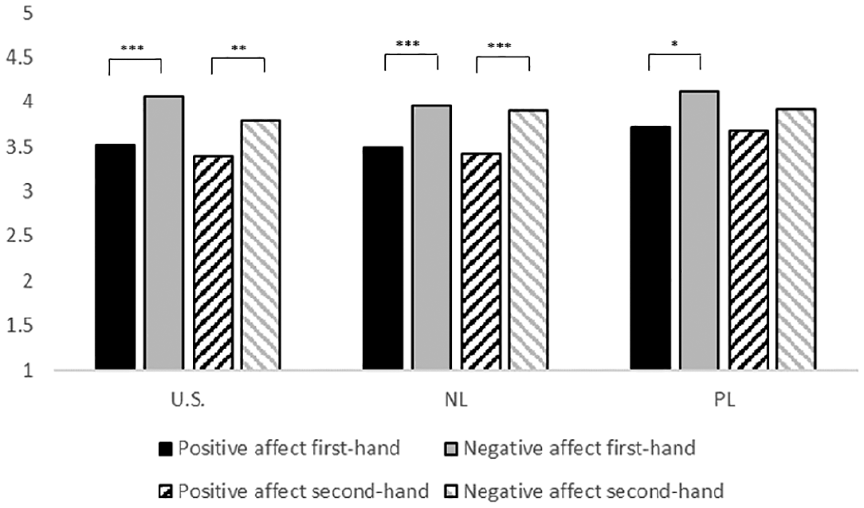
Positive and negative affect for first- and secondhand experiences.
Overall, respondents felt mostly creeped out (M = 4.65, SD = 1.73), disturbed (M = 4.50, SD = 1.69), and curious (M = 4.45, SD = 1.57) when this happened to themselves (Figure 3a). A similar pattern was found for secondhand experiences (Figure 3b). A notable difference between the countries is that U.S. respondents were more creeped out, curious, and less angry, sad, or excited compared with the two European countries. This applied to both first- and secondhand experiences. Polish respondents were the most pleased.

Results per affect category across countries for (a) firsthand experiences and (b) for secondhand experiences.
In addition, we found a significant interaction in all three countries between affect and whether respondents believed that they received the conversation-related ad because of their offline conversation (United States F(1,173) = 17.66, p < .001, η 2 = .093; the Netherlands F(1,143) = 9.08, p = .003, η 2 = 0.60; Poland F(1,117) = 4.13, p = .044, η 2 = 0.34; Figure 4). 5 Respondents who believed they received the ad because of the previous offline conversation experienced more negative affect (United States M = 4.43, SD = 1.22; the Netherlands M = 4.07, SD = 1.35; Poland M = 4.29, SD = 1.31) than positive affect (United States M = 3.38, SD = 1.17, p < .001; the Netherlands M = 3.50, SD = 1.26, p < .001; Poland M = 3.59, SD = 1.20, p = .001). In addition, these respondents experienced more negative affect than respondents who did not believe that (United States M = 3.16, SD = 1.08, p < .001; the Netherlands M = 3.11, SD = 1.32, p < .001; Poland M = 3.56, SD = 1.67, p = .043).

Interaction between e-eavesdropping belief and affect. (a) The United States. (b) The Netherlands. (c) Poland.
Discussion and Conclusion
In today’s data-driven world, communication is often personalized based on an individual’s interests and preferences (Yun et al., 2020). Some people report receiving an ad on their mobile device that is seemingly related to a previous offline conversation (i.e., conversation-related advertising). This may lead people to believe that their electronic devices are eavesdropping (i.e., e-eavesdropping). To gain insights into the scope and characteristics of conversation-related advertising and e-eavesdropping, we conducted a survey in the United States, the Netherlands, and Poland.
The current study found that perceptions of conversation-related advertising occurring are a pervasive phenomenon. Most respondents indicated that they have received multiple conversation-related advertisements or heard about multiple instances of someone else receiving them. In addition, about half of the respondents heard about this through the media and a small group of respondents also through talks. In addition, between half and two-thirds of the respondents believed that it was likely that they received that ad because of their offline conversation. We did not find differences across countries, but we did find differences in e-eavesdropping beliefs between respondents with or without firsthand experiences with conversation-related advertising.
Confirmation bias could be an explanation for this finding. In the context of this study that means that people are more likely to make a connection between an ad and a previous offline conversation because they believe in e-eavesdropping. This explains the higher numbers of self-reported firsthand experiences and e-eavesdropping beliefs. AdTech (e.g., real-time bidding) has become so sophisticated and the vast amount of information collected on people’s (online) behaviors, needs, and interests resulting in personalized ads (Binns, 2022; McGuigan, 2023) may lead people to believe that these ads were based on offline conversations (Hunter, 2021). Conversely, people who do not believe in e-eavesdropping may not make the link between an ad and a previous offline conversation and are therefore also not reporting it. Hence, they may not perceive the ad as a surveillance episode. In addition, people may have alternative beliefs for receiving an ad that is seemingly related to a previous conversation other than e-eavesdropping, which could include digital trace data (i.e., online tracking), priming (e.g., the ad stands out because of the conversation), or that it is purely coincidental (Frick et al., 2021; Hunter, 2021). Future research is needed to gain more insight into people’s beliefs related to conversation-related advertising and what drives these beliefs.
Regarding the characteristics of such experiences, we find that respondents reported mostly on experiences with people they have a closer tie and regular conversations with. Similarly, they often reported secondhand experiences from people with a closer tie. In addition, respondents often reported a short time between the conversation and noticing the ad on a device that was present and on during the offline conversation. The ads associated with previous offline conversations were mostly encountered on Meta social media platforms, such as Facebook and Instagram. Meta’s advertising algorithms are designed to target users based on profiling, incorporating their interests and behaviors as well as data from users’ social connections (Facebook, n.d.). Social media users may talk more about things in line with their interests and see ads based on their interests. Similarly, if a user’s friend interacts with certain content or has particular interests, Meta may use that information to infer preferences and serve targeted ads to the user, which can create the perception that ads are directly related to offline conversations. Other platforms (e.g., Google search, YouTube) make use of other techniques, such as keyword targeting (Hennessy, 2023). As a result, users may be less likely to perceive a direct link between their offline conversations and the ads they see on these platforms.
Social media also plays a role in spreading information about the phenomenon and feeding folk theories: Most respondents who heard about conversation-related advertising through the media indicated to be exposed to stories through social media. Most respondents read or heard about experiences from other people or a description of the phenomenon in the media. Future research analyzing the content of media discussing the topic is necessary to further understand how the topic is discussed and whether this could potentially contribute or counter e-eavesdropping beliefs. Finally, a relatively low number of respondents attended talks (e.g., class, workshop, presentation) on the topic. However, this might be an opportunity to further inform people as an explanation of the phenomenon as well as provide technical information beyond merely describing the phenomenon.
When asking respondents how receiving a conversation-related advertisement made them feel, we found significantly higher scores for negative affect compared with positive affect across the three countries. Moreover, we found in all three countries that people who believe they received the ad because of the offline conversation experienced more negative affective responses than positive ones, as well as more negative affective responses compared with people who did not believe this. This finding suggests that, in line with the dataveillance framework (Strycharz & Segijn, 2022) and privacy management theory (Petronio, 2002), the conversation-related ad might be a trigger for perceived surveillance as well as a violation of a person’s privacy rules. People use heuristics to elaborate on privacy risk (Masur & Trepte, 2021). A surveillance episode could serve as such a cue that triggers perceived surveillance (Strycharz & Segijn, 2022). In addition, privacy settings and technological features (e.g., permission request to microphone, smart speakers’ passive listening feature) may serve as heuristics and increase the tension between ownership and control over access (Vitak et al., 2023).
Regarding cross-country differences, we found that the overall patterns of the characteristics of conversation-related advertising were similar. Some minor differences could be explained by cultural differences. For example, in Poland it is more likely to call someone an acquaintance than a friend (Wierzbicka, 1997), which could explain the higher number of reports of secondhand experiences from acquaintances. However, differences were found regarding privacy-related topics that could potentially be explained by the differences in privacy regulations. For example, Americans are more creeped out by it compared with the respondents from the other countries. Research on privacy regulations has shown that in the Netherlands, individuals rely on the law for privacy protection rather than on the industry or themselves (Strycharz et al., 2020) and trust in data handling by advertisers, the law, and the government is higher in Dutch compared with American respondents (Strycharz & Segijn, 2024). This might make Dutch people less creeped out and worried about the phenomenon.
Not being as creeped out in the Netherlands and in Poland might also be explained by the control paradox (Brandimarte et al., 2013). Past research in the United States has shown that users feel little control over devices listening in to collect data (Vitak et al., 2023). In contrast, having more control over sharing personal information—as offered by the law in the European Union—might put one’s vigilance to sleep and increase the willingness to disclose information. Hence, individuals in the European Union aware of their control might be less creeped out. In addition, because of the GDPR, European citizens might be more likely to believe that conversation-related advertising is not allowed or possible. This could explain why U.S. respondents were more likely to indicate they had this experience themselves or heard about it through others.
Interestingly, individuals in Poland were more pleased. This higher level of enjoyment from conversation-related advertising might be related to its novelty as Poland is generally considered a less marketing savvy market (Maslowska et al., 2013) and Polish people report to be more comfortable with data usage by companies (Eurobarometer, 2016). This also suggests that communist legacy in Poland may not play a central role in shaping negative affective responses to conversation-related advertising. This is in line with past research in different contexts, for example perceptions of trust that do not depend on post-communist culture (Clark, 2016).
Given that many privacy-related studies (Baruh et al., 2017; Segijn et al., 2021), as well as advertising studies (Ford et al., 2023), are conducted in the United States, this could lead to an overestimation of such beliefs and experiences worldwide. Therefore, we concur with the call for more comparative research on these topics (Masur et al., 2021), especially in largely under researched Eastern European countries or countries in the Global South (Ford et al., 2023). The current study should be seen as a first step examining the universality and scope of the phenomenon across countries. Although privacy regulations might be a plausible explanation for the found differences, we acknowledge that the countries differ in more aspects. Now that some differences have been established, future research is needed to further validate the claim of what is causing these differences (e.g., impact of media coverage, awareness, cultural factors).
Theoretical and Practical Contributions
The findings of the current study contribute to theory and practice in at least four ways. First, this study contributes to the literature by conceptualizing and mapping conversation-related advertising and e-eavesdropping beliefs. This is important because recent studies provided a first indication that people have the feeling that their smartphones or smart speakers are listening to their conversations (Frick et al., 2021; Vitak et al., 2023). The descriptive nature of the current study serves as a basis for future research that could use the information from the current study to test surveillance and privacy theories (e.g., DEAL framework, privacy management theory) as well as concepts (e.g., perceived surveillance, contextual privacy) in the context of this new phenomenon. Moreover, this information can be used to inform literacy programs and societal debates to closely match these discussions with people’s actual experiences. We found that most of the conversation-related advertising experiences reported, and information received on it through the media or talks happened recently, which indicates that perceptions of this type of advertising happening are a timely phenomenon and more research on the topic is needed to gain better understanding of it.
Second, the results of the study may have additional implications for social media platforms as well as the advertised product or brand. According to the DEAL framework, perceptions of surveillance can spill over to the message (Strycharz & Segijn, 2022). Our results suggest that people experience negative affect when receiving or hearing about conversation-related advertising, which may spill over to the content of the message. In addition, something similar may happen to the context in which the ad is embedded. We find that most respondents encounter such an ad on a social media platform (e.g., Facebook, Instagram). As a result of a spillover effect, people may feel more negatively toward the social media platform when receiving conversation-related ads, which could decrease their social media experience. Future research is needed to study such spillover effects and causal relationships.
Third, the low number of respondents who heard about conversation-related advertising through talks and news sources in the media indicates an opportunity and need for literacy. An exception is the higher number of people in the Netherlands who report having heard about it through a non-fiction TV show, which seems mostly driven by a TV show that informs consumers about products and services (i.e., “Radar”), that was broadcasted around the time of the survey. However, most respondents seem to encounter this phenomenon through their own experiences or experiences through others. Specifically, social media seems to play a central role in this. This could potentially be problematic because these sources could feed folk theories and can contribute to the spread of misinformation (Chen et al., 2023), which could explain the high number of respondents believing in e-eavesdropping. There is an opportunity for social media platforms, academic institutions, the government, and news sources to further educate people on this phenomenon and prevent false beliefs.
Fourth, the findings of the current study have implications for ethics and privacy regulations. Misperceptions about surveillance of devices could have individual and societal consequences. For example, it may cultivate privacy cynicism, which is an attitude of mistrust, uncertainty, and powerlessness stemming from powerful and difficult to understand services. The consequences of privacy cynicism include being vulnerable to risk and exploitation, lowering trust in (online) institutions, and leading to exclusion from economic opportunities (Ranzini et al., 2023). Future research is needed to further examine the impact of such beliefs on chilling effects, privacy cynicism, and their consequences. In addition, misperceptions may lead to chilling effects—the inhibition of legitimate behaviors (Büchi et al., 2022)—such as limiting free speech around devices or affecting people’s autonomy to behave freely with and around devices (Strycharz & Segijn, 2022). As a result of perceived surveillance, people may post or engage less on social media, create fake accounts or provide false information in their accounts, or spend less time or even stop using social media. This has consequences for people’s autonomy, such as limiting free speech. For example, people might avoid having certain conversations or change their use of the electronic device that they believe is listening to them. This also has implications for media platforms and advertisers because it could change or decrease the use of media (platforms). This means a different or less engagement with the media, which may change the data input used for future communication (Yun et al., 2020). Platforms that are seen as carriers of conversation-related advertising (e.g., social media platforms) need to take responsibility for transparency on how user data are collected and processed so that individuals experience freedom of expression and do not chill their legitimate and often beneficial behavior.
In sum, the current study systematically mapped people’s conversation-related advertising experiences as well as e-eavesdropping beliefs across three countries. People’s perceptions of conversation-related advertising occurring are a pervasive and timely phenomenon. People are exposed to it through first- and secondhand experiences, the (social) media, and to a lesser extent through talks. The current study is a first step in unraveling conversation-related advertising, which could serve as a steppingstone for future studies on this topic.
Footnotes
Appendix
Talk Experience Results Across the Three Countries.

| n | United States | The Netherlands | Poland | Total |
|---|---|---|---|---|
| 18 | 52 | 36 | 106 | |
| What kind of talk did you attend? | ||||
| Presentation | 38.9% | 15.4% | 41.7% | 28.3% |
| Lecture, class, or course | 41.2% | 50.0% | 22.2% | 38.7% |
| Workshop | 0.0% | 23.1% | 22.2% | 18.9% |
| Other | 11.1% | 9.6% | 2.8% | 7.5% |
| I do not know | 11.1% | 3.8% | 13.9% | 8.5% |
| Who organized or gave the talk? | ||||
| University or other academic organization | 44.4% | 11.5% | 42.3% | 23.6% |
| School | 0.0% | 32.7% | 25.0% | 24.5% |
| Government | 11.1% | 25.0% | 8.3% | 17.0% |
| Non-profit | 11.1% | 9.6% | 16.7% | 12.3% |
| Commercial organization | 16.7% | 15.4% | 16.7% | 16.0% |
| Other | 11.1% | 7.7% | 2.8% | 5.7% |
| I do not know | 5.6% | 5.8% | 11.1% | 7.5% |
| What was the main focus of the talk? | ||||
| An experience by one or more people | 27.8% | 9.6% | 11.1% | 13.2% |
| A description of the phenomenon | 33.3% | 17.3% | 30.6% | 24.5% |
| Explanation of the phenomenon | 22.2% | 32.7% | 25.0% | 28.3% |
| Technical information on the workings | 11.1% | 26.9% | 16.7% | 20.8% |
| Legal information related to the phenomenon | 5.6% | 13.5% | 13.9% | 12.3% |
| It was briefly mentioned | 16.7% | 7.7% | 8.3% | 9.4% |
| Other | 5.6% | 0.0% | 0.0% | 0.9% |
| I do not know | 5.6% | 9.6% | 11.1% | 9.4% |
| When did you most recently attend a talk related to the phenomenon? | ||||
| In the last week | 0.0% | 5.8% | 13.9% | 7.5% |
| In the last month | 16.7% | 25.0% | 16.7% | 20.8% |
| In the last 3 months | 16.7% | 21.2% | 25.0% | 21.7% |
| This year | 22.2% | 30.8% | 22.2% | 26.4% |
| Between 1 and 2 years ago | 33.3% | 7.7% | 11.1% | 13.2% |
| More than 2 years ago | 5.6% | 7.7% | 2.8% | 5.7% |
| I do not know | 5.6% | 1.9% | 8.3% | 4.7% |
Note. Percentages for the first three questions do not add up because people could check multiple options, unless they chose “I do not know”.
Acknowledgements
The authors would like to thank Alicja Strycharz for help with the Polish survey.
Declaration of Conflicting Interests
The author(s) declared no potential conflicts of interest with respect to the research, authorship, and/or publication of this article.
Funding
The author(s) disclosed receipt of the following financial support for the research, authorship, and/or publication of this article: The research was funded with research funds from the Hubbard School of Journalism and Mass Communication, University of Minnesota.