
Abstract
Many assume that in a digital environment with a wide range of ideologically tinged news outlets, partisan selective exposure to like-minded speech is pervasive and a primary cause of political polarization. Yet, partisan selective exposure research tends to stem from experimental or self-reported data, which limits the applicability of their findings in a high-choice media environment. We explore observed online audience behavior data to present a portrait of the actual online political news audience. We find that this audience frequently navigates to news sites from Facebook, and that it congregates among a few popular, well-known political news sites. We also find that political news sites comprise ideologically diverse audiences, and that they share audiences with nearly all smaller, more ideologically extreme outlets. Our results call into question the strength of the so-called red/blue divide in actual web use.
Keywords
In a digital environment with many ideologically tinged news outlets, people often assume that audiences will consume content from politically like-minded sources. Such expectations are wholly in keeping with theories of selective exposure, which have long informed studies of media uses and effects (Zillmann & Bryant, 1985), and have helped create a powerful myth of a stark red/blue divide in news consumption (Dilliplane, 2011; Levendusky, 2013; Mullainathan & Shleifer, 2005). Although this myth has been contested using a variety of methods and media platforms (Gentzkow & Shapiro, 2011; Messing & Westwood, 2014; Weeks, Ksiazek, & Holbert, 2016), it perseveres due to the increasingly extreme political polarization among voters within the United States and across the globe (Bump, 2016). In today’s political climate, partisans disagree not just about policies but also about “basic facts” (Doherty, Kiley, & Johnson, 2016). “Filter bubbles” offer a straightforward explanation of the mechanism that makes this extreme partisan divide possible.
As online news consumption shifts to social network sites (SNSs; Barthel, Shearer, Gottfried, & Mitchell, 2015; Bell, 2016; Lichterman, 2015), researchers have begun to more closely examine the way audiences engage with sites such as Twitter and Facebook (Bakshy, Messing, & Adamic, 2015; Barberá, Jost, Nagler, Tucker, & Bonneau, 2015; Winter, Metzger, & Flanagin, 2016). This has led some to conclude that ideological segregation on social media appears to be “overestimated” (Barberá et al., 2015, p. 1531). However, these studies have faced limitations in either methodology or scope. Some rely on experiments that struggle to emulate the real-world environment of seemingly endless media choice (Messing & Westwood, 2014; Winter et al., 2016). Others determine news consumption from self-reported data (Mitchell, Gottfried, Kiley, & Eva Matsa, 2014; Weeks et al., 2016), which can be biased or exaggerated (Prior, 2009). And even those studies that examine actual observations of online audience behavior have been confined to either social media use (Bakshy et al., 2015) or news site visitation (Gentzkow & Shapiro, 2011), rather than a combination of the two.
This article utilizes unique data to fill these gaps. We analyze online audience data provided by comScore to describe not only where audiences go for political news but also the path they take to those sources, as well as how much time they spend with them. We find that media audiences use Facebook as a de facto “front page” to navigate to a variety of online news sources. We also find that political news sites attract ideologically diverse audiences regardless of their political slant. Finally, we perform a network analysis and find that the most popular political news sites share audiences with nearly all smaller, more ideologically extreme news sources. Taken together, our results offer a nuanced portrait of the online political news audience that calls into question the strength of the so-called red/blue divide in actual web use.
Partisan Selective Exposure
The abundance of ideologically tinged media outlets available in a digital media environment has led many academics and social commentators to expect partisan selective exposure to rule the day. That is, conservatives will seek out conservative radio, television, and print outlets (e.g., Jamieson & Cappella, 2009) to the exclusion of all else. And similarly, liberals will encounter only those sources of news that conform to their partisan predispositions. A 2014 report from Pew Research Center found little overlap in the news sources liberals and conservatives “turn to and trust” (Mitchell et al., 2014, p. 1). Partisans, according to this line of research, happily live in “echo chambers,” avoiding all news and opinion that they disagree with.
Fears of ideologically driven selective exposure have gained momentum recently with the advent of social media algorithms that can create what Eli Pariser calls “filter bubbles,” which he describes as “your own personal, unique universe of information that you live in online” (Pariser, 2011). Pariser and others worry that Facebook’s newsfeed, for example, privileges stories from MSNBC for liberal users and stories from Fox News for conservatives, putting each user in a media environment where neither is exposed to opposing viewpoints (Keegan, 2016). These worries have intensified in light of the 2016 presidential election results, after which many surprised journalists published postmortems with sensational headlines like “Your Filter Bubble is Destroying Democracy” (El-Bermawy, 2016) and “The ‘Filter Bubble’ Explains Why Trump Won and You Didn’t See it Coming” (Baer, 2016). Implicit in these concerns is the assumption that audiences would prefer to expose themselves to perspectives they agree with while avoiding those they do not.
This expectation stems from the theory of selective exposure, which has been a foundational concept in communication and media studies for over half a century. At its core, it states that given a chance, individuals will choose media that reinforce their existing attitudes and interests (Klapper, 1960; Lazarsfeld & Katz, 1955; Zillmann & Bryant, 1985). Social psychologists attribute this preference to “motivated reasoning,” which posits that people are motivated to find information that confirms what they already believe (Kraft, Lodge, & Taber, 2015; Taber & Lodge, 2006). Since the beginning of the twenty-first century, there has been a deluge of books and articles on partisan selective exposure. The vast majority claim to document significant red/blue divides in news consumption. More recently, scholars have distinguished between selective exposure and selective avoidance, arguing that while audiences seek out ideologically aligning media, they do not actively avoid cross-cutting news sites (Garrett, Carnahan, & Lynch, 2013; Weeks et al., 2016).
Most such studies are based on surveys in which respondents provide self-reports of their media use (e.g., Gerber & Huber, 2010; Harrison, 2013; Mitchell et al., 2014; Stroud, 2011; Tsfati, Stroud, & Chotiner, 2014). Some are based on experiments, in which people choose among the options provided by the investigator (e.g., Iyengar & Hahn, 2009; Jones, Ferraiolo, & Byrne, 2011; Knobloch-Westerwick, 2014; Levendusky, 2013). There are several concerns with these studies.
The first is methodological. Some scholars question the ability of self-reports to accurately measure media use. Prior found that self-reported news exposure can inflate the size of the news audience by more than 300% (2009). Yuan and Webster (2006) found that television watching recorded in real time much more accurately captured viewing habits than self-reports. If anything, the ability to accurately recall media consumption is likely to get worse as media choice continues to expand (Taneja, 2016; Taneja, Webster, Malthouse, & Ksiazek, 2012).
Experimental studies not only sidestep these concerns but also invite new ones. Experiments designed to test how participants engage with partisan media typically place participants in settings where they face a highly restricted set of media options compared to what they face in the real world (Messing & Westwood, 2014; Winter et al., 2016). In other words, these experiments mimic a limited slice of the information environment. As a result, participants may act differently within these experiments than they would in real life. Furthermore, by limiting the available media options, these experiments are unable to reckon with another important factor that motivates media choice—the popularity of content.
“The Persistance of Popularity”
In a media environment of endless choice, audiences often rely on cues to decide what media to consume (Webster, 2014). Because people equate popularity with quality, they look for cues that suggest media has been chosen by many others (Scheibehenne, Miesler, & Todd, 2007; Webster, 2014). Although popularity cues are but one of many kinds available to audiences, they have grown even more pronounced online as others have become less visible. For example, while a newspaper front page reveals the opening paragraph of its articles, their accompanying art, their section, and their author, an online news site typically reveals little more than the headline (Althaus & Tewksbury, 2002). Instead, audiences look to see how many times a story has been “liked” or “favorited,” or if it has made the site’s “most read” list (Knobloch-Westerwick, Sharma, Hansen, & Alter, 2005; Yang, 2015). In the absence of other information, people use popularity as a way to judge a source’s accuracy and importance (Asch, 1951; Mutz, 1992).
The appeal of the popular is also baked into the media system in the form of “recommender systems.” These are mechanisms that direct audiences to specific kinds of content to assist in the overwhelming task of media choice (Mutz & Young, 2011; Webster, 2014). For instance, the algorithms that determine link placement in search engines and SNSs showcase more popular content—the more visits a piece of online content gets, the higher it will show up in a Google search, and the higher it shows up, the more clicks it is likely to get. Often this results in a “winner-take-all” effect, wherein consumers congregate around the most popular products because they are both more aware of them and assume they are more likely to enjoy them, while they are less aware of less popular media and also less likely to give it a try even if they find out about them (Elberse, 2008). This “winner-take-all” effect has been observed in studies of television, internet, music downloads, and movie rental data, where the most popular products command a majority of the audience (Elberse, 2008; Salganik, Dodds, & Watts, 2006; Webster & Ksiazek, 2012). Webster and Ksiazek (2012) refer to this phenomenon as “the persistance of popularity” (p. 52).
This “persistence” has been observed in past studies of online news consumption. For example, in an analysis of the online news audience, Gentzkow and Shapiro (2011) found that the majority visited a small number of very popular, ideologically centrist outlets; and in his analysis of Hitwise data, Hindman (2008) similarly found that about a third of the online audience concentrated on the top ten political sites. By using data that draw from observed audience behavior, these studies captured the way audiences consumed political news in the real world. In doing so, they found that the political news audience does not split down ideological divisions. Instead, it congregates among a few popular, well-known news brands.
Navigating the News on SNSs
What these studies leave out, however, is the role that social media platforms play in the political news consumption process. This issue is increasingly relevant as political news production and consumption take place more and more within SNSs (Hedman, 2016; Peacock & Leavitt, 2016). In a media landscape where news professionals devote precious resources to promoting content on SNSs, these platforms increasingly function much like mass media outlets once did (Wohn & Bowe, 2016). As McGregor and Mourao (2016) put it, “There is no doubt of the political importance of SNS” (p. 3). This is especially true of Facebook, where a majority of US adults now get news (Gottfried & Shearer, 2016).
Another reason why it is important to consider SNSs in research on political news consumption is that these sites are likely reaching audiences that might otherwise tune out political news altogether. SNS visitors report getting news incidentally while “online doing other things,” as opposed to actively seeking news out (Gottfried & Shearer, 2016, p. 6). While actively engaged political news seekers tend to be more ideologically extreme and more eager for like-minded content, those who do not go out of their way to find political news tend to be more open to different kinds of it (Arceneaux, 2013). Therefore, a majority of SNS users who come across news by chance might not even consider the source when deciding whether or not to click. Instead, these accidental news audiences might be clicking on articles based on their headlines rather than the political slant of their publishers (Mitchell & Page, 2013).
Recent studies of how audiences share and discuss political news within SNSs have found little evidence of partisan selective exposure (Messing & Westwood, 2014; Winter et al., 2016; Wu & Shen, 2015). Messing and Westwood (2014), for example, found that social media users considered the number of people who had recommended a piece of content when choosing whether or not to look at it, regardless of that content’s political slant. Others concluded that news links shared on social media cut across ideological lines (Barberá et al., 2015; Heatherly, Lu, & Lee, 2016), diminishing the chances that “echo chambers” will form and partisan selective exposure will play out. Again, however, these findings rely on data derived from experimental settings (Winter et al., 2016) or self-reported data (Heatherly et al., 2016; Shehata & Strömbäck, 2013).
Even when researchers use observed behavior data to explore political news habits, they have faced limitations. For example, Bakshy et al. (2015) analyzed Facebook data to examine how much cross-cutting and like-minded content a user sees in their newsfeed, but they could not measure how political news seeking via Facebook compared with seeking similar content via other portals or platforms, nor could they observe the overall audience composition of the political news sites its users were exposed to. Their dataset also only included Facebook users who identified as a democrat or a republican in their profiles—a subset that is likely to be more aggressively partisan than the average user.
The appeal of web analytic data provided by a firm like comScore is that they are both comprehensive and specific: they are a record of observed behavior among a large sample as they move between different sites. For instance, in addition to revealing the sequence by which audiences move from SNSs to political news sites, these data also reveal the amount of time they spend on each news site, as well as the demographic breakdowns of the sites themselves. In short, these data allow us to observe the paths audiences take and describe the compositions of their destinations. In doing so, they provide a thorough illustration of what online political news consumption looks like in the real world.
What follows is an analysis of these data to examine how ideologically diverse audiences move across political news outlets and the role that SNSs play in this process. With that, our research questions are
R1. How do online audiences with different political ideologies consume political news?
R2. What role do SNSs play in online political news consumption?
Data
Our data come from comScore, a web analytic company that reports monthly estimates of online audiences. Such data have been used in scholarly analyses of digital audience behavior (Gentzkow & Shapiro, 2011; Nelson & Webster, 2016; Taneja & Webster, 2016; Taneja & Wu, 2014). comScore collects its data from a panel of about 1 million people aged two and older, who load comScore tracking software on their desktop computers. That software tracks the universal resource locators (URLs) the user visits and the time they spend looking at each address. comScore fuses these data with server-based counts of traffic that come from tagging websites (“comScore Media Metrix Description of Methodology,” 2013). It also conducts monthly surveys of its panel using random digit dialing of both landlines and cellphones. Among other things, these surveys ask respondents to self-report their political party affiliation and ideology. Each month, comScore uses weights to make projections about the online behavior of the total US online audience. In October 2014, comScore recorded a total internet audience of about 184 million unique visitors. Of those, about 43 million visited online news sites.
comScore organizes websites by domain and subdomain, and then categorizes them based on the subject. For this project, our sample included the 50 most visited political news websites and 22 other news sites that had been examined in previous studies of partisan selective exposure (Mitchell et al., 2014). We chose the top 50 sites because these sites account for over 90% of the reported online political news consumption. We chose October 2014 as the time period for our sample because news audiences exercise more interest in political news as the election day nears (Boczkowski, Mitchelstein, & Walter, 2012). This may lead to an overestimation of political news use generally; however, our focus is less on determining the size of the political news audience than it is understanding the behavior of this audience. Therefore, choosing a period of when this audience is at its largest allows us to understand a higher level of generalizability.
Few publications admit that they have a political ideology, so scholars have used a variety of methods to deduce political bias in news. Gentzkow and Shapiro (2011), for example, examined the ideological preferences of an outlet’s audience. However, a larger percentage of the audiences of the sites in our sample consider themselves “middle of the road” ideologically. This was true even for the sites with explicitly stated political ideologies. Instead, we determined political news site ideology using a technique developed by An, Cha, Gummadi, Crowcroft, and Quercia (2012) and refined by Barberá and Sood (2015). This approach involves analyzing politically interested Twitter followers of thousands of news outlets to estimate the ideology of each outlet on a unidimensional scale. This method exploits the fact that politically interested individuals will follow news sources that align with their ideologies. The authors validated estimates derived from this technique by comparing them against five other measures (Gentzkow & Shapiro, 2010, 2011; Groseclose & Milyo, 2005; Shaw & Sparrow, 1999; Toff & Kim, 2013).
Method
Demographic Data Analysis
To answer our first research question, we ran descriptive analyses of comScore’s demographic data. Doing so allowed us to see first how many people visited political news sites in October, and then to see how many of those visitors were liberal, how many were conservative, and how many were moderate (comScore labels these people “middle of the road”). comScore offers many different measures of online traffic. We chose “unique visitors,” which refers to the number of distinct individuals requesting pages from a website during a given period, regardless of how often they visit. We chose this measure because it provided the most accurate count of the number of individuals who visited political news sites during our period of analysis.
In addition to looking at measures of audience size, we examined the amount of time audiences spent on each of these sites. Doing so provided a clearer picture of political news audience behavior that was helpful for understanding the relationship between partisanship and media consumption. For example, if liberals and conservatives visit Fox’s website in equal numbers, but conservatives spend considerable more time there, that tells us something about the effect of ideology on media consumption that would not have been apparent otherwise. The measure we chose to examine time spent by audiences was “average minutes per visitor,” which refers to the average amount of time in a given month an individual spent on a specific site.
Network Analysis
Next, we performed a network analysis of the audience duplication among the sites in our sample to understand how many of the sites shared audiences with one another. Audience duplication can be assessed using a comScore tool that allows us to see what percentage of the total internet audience overlapped in their visits to the sites in our sample within our period of analysis. Audience duplication shares the number of unique visitors who overlapped on two different sites, as well as the percentage they comprise of the total internet audience. We recorded these percentages and used them to determine links in our network.
Network analysis can be used to assess the links among a set of entities (Monge, 2003). Scholars have increasingly applied network analysis to media systems to understand audience behavior (McGregor & Mourao, 2016; Taneja, 2014; Taneja, Wu, & Edgerly, 2017; Webster & Ksiazek, 2012; Yuan & Ksiazek, 2011). In network analytic terms, the political news sites are “nodes,” and the audience duplication between them are “links” or “ties.” “Degrees” are the units that describe the number of ties a node exhibits. For this study, our goal was to compute a degree score for each political news site to determine how many of these sites shared audiences with one another. First, we needed to determine how much duplication should be required to determine a tie exists.
Scholars who have used audience duplication analyses (Taneja & Webster, 2016; Webster & Ksiazek, 2012) have observed that there will always be some level of audience duplication that occurs by chance, especially with outlets that have larger audiences. For example, visitors to Northwestern’s homepage are very likely to visit Google and less likely to visit the homepage of a Chicago restaurant. To adjust for the size of media outlets, Webster and Ksiazek (2012) and Taneja and Webster (2016) used absolute random duplication as a threshold for determining the existence of a tie. In other words, a tie exists only when the observed audience duplication is greater than the expected audience duplication. For example, if 50% of all internet users visit The New York Times and 50% visit Fox, 25% could visit both as a matter of chance. So, if observed duplication between The New York Times and Fox is higher than absolute random (expected) duplication, The New York Times and Fox are assigned a tie. This method resembles the process of analyzing residual values that is normally used in a chi-square, where expected frequencies are subtracted from observed frequencies. In instances where observed audience duplication was greater than expected, the difference was used to indicate the strength of each individual tie. So, for example, if the duplication observed between The New York Times and Fox was 50%, then the tie between the two was attributed a strength of 25.
This process is summarized in the equations below:
Observed duplication (Oab) = Actual percentage of audiences that visited both sites a and b
Expected duplication (Eab) = P(a) × P(b)
P(a) = Percentage of audiences that visited Website A
P(b) = Percentage of audiences that visited Website B
For each political news source, the total number of ties provided a degree centrality score and a weighted degree score. For this analysis, a high degree centrality for a specific political news outlet meant that it shared audiences with a large number of other political news outlets. For example, if The New York Times had observed audience duplication that occurred at a rate greater than chance for 60 websites out of 72, it had a degree centrality of 60, meaning that it is connected with 83% of all the sites in the network. The weighted degree score, on the other hand, examined the strength of the ties, meaning that a site that reported a high weighted degree score had higher percentages of audience duplication than other outlets in the sample. In other words, while the degree centrality score is the sum of the ties, the weighted degree centrality score is the sum of the weight of the ties.
Finally, we plugged the data into Gephi, a network analysis program, to create a visualization of the network. This network is undirected, meaning that the direction of the paths between nodes was not known. The reason we chose to do an undirected analysis is because comScore does not report directions of online traffic within the audience duplication tool. So, while we can observe audience duplication between Fox and MSNBC, we cannot know if those audiences started at Fox and went to MSNBC or vice versa.
Source/Loss
To answer our second research question, we used a comScore feature that allows us to see where visits to the news sites in our sample originated from. This feature is called “source/loss” because it shares the source of incoming visits to a site, as well as the subsequent destination of these visits (the loss). It is important to note that comScore does not know how visitors navigated from one site to another. This tool tracks audience movement but not audience clicks. In other words, a visitor moving from Gmail to The New York Times does not necessarily mean that the visitor clicked a link in an email that directed them to a news story. As a result, this tool can allow us to see the path that audiences take to get from one site to another but not how they did so.
Results
Political News Site Demographics
Figure 1 shows that that visitation to the political news sites in the network followed a long tail distribution (Anderson, 2008), meaning that most of the traffic was concentrated among a few sources.

Unique visitors (in millions) to political news sites in October 2014.
comScore demographic reports indicated that these sites comprised ideologically diverse audiences. The ideological breakdown for the most popular political news sites (Figure 2) revealed ideological heterogeneity more or less consistent with the total internet population.

Political news site audience ideological outlook for October 2014.
In general, the audiences for each of these sites were mixed and mostly respondents who classify themselves as political moderates. As Figure 2 shows, both liberals and conservatives often visited the same political news sites. Notably, liberals made up only a slightly smaller portion of Fox News’ audience than they did the total internet audience, and conservatives were actually more likely to visit MSNBC than liberals were. Buzzfeed drew a larger percentage of conservatives than Breitbart did, and The New Yorker reported a higher percentage of conservatives than did Drudge Report. Furthermore, about 50% of the visitors to ideologically liberal sites like MSNBC and ideologically conservative sites like Fox News were “middle of the road” politically.
Figure 3 shows the average amount of time spent (in minutes) per visitor to the most popular political news sites during October 2014. A Pearson correlation test revealed that not only do liberals and conservatives visit the same political news sites but they also spend comparable amounts of time on these sites (r = .95). There are three notable exceptions: conservatives spent more than twice as many minutes on Drudge Report as liberals did (although both groups spent more time on Drudge than any other site); liberals spent twice as much time on The New York Times as conservatives did; and conservatives spent about three times as many minutes on Google News Search as liberals did. These results indicate that although liberals and conservatives visit some political news sites differently, their online political news consumption, in general, is remarkably similar.
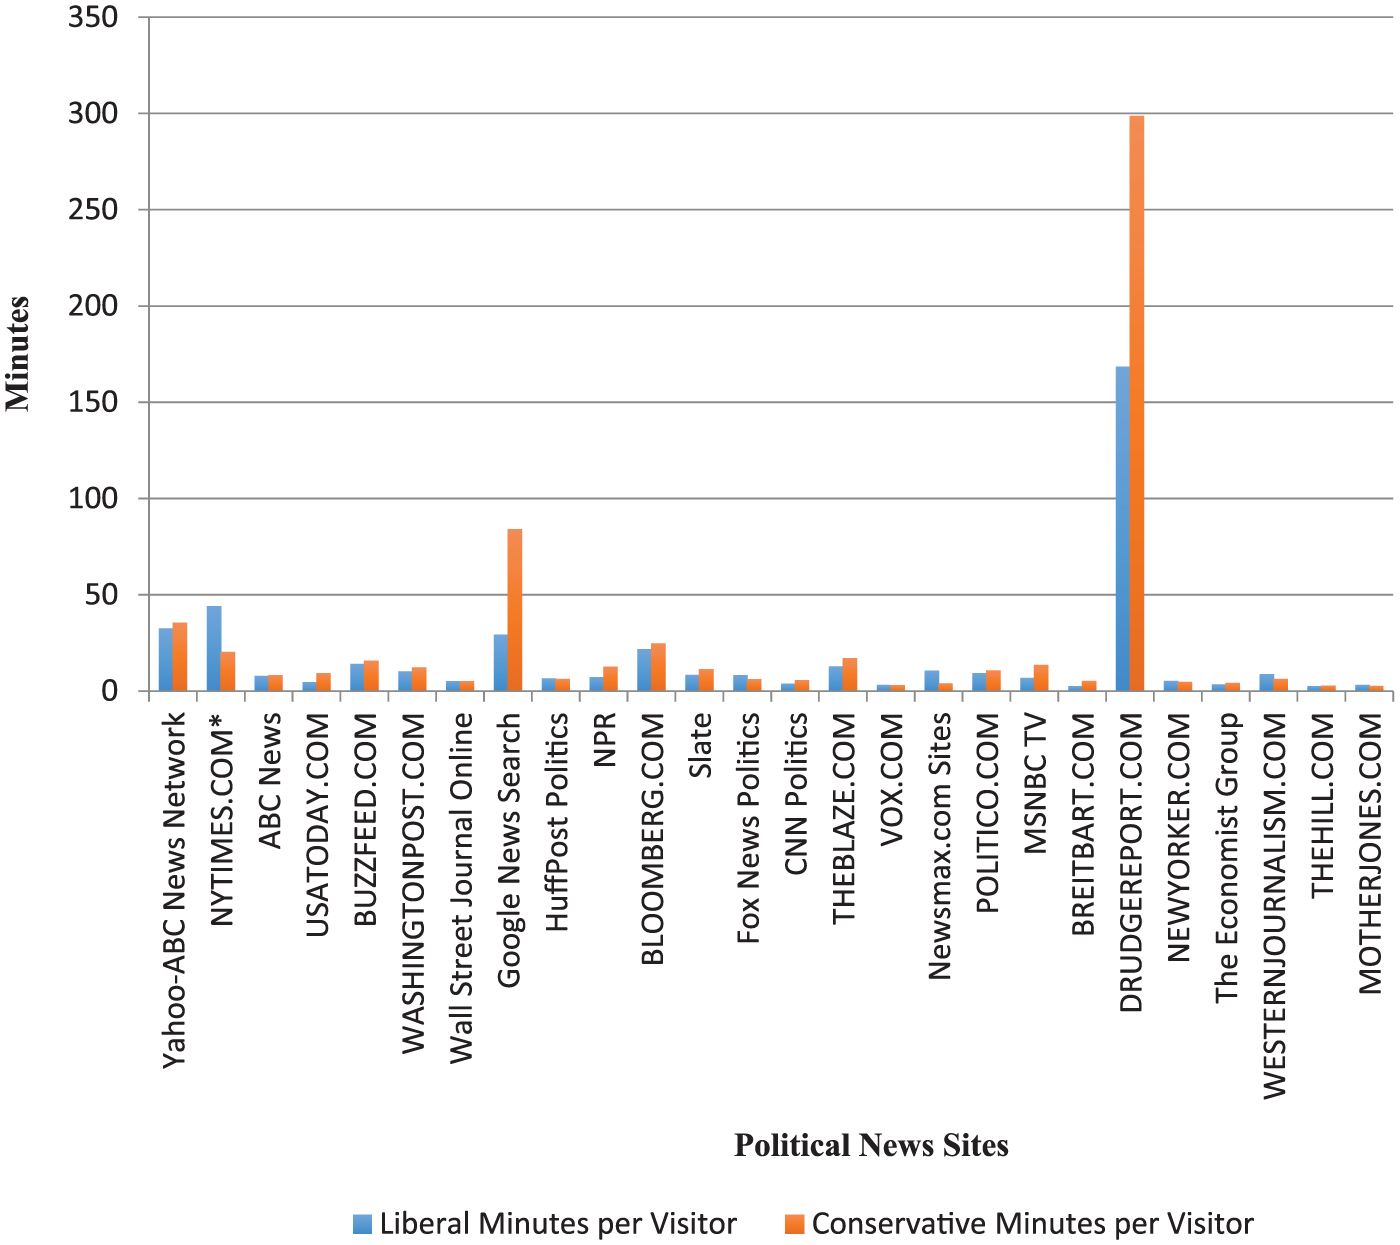
Average time spent per visitors to political news sites in October 2014.
Network-Level Analysis
Figure 4 provides a visualization of the entire network. The dots are the nodes (political news websites) and the lines are the ties (audience duplication) between them. The color of the nodes correlates with their ideology: blue for liberal and red for conservative. The thickness of the lines between the nodes corresponds with the strength of the tie. So the shared audiences between Huffington Post Politics, Fox News Politics, Vox, CNN Politics, and MSNBC are greater than those among most of the other political news sites. However, audience duplication occurs between most of the sites in the network. There is only one isolate, PoliticalDerby.com. Otherwise, audience duplication happened at a rate greater than chance among every site in the network.

Political news outlet network visualization.
The size of the node corresponds to the number of unique visitors that the site received in October 2014, while the size of the font for the site’s name corresponds to the number of degrees that the node has. In other words, the larger the site’s name, the more ties it has with other nodes. So Huffington Post Politics, Fox News Politics, The New York Times, and The Washington Post have audience overlap with most of the sites in this network, while Politifact and MrConservative have overlap with far fewer. In general, the nodes within the visualization have grouped into one loosely packed cluster. The visualization is based on the Yifan Hu drawing algorithm, a multilevel approach designed to efficiently create high-quality, large graphs. It does so by combining a multilevel approach to find an optimal layout and an octree technique to concisely render short and long ranges. The result is an algorithm ideal for graphing large networks without distortion (Hu, 2005).
Node-Level Analysis
Figure 5 reveals the degree centrality score for each political news source in the sample. The degree centrality score is the number of ties a specific node has with other nodes. For example, Yahoo-ABC News Network has ties with 71 of the sources in the sample, giving it a 100% degree score. The Blaze, a conservative news site, has ties with 45 other political news sources, so its degree score is 62.5%. The distribution reveals that the most popular political news sites share audiences with many of the other political news sites in the sample. The less popular news sites, like PoliticusUSA.com and C-SPAN, have fewer instances of audience duplication. However, the few ties they do have are with the more popular, often more ideologically centrist sites in the network (e.g., Yahoo-ABC News). In fact, the correlation between the number of ties a political news source has and the number of visitors it attracts was .77, indicating a strong, positive relationship between the popularity of a political news site and the number of political news sites with which it shares audiences.

Degree (% of possible links) of political news site audience network.
Finally, we examined the weighted degree score, which allowed us to understand the strength of the ties between specific nodes in our sample. Again, we found that the more popular political news outlets (e.g., Yahoo, ABC, and The New York Times) had higher scores than the other sites in the sample. There was a strong correlation between the degree score and weighted degree score (r = .91), indicating that the popular news outlets in our sample not only report more ties but stronger ties as well, while the less popular sites had both fewer and weaker ties (Figures 5 and 6). In other words, not only does Yahoo share audiences with every other site in the sample but it also shares a higher proportion of its audience (its weighted degree score was .8). Drudge Report, on the other hand, shares its audience with only 33 other sites, and its weighted degree score was only .14. Again, however, it is important to note that the ties Drudge Report does have are with center-left news sites like Yahoo and The New York Times in addition to more conservative sites like The Blaze. In fact, as the network visualization reveals, the audience duplication between Drudge and The New York Times is more pronounced than it is between Drudge and Fox.

Weighted degree score of political news site audience network.
Audience Origins
Although many studies have observed what types of news people consume, we know relatively little about the path they take to get to those sources. comScore’s source/loss tool reveals the location from which online audiences navigated to the political news sites in our sample. We found that audiences were browsing Facebook just prior to visiting political news sites more frequently, on average, than they were browsing any other site (Figure 7), including the other frequent origins: Google, Twitter, and simply logging on (i.e., opening your browser and navigating straight to a specific site). Again, it is important to note that we could not discern if audiences actually were clicking on a link within Facebook to get to a political news site or navigating to that news site independently. However, the fact that online audiences were much more likely to navigate to a political news site from Facebook than they were to log directly onto the site or to find it using a Google search suggests that Facebook has become the de facto front page for online news audiences.

Political news site audience origins.
Discussion
Our results offer a comprehensive portrait of the online political news audience. While prior examinations of partisan selective exposure have been limited by either their data (e.g., experimental, self-reported) or their scope (e.g., solely focused on social media or news site use rather than the two combined), our study used web analytic data to explore not only the ideological profiles of political news sites but also the paths most commonly taken to reach them. Our results show that the online political news audience tends to overwhelmingly congregate within a handful of popular, brand-name news sites, like Yahoo, the New York Times, and ABC. What’s more, all sites in the sample, including the more obscure, more partisan political news outlets, attract ideologically diverse audiences in proportion with the overall online audience. And, of the 72 sites in the sample, many share audiences with many others. Even those that only overlap audiences with a few sites share audiences with more popular, less ideologically slanted political news sources like Yahoo. Finally, political news site visits frequently originate from SNSs, notably Facebook.
These findings indicate that partisan selective exposure is not occurring when it comes to online news consumption. Contrary to Pew’s report on political polarization (Mitchell et al., 2014), liberals and conservatives tend to inhabit the same worlds, as evident from the audience demographics of the sites in the sample. Within this world, a few brand-name news sites attract a majority of the political news audience, while the remaining news sites attract negligible amounts of audience visits. Ideologically mixed audiences are not only visiting the same political news sites but also spending comparable amounts of time on them. This is a world not of echo chambers or filter bubbles but of political news consumption that looks surprisingly similar regardless of visitors’ political preferences.
These findings raise important questions about political news consumption. For example, what does it mean about online news behavior that all of the sites in our sample—including those with obvious ideological leanings like Fox and MSNBC—comprise audiences that are ideologically mixed more or less in line with the total internet population? What should we make of the fact that political news consumption is far more omnivorous than many previously suspected? If “echo chambers” are not to blame for increasing political polarization, what is?
We are not the first to find evidence that contradicts the prevalence of partisan selective exposure (Bakshy et al., 2015; Gentzkow & Shapiro, 2011; Weeks et al., 2016). However, by examining both audience exposure to and time spent with political news sites, and by pairing that with our analysis of the pathways audiences take when navigating to political news, our results provide the most holistic look at online political news consumption to date. This process increasingly begins on SNSs like Facebook, as recent research has revealed (Barthel et al., 2015; Lichterman, 2015; Mitchell & Page, 2013) and our findings confirm.
As more and more news consumption occurs on social media platforms (Bakshy et al., 2015; McGregor & Mourao, 2016; Messing & Westwood, 2014; Wohn & Bowe, 2016), it is likely that news audiences will continue to grow less attached to specific news sources and more drawn to whatever stories are trending on their newsfeeds. Although recommendation algorithms may vary from platform to platform, most direct (and will likely continue to direct) attention to whatever is the most popular (Webster & Ksiazek, 2012). Much social media use has migrated to mobile devices from which we did not have data. While we have no reason to believe that data from mobile platforms would produce a different result, this should be explored in future studies.
That we found no evidence of partisan selective exposure does not mean that we believe the fears of political polarization to be unfounded. Instead, we believe that more work should be focused on how media audiences engage with political news, rather than how frequently they are exposed to it. Our study was limited, in that it used exposure as a way to determine audience duplication, which does not get at the way that a visitor actually engages with a political news site. We can say that MSNBC and Fox News share audiences, but we cannot draw conclusions about the impression these outlets leave on audiences from different ideological backgrounds. Is a liberal who clicks on a story from Rush Limbaugh’s website consuming that story with a wariness they leave behind when they read a story on MSNBC? What does it mean that liberals spend more time with The New York Times and conservatives spend more time with Drudge, yet both demographics visit both sites? The idea that a person’s ideology may affect how they engage with a news story has been explored in the past (Levendusky, 2013; Mutz, 2015; Taber & Lodge, 2006). We hope that our findings will encourage scholars to put more of their efforts into investigating this relationship going forward.
Footnotes
Declaration of Conflicting Interests
The author(s) declared no potential conflicts of interest with respect to the research, authorship, and/or publication of this article.
Funding
The author(s) received no financial support for the research, authorship, and/or publication of this article.