
Abstract
Introduction
Mechanomyography (MMG) is a non-invasive measurement of the oscillations produced by surface skeletal muscles during contraction. Previous research has identified a strong correlation between declines in maximum peak-to-peak MMG amplitude and peak torque during stimulated fatigue in limb muscle. 1 It was thus proposed that reductions in surface MMG during fatigue could reflect depressed Ca2+ transients in fatigued fibers that coincide with lower capability to generate force muscle. 1 Further research has confirmed that MMG is an accurate and reliable methodology in estimating skeletal muscle function in both the contracted and relaxed state.2–5
A muscle fatigue test was proposed in 2017 that assesses muscle twitch responses to a submaximal, constant current, electrical stimulation measured by mechanomyography. 6 The proposed test measures maximum peak-to-peak MMG amplitude (i.e., contraction magnitude) over the range of stimulation frequencies a clinical electrical stimulator can achieve that are still low enough to avoid fusing of the action potentials.6,7 Submaximal, non-tetanic contractions are chosen because tetanic, higher force contractions may have immediate adverse effects in clinical populations such as orthopedic injury, 8 exercise-induce muscle injury, 9 occluded blood flow, 10 and reduced tolerability. 11 The developers of this test have provided evidence that MMG provides a good proxy for torque over a single muscle twitch, 6 but the procedures should be examined to ensure they provide a valid measure of muscle function over the proposed intermittent fatigue test in muscles that are accessible in patients confined to a hospital bed. Patients confined to hospital beds experience reductions in weight-bearing activity due to immobilization consequently leading to decreases in skeletal muscle strength, size, and function. 12 Intensive care unit acquired weakness (ICUAW) is associated with prolonged periods of recovery and a decreased quality of life 13 and as many as eighty percent of patients with ICUAW have functional impairments for up to 5 years after discharge. 14 Early diagnosis is thought to be crucial in the treatment of ICUAW.15–17 Measuring changes in muscle function and joint torque through dynamometry is not a practical method in many clinical settings due to cost, spacing and resources. Traditional dynamometers are not portable, requiring a dedicated lab space for testing. This would require physically moving patient to a separate lab for strength assessments. In addition, multi-joint dynamometers generally cost tens of thousands of dollars per unit. Handheld dynamometry may overcome the cost and portability constraints for strength testing, but the proposed procedures using dynamometry still require the subject to voluntarily perform maximal contractions.18–20 However, MMG measured through surface accelerometers could allow clinicians to evaluate skeletal muscle function via stimulation while patients are restricted to a hospital bed regardless of their level of consciousness. While the proposed procedures would allow us to assess skeletal muscle in these patients, the previous studies published using this test have not compared muscles between a state of high and low function.6,21,22 More evidence is needed to confirm whether the aforementioned submaximal fatigue protocol can detect clinically relevant changes in muscle function when they should be present. A clinically relevant change would be of sufficient magnitude to cause disability, from either weakness or fatigue. 23
It is well established that ischemic environments increase rates of fatigue,24–30 and that MMG can be used to measure skeletal muscle fatigue.31–38 If the proposed fatigue protocol is valid, it should be able to detect an increase in fatigue when the muscle is manipulated into an ischemic environment. Fatigue in this study is defined as a reduction in MMG amplitude from the peak-to-peak contraction amplitude observed over the entire stimulation period. We refer to this as a reduction in contraction magnitude. Inducing an ischemic environment should induce a clinically relevant decrease in skeletal muscle function because impaired blood flow is associated with clinical weakness 39 and increased fatiguability. 40 Healthy subjects were used in this study because there were concerns whether tourniquet use in clinical populations might elevate the risk for thrombosis. 41 Therefore, the purpose of this study was to provide evidence of validity for the proposed fatigue test procedures in the ankle dorsiflexor and wrist extensor muscles. This was achieved by first demonstrating that the acceleration measurements provided a valid approximation of force throughout each stimulation phase, and then determining whether data from the proposed fatigue protocol can detect reduced function in the ankle dorsiflexors and wrist extensors in response to occluded blood flow. The first hypothesis was torque would highly correlate with MMG measures. The second hypothesis was mean contraction magnitude would be demonstrably lower when the tourniquet was applied proximal to the target muscle since weakness and fatiguability are rapidly brought on by blood flow occlusion. The third hypothesis was that there would be differences in the magnitude of fatigue between muscle groups at different stage of the protocol.
Methods
Subjects
Subject characteristics.

All values reported as mean ± SD.
Experimental design
Two experiments were performed to provide evidence for the validity of using an intermittent fatigue test paired with MMG, measured as skin surface acceleration, to detect functional changes in the muscle. During the first experiment, acceleration data was collected on 6 subjects using an Axivity AX3 triaxial accelerometer (Axivity: Newcastle, UK) and was correlated to torque measurements recorded simultaneously using a Cybex Humac Norm Dynamometer (Cybex: Bayreuth, Germany). The second experiment was performed to determine whether the MMG data collected during the proposed fatigue test would detect reduced muscle function when it should be present. A separate set of subjects (n = 10) was recruited for this second experiment. Subjects performed two fatigue tests (control vs tourniquet) each for both the ankle dorsiflexors (AD) and the wrist extensors (WE) as described below. Tourniquet trials were assigned in a counterbalanced design, with half the subjects performing the tourniquet trials first and the other half performing them during the second trial. Subjects had a 10-min break between trials to allow the muscle time to recover.
Procedures
In the first experiment, subjects (n = 6) had torque and MMG measured during the stimulation of the ankle dorsiflexor (AD) muscles. Subjects were placed supine on a Cybex Humac Norm Dynamometer (Cybex: Bayreuth, Germany) with the lower leg suspended on a brace, placing the knee in a 90° position. The foot was secured using Velcro straps to an attachment for measuring ankle dorsiflexion. The dynamometer was sampled at 100 Hz. The accelerometer was placed on the muscle belly 1/3 the distance from the origin to the insertion. This was done in an attempt to standardize the placement of the accelerometer between individuals. The accelerometer was programmed to record at 800 Hz immediately upon disconnecting the USB cable. S Series Stimulating electrodes (Unipatch: Mansfield, MA) were placed proximal and distal to the accelerometer. A Vectra Genisys clinical electrical stimulator (Chattanooga: Lewisville, TX) was programmed using the series function to stimulate the muscle at 2 Hz, 4 Hz, and 6 Hz with 3 min for each stimulation frequency. These stimulation frequencies are based on previous studies that proposed using this range of frequencies to test the muscle over the range of frequencies employed by clinical electrical stimulators that are low enough to avoid fusing of action potentials.6,21,22 The stimulator controlled the changes in stimulation frequency with 3 s between stimulation phases. All stimulation phases were conducted at 60 mA. Previous research has confirmed the relationship between torque and MMG for single stimulated contractions over the range of 50–75 mA. 6 This study employed a consistent current of 60 mA which falls within the previously validated range. Previous studies have reported using a constant submaximal stimulation intensity using this protocol and found them to be valid across multiple subjects.6,21,22 This is important because discomfort from the stimulations 11 and the electrical current limitations placed on clinical stimulators limit the ability to use maximal stimulation intensities. A countdown was performed to synchronize the start of the stimulation protocol with the initiation of data recording by the accelerometer. After concluding the stimulation protocol, the accelerometer was connected via USB to a local computer and the data was promptly downloaded.
In the second experiment, subjects (n = 10) were asked to complete two fatigue protocols (control, and tourniquet) each for both the ankle dorsiflexors (AD) and the wrist extensors (WE). During the tourniquet trial, a 3.8 cm wide Combat Application Tourniquet Generation 7 (C.A.T Resources, LLC: Rockhill, SC) was applied either proximal to the elbow (wrist extensor measurements) or proximal to the knee (ankle dorsiflexor measurements) and tightened until the distal pulse (radial or dorsalis pedis) was no longer present. For each muscle tested, subjects were asked to lay supine on a simulated hospital bed and the subject’s dominant ankle or forearm were secured to a custom metal base plate using an orthopedic brace and Velcro straps (see Figure 1). An Axivity AX3 triaxial accelerometer was placed on the muscle belly. The accelerometer was programmed to begin recording immediately after being disconnected from the USB cable at 800 Hz. S-Series Stimulating electrodes (Unipatch: Mansfield, MA) were placed on either side of the accelerometer. A Vectra Genisys clinical stimulator (Vectra Genisys, Chattanooga) was programmed to deliver a series of stimulation protocols to muscles at 2, 4, and 6 Hz for 3 min each at 60 mA. The stimulator controlled the changes in stimulation frequency to ensure consistency of period transitions between subjects. There was a brief 3-s pause between stimulation frequencies as the stimulator transitioned between the protocols. To begin testing, a countdown was verbalized to synchronize both the recording of data by the accelerometer and the electrical stimulation. After the conclusion of the stimulation protocol, recording by the accelerometer was stopped and the data promptly downloaded. The tourniquet was then promptly released. Electrode placement for (a) WE and (b) AD.
Data collection
A Python program created using Jupyterlab Version 0.35.3 read in the resultant data file, consisting of time and 3 axes of acceleration. The component accelerations were combined into a total acceleration using the formula TotalAcceleration = √(〖XAcceleration〗^2+〖YAcceleration〗^2+〖ZAcceleration〗^2) (see Figure 2(a)). As can be seen in Figure 2(b), the peak and minimum for each evoked contraction can be determined by zooming in and hovering the mouse over each point. These values can be used to determine the peak to peak distance for each evoked contraction. In order to perform a peak-to peak calculation on every contraction performed during the protocol, the computer program was coded to identify the maximum and minimum values for each evoked contraction. Since the frequency of the stimulations are known and controlled via the stimulator’s automated protocol, the program was able to use a window of 75% of the stimulation period (0.5 s for 2 Hz, 0.25 s for 4 Hz, and 0.167 s for 6 Hz) and determine the minimum and maximum values over each window. The minimum and maximum over that window are assumed to be the minimum and maximum accelerations for the respective contraction. The minimum twitch acceleration was then subtracted from the maximum acceleration to give a peak to peak contraction height for each evoked contraction. The resultant peak to peak twitch heights were plotted over time to visualize the changes throughout the protocol (see Figure 2(c)). The mean of the resultant peak to peak contraction magnitudes were calculated for each stimulation period for comparison. (a) Contraction magnitude over entire protocol. (b) Contraction magnitude of a single twitch. (c) The minimum acceleration is subtracted from the peak acceleration of each twitch giving us the magnitude of acceleration for a given twitch. These are plotted over time to visualize how twitch acceleration is changing throughout the protocol.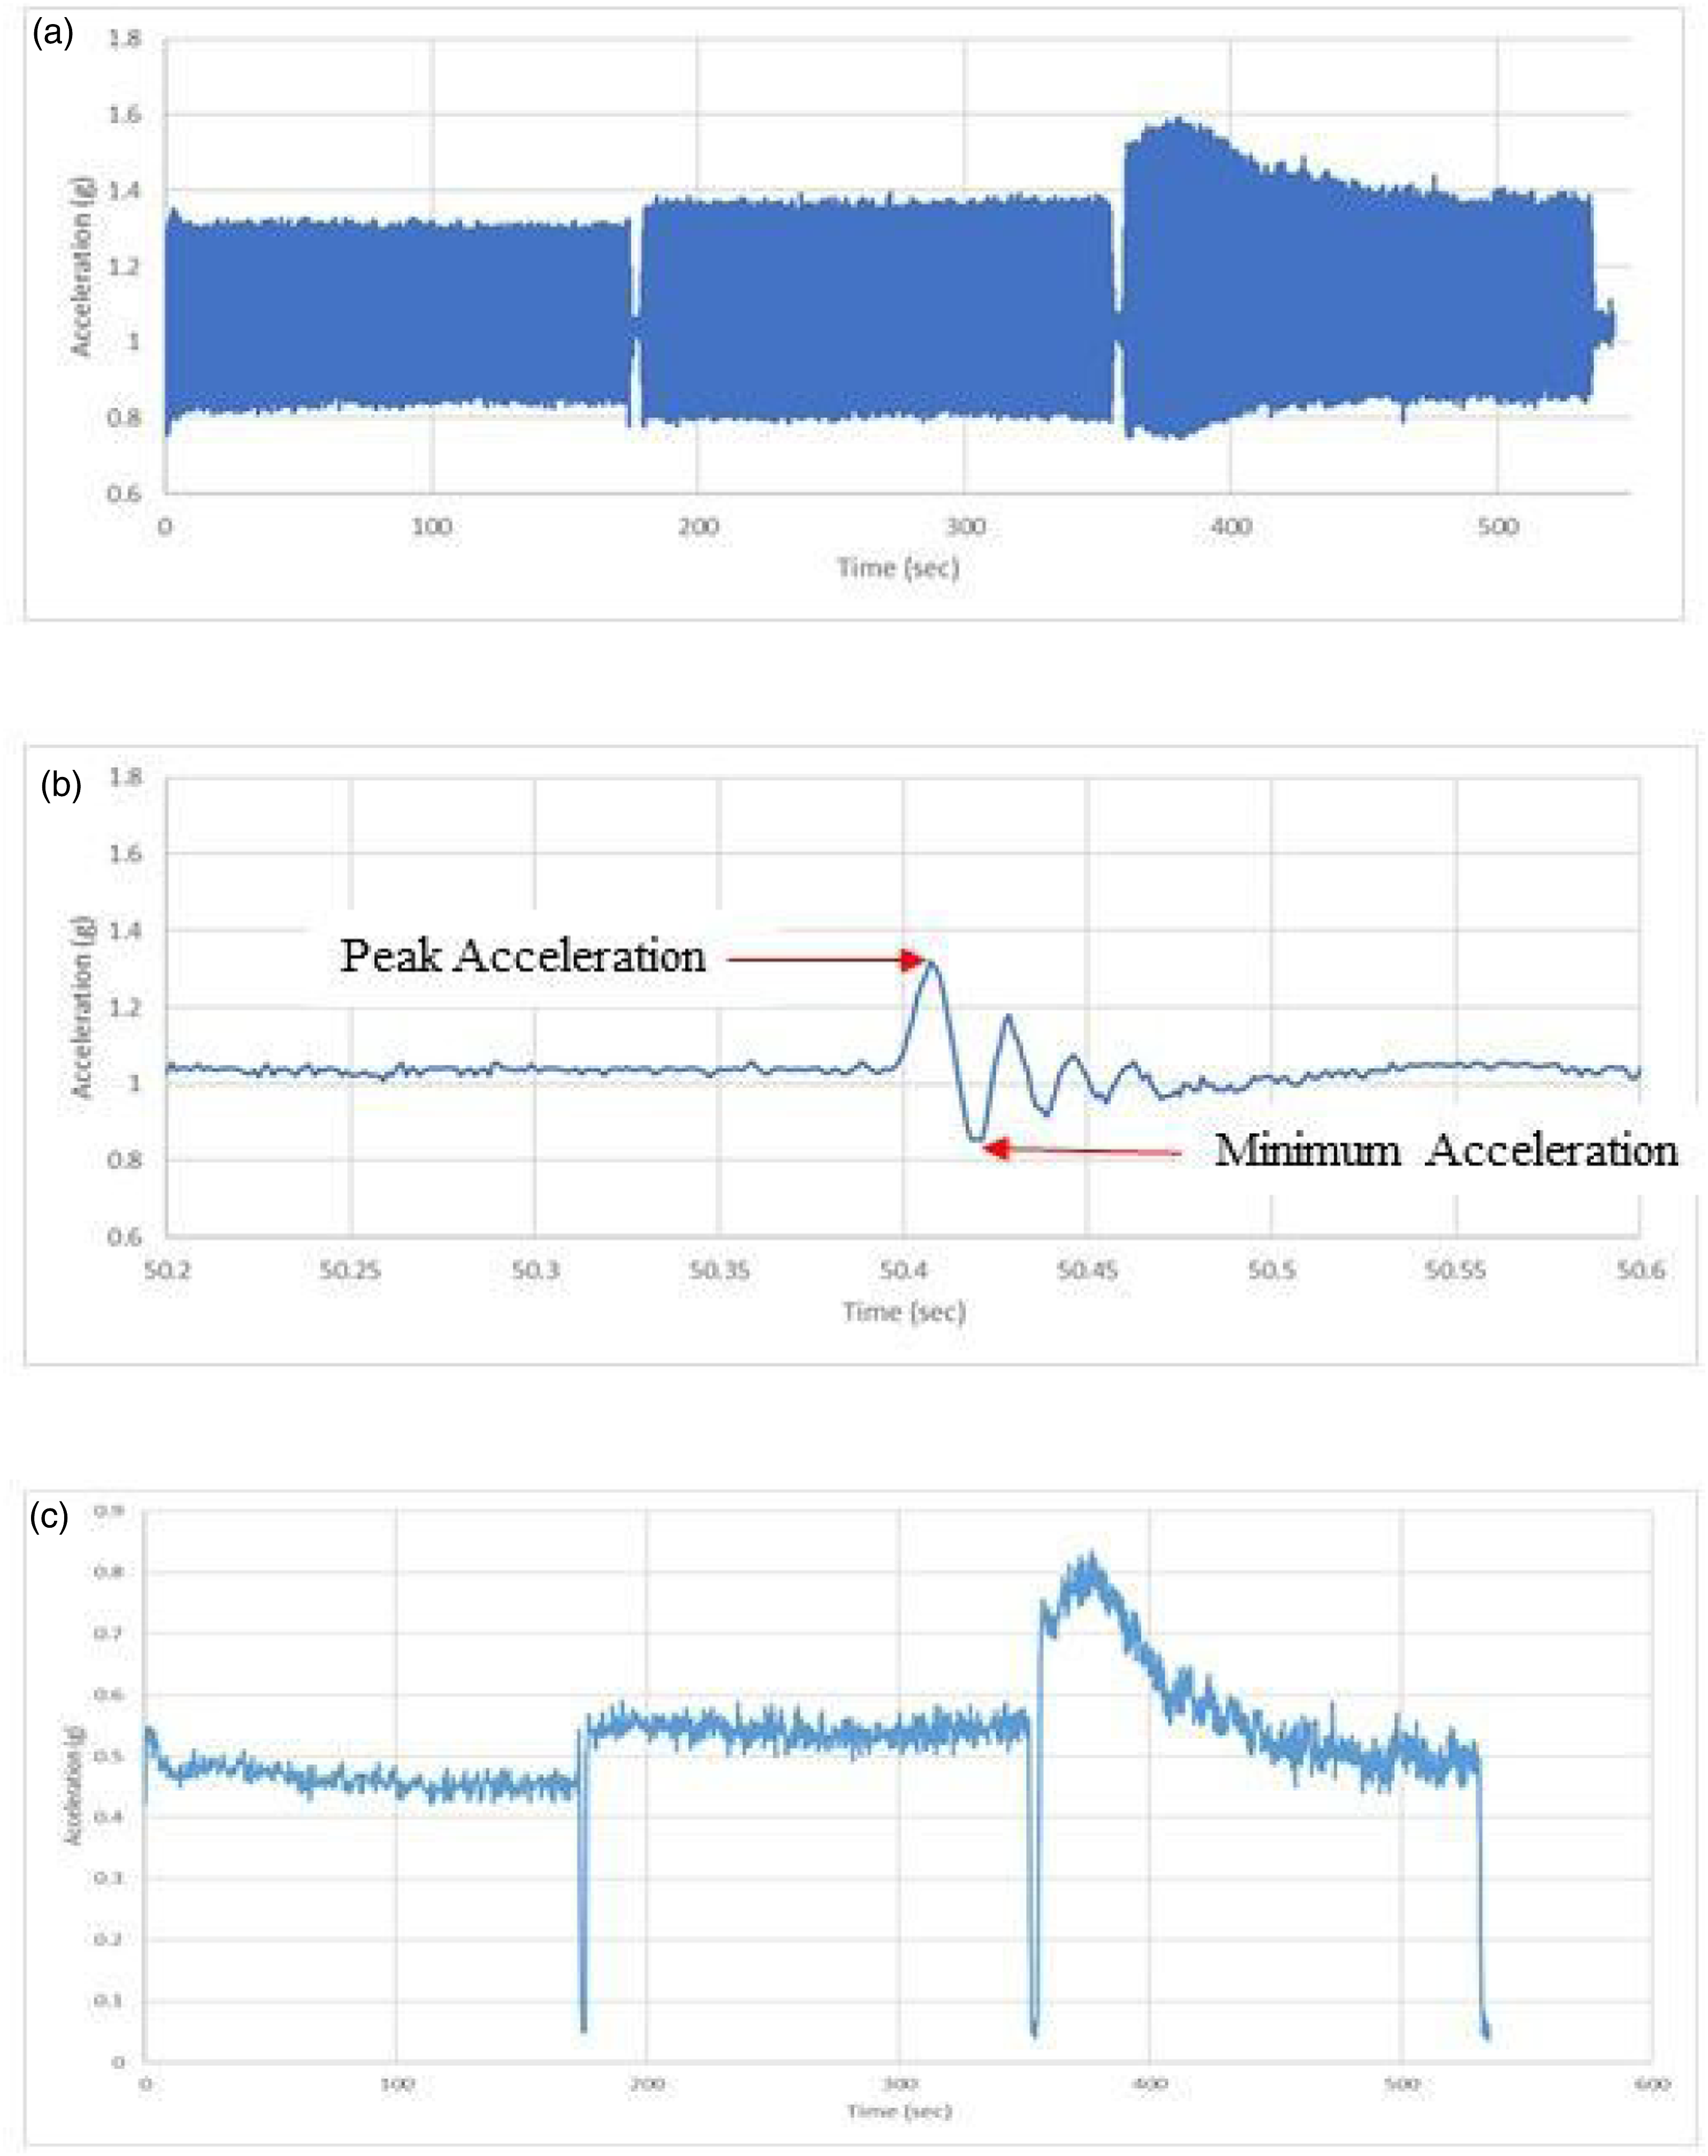
Analysis
The torque data from the Cybex Humac Norm Dynamometer and the acceleration data from the Axivity AX3 triaxial accelerometer were normalized to the peak contraction measurements. These values were averaged over the entire 3 min stimulation phase (2 Hz, 4 Hz, 6 Hz) for analysis. Averaging over the entire stimulation phase was done to retain as much information from the data as possible. The relationship between torque and acceleration during the intermittent stimulated fatigue protocol on the tibialis anterior was assessed using Pearson correlations. The data from the second experiment were not normalized. To determine whether the order of trials affected the measurements during the tourniquet experiment, a repeated measures analysis of variance (ANOVA) was performed on the mean contraction magnitude for each muscle with trial order being the between factor. A repeated measures ANOVA was performed separately for each muscle group (Ankle Dorsiflexors and Wrist Extensors) testing between the occluded and normal blood flow conditions on mean contraction magnitude over the three stimulation frequencies (2 Hz, 4 Hz, 6 Hz) to determine whether the application of the tourniquet affected mean contraction magnitude. Repeated measures ANOVAs were also performed separately on the normal blood flow, and tourniquet measurements between the ankle dorsiflexors and wrist extensors to determine differences based on the muscle. A Mauchly’s sphericity test was performed prior to each ANOVA with repeated measures. When sphericity was violated, a Huynh-Feldt correction was applied to results. If differences were detected, a simple main effects test was performed using a Bonferroni correction to determine the location of the differences.
Results
Correlation between torque and acceleration
The peak values during each trial were 2.29 ± 1.31 N•m for torque, and 9.57 ± 6.82 m/s2 and acceleration. The normalized acceleration collected from the accelerometer showed a strong correlation to the normalized force measurements collected by the dynamometer (R2 = 0.828; p < 0.001). The results from this experiment are shown in Figure 3. Scatterplot of mean normalized torque values and mean normalized acceleration for the three stimulation frequencies (2 Hz, 4 Hz, 6 Hz).
Fatigue measures with changes in blood flow
Trial order results
In the AD there were no differences based on the trial order (p = 0.890) with the first trial having an overall mean of 5.782 ± 1.382 m/s2 and the second trial having an overall mean of 6.056 ± 1.382 m/s2. A significant time effect was observed (p = 0.04), but no interaction was found (p = 0.778) between stimulation phase and order of the trials. In the wrist extensors there were no differences based on trial order (p = 0.997) with the first trial having an overall mean of 13.906 ± 1.577 m/s2 and the second trial having an overall mean of 13.916 ± 1.577 m/s2. There was a significant time effect (p = 0.001), but no interaction between time and trial order was found (p = 0.346). These data indicate there was no carry over effect from the first trial to the second trial.
Ankle dorsiflexion results
For the ankle dorsiflexion fatigue test, the tourniquet trial acceleration was found to be 4.70 ± 1.74 m/s2 lower overall compared to the normal blood flow trial (p = 0.015). A time effect was observed (p = 0.032) indicating that the 6 Hz stimulation period was lower compared to the 4 Hz stimulation period by 1.26 ± 0.33 m/s2. No significant interactions between time and blood flow condition were found (p = 0.119) (see Figure 4(a)). Mean contraction magnitude height for each stimulation period for tourniquet versus control for (a) AD and (b) WE. Mean twitch height for each stimulation period for WE versus AD are shown for (c) control and (d) tourniquet trials. Significant effects denoted with (*). Significant group effects denoted with (†) when interaction was not significant.
Wrist extension results
The mean contraction magnitude of the tourniquet trial was found to be lower across all three stimulation periods by 7.24 ± 1.66 m/s2 compared to the normal blood flow trial (p < 0.001). A significant time effect was found (p < 0.001) indicating the 6 Hz stimulation phase was overall reduced compared to the 2 Hz and 4 Hz stimulation phases by 7.68 ± 1.72 m/s2 and 5.13 ± 0.90 m/s2 respectively. A significant interaction between time and treatment was found (p = 0.001). The tourniquet 2 Hz phase mean contraction magnitude was not significantly lower compared to the non-tourniquet trial with a mean difference of only 0.48 ± 2.87 m/s2. The tourniquet trial 4 Hz and 6 Hz mean contraction magnitude were both significantly lower compared to the non-tourniquet trial by 8.54 ± 1.89 m/s2 and 12.71 ± m/s2, respectively (see Figure 4(b)).
Differences between muscle groups
The ankle dorsiflexors’ mean contraction magnitude during the control trial were found to be lower (p < 0.001) by 9.5 ± 2.0 m/s2 compared to the wrist extensors control trial. No time effect (p = 0.117) or interaction (p = 0.583) were observed (see Figure 4(c)). During the tourniquet trials mean contraction magnitudes of the ankle dorsiflexors were overall reduced (p < 0.001) by 6.94 ± 1.17 m/s2 compared to the wrist extensors. A time effect was found (p < 0.001) indicating mean contraction magnitudes were progressively reduced at each increasing frequency. The ankle dorsiflexors were significantly lower by 13.50 ± 1.55 m/s2 compared to the wrist extensors during the 2 Hz stimulation period. During the 4 Hz stimulation period the ankle dorsiflexors remained significantly lower than the wrist extensor acceleration by 6.84 ± 1.41 m/s2. By the 6 Hz stimulation period the differences were no longer significant (see Figure 4(d)).
Discussion
The results from this study show that the mean contraction magnitude measured by MMG was strongly related to torque over the three stimulation frequencies. These results are in line with previous studies showing a strong relationship between torque and MMG in other muscle groups.6,37,43,44 It is important to note that this correlation was found using values normalized to the peak contraction magnitude for both acceleration and torque respectively. This was done because the researchers wanted to remove differences in individual anatomy, such as leg length, that change the moment arm or angle of the joint and therefore torque. 45 In addition, due to the use of federally approved clinical devices that would be used in a hospital setting, we were unable to match the force and acceleration profiles of every individual muscle contraction. The U.S. Food and Drug Administration’s Guidance Document for Powered Muscle Stimulators limits the maximum power density of these devices to 0.25 W/cm2 based on the smallest electrode size available (Section 3 notes, paragraph 6, 1999). There was a limited ability to regress acceleration and torque values from the individual contractions produced during the protocol. Therefore, a mean contraction magnitude and torque over each stimulated frequency period was used to compare across all subjects in the first experiment. This first experiment provides some evidence that MMG data provides a valid approximation of skeletal muscle torque and/or the degree of weakness throughout the proposed constant current, intermittent fatigue protocol, but these results should be interpreted with caution since the sample size is small (n = 6).
In the second experiment, applying a tourniquet above the elbow resulted in significantly reduced contraction magnitudes for the 4 Hz, and 6 Hz stimulation periods compared to the control trial. A tourniquet applied above the knee resulted in overall reductions in contraction magnitude throughout the trial. Overall, the application of the tourniquet impaired submaximal evoked contractions. Prior to this study, we questioned whether our data would show any differences in muscle performance because the protocol used submaximal stimulations. These results suggest that the proposed assessment procedure could detect impaired muscle performance due to impaired blood flow. While we do not have measurements of maximal voluntary contractions to confirm the presence of fatigue, previous research indicates that occluding blood flow results in enhanced fatigue,24,25,27–30,46–48 and have also found that impairing blood flow results in enhanced fatigue during electrically induced contractions as evidence of fatigue intrinsic to the stimulated muscles.46,47 In light of these previous findings in combination with research that shows strong relationship between MMG amplitude and produced torque across various contraction types,49–52 we interpret the reduced evoked contraction magnitudes associated with the application of the tourniquet as a measurement of impaired muscle function resulting from fatigue stemming from occlusion. This supports previous findings which have shown that blood flow occlusion during exercise results in lower stimulated doublet force than just exercise alone. 46 The current study provides the first evidence that the proposed test can detect a functional change in skeletal muscle using MMG. The authors believe that confirming the validity of these assessments in a healthy population during periods of altered skeletal muscle function supports further investigation of the stimulated fatigue assessments in ICU patients. The proposed methods have potential to be a convenient and less expensive clinical test to assess skeletal muscle function throughout an ICU visit. Accelerometry data collected during stimulated assessments could be used to identify muscle weakness when it is present and determine if therapies are sufficiently improving patient outcomes. This further research in the clinical population is warranted before developing guidelines for assessment.
Prior studies have reported on differences between muscle groups using this fatigue protocol. Willingham & McCully compared carpal flexor fatigue indices against gastrocnemius fatigue indices, finding significantly greater fatigue in the forearm. 6 The present study found the non-occluded ankle dorsiflexor produced lower contraction magnitudes across all three stages of the fatigue protocol compared to the non-occluded wrist extensor contractions. These differences persisted after occluding the blood flow, but by the 6 Hz stimulation period the differences were no longer significant. A potential explanation for this finding could be due to the fiber type composition of the two observed muscle groups. Fiber type composition has been previously proposed to explain differences in MMG amplitude and mean power frequency between resistance trained and aerobically trained men during a fatigue protocol. 53 Research has shown high Type II fiber distribution in human tibialis anterior 54 while human digital and wrist extensor muscles have a relatively higher distribution of MHC I content. 55 In the current study, this may explain a more immediate onset of contraction magnitude depression in the occluded AD, where declines in contraction magnitudes of the occluded WE were more prevalent compared to control during in the second and third stages (i.e., 4 and 6 Hz). Given that this last stage (i.e., 6 Hz) occurred at approximately 6 minutes into the protocol, in combination with occlusion, it is likely that at this point there was a rapid onset of fatigue in lower threshold fibers of the wrist extensors. By the third stage during occlusion contraction magnitudes were not significantly different between the ankle dorsiflexors and wrist extensors. This demonstrates that the protocol can detect differences in occlusion-promoted contraction magnitude and therefore fatigue across skeletal muscles with varying characteristics (e.g., fiber type distribution). Future research would benefit from the use of muscle biopsy to evaluate the influence of fiber type composition on occlusion-induced stimulated fatigue response in clinical populations. It has been demonstrated that long periods of bed rest lead to a mismatched expression and production of MHC isoforms and a shift towards the Type II phenotype.56,57 Future research should determine how fiber type composition may influence fatigue during periods of occlusion in the clinical bedridden population.
The results showed no effect from the trial order on the average contraction magnitude. This confirms that any effects observed were due to the application of the tourniquet and not from any carryover fatigue from the previous trials. While it is possible the subjects may not have fully recovered in the 10 min between trials, this does not appear to have significantly affected the results.
Limitations
The low sample size and population during the torque and MMG measurements limits our ability to generalize these findings to clinical populations. Future research should collect torque and MMG data using this protocol to confirm these findings. The absence of maximal voluntary contractions during the tourniquet experiment limit our ability to confirm that fatigue was present in the entire muscle during the second experiment. This limits the ability to assess whether changes observed throughout the stimulation protocol reflect the total force production capability of the muscle or just a deficit present in the stimulated muscle fibers. Therefore, we interpret our findings to mean a functional deficit was detected within the fibers activated during the electrical stimulation protocol.
Previous research has suggested that increased subcutaneous fat can reduce MMG amplitude during both voluntary and non-voluntary contractions.58–60 This study recruited individuals who met the ACSM classification for low risk, to minimize any risks associated with tourniquet use. This may have had an unintended consequence of creating a subject pool with a more uniform distribution and lower overall subcutaneous fat than that of a clinical population. It is possible that differences in subcutaneous fat between the experimental muscle groups could have influenced MMG contraction magnitude during the assessment. Skinfold data for these sites were not recorded to test this limitation nor are the authors aware of previous research that has statistically compared skinfold differences in the forearm and tibia to determine the impact on stimulated torque or accelerometry reading. However, it should be noted that the use of a normalized contraction magnitude was used to compare the wrist extensors and ankle dorsiflexors which minimizes the effects of non-muscular physiological differences.
Conclusion
Data from this study indicate that an accelerometer measured muscle fatigue protocol using submaximal stimulation intensities is capable of detecting differences in muscle function between occluded and normal blood flow states in a healthy population. This could mean the proposed muscle test would be able to distinguish a clinically relevant change in muscle quality, but more research is needed to determine this. Based on the data it may be necessary to examine clinical data in a variety of reporting schemas to determine the best interpretation of test results. The use of these assessments would allow for evaluation of skeletal muscle function throughout a patient’s stay in order to evaluate the effects of therapies on ICU acquired weakness. Further research is needed to evaluate the use of the proposed stimulated fatigue test to identify ICUAW on bed-ridden ICU patients.
Footnotes
Author contributions
Conception or design of the work: KB, LC. Acquisition, analysis, or interpretation of data for the work: EA, JL, KB, LC, CR. Drafting of the work or revising it critically for important intellectual content: EA, JL, KB, CR. Approved the final version of the manuscript: EA, JL, KB, LC, CR. Agree to be accountable for all aspects of the work in ensuring that questions related to the accuracy or integrity of any part of the work are appropriately investigated and resolved: EA, JL, KB, LC, CR. All persons designated as authors qualify for authorship, and all those who qualify for authorship are listed: EA, JL, KB, LC, CR.
Author’s note
Some data from this manuscript was published in an abstract for the Military Health System Research Symposium 2020.
Declaration of conflicting interests
The author(s) declared no potential conflicts of interest with respect to the research, authorship, and/or publication of this article.
Funding
The author(s) received no financial support for the research, authorship, and/or publication of this article.
Informed consent
We confirm that we have read the Journal’s position on issues involved in ethical publication and affirm that this report is consistent with those guidelines.