
Abstract
It is important to assess the suitability of mobility aids before prescribing them to patients. This assessment is often subjectively completed by a therapist and it often includes a variety of basic practical tests. An objective assessment of a patient's capability, which captures not only speed of task completion and success, but also accuracy and risk of manoeuvres, would be both a fairer and safer approach. Yet until now such an assessment would have been cost-prohibitive, especially in low resource settings. We pave the way towards this end goal, by describing, validating and demonstrating a low-cost computer vision based system called MoRe-T2 (mobility research trajectory tracker). The open-source MoRe-T2 system uses low-cost off-the-shelf webcams to track the pose of fiducial markers, which are simply printed onto regular office paper. In this article, we build upon previous work and benchmark the accuracy of MoRe-T2 against an industry standard motion capture system. In particular, we show that MoRe-T2 achieves accuracy comparable to CODA motion tracking system. We go on to demonstrate a use case of MoRe-T2 in assessing wheelchair manoeuvrability over a relatively large area. The results show that MoRe-T2 is scalable at a much lower cost than typical industry-standard motion trackers. Therefore, MoRe-T2 can be used to develop more objective and reliable assessments of mobility aids, especially in low-resource settings.
Introduction
Traditionally, a mobility aid such as a wheelchair is prescribed by a therapist following the therapist's subjective evaluations of a patient's performance in using the mobility aid. These subjective evaluations of a patient's performance may include the level of comfort level when using the aid and the magnitude of effort that was used to complete a given task. Objective evaluations are also used by therapist in prescribing mobility aids such as measurements of how fast the patient performs a task with the given aid. Objective evaluations although very important may be costly to perform because the required equipment is often very expensive.
In this article, we propose a low-cost tracking toolkit called the mobility research trajectory tracker (MoRe-T2) for objectively assessing the use of mobility aids. MoRe-T2 is a computer vision-based system that lets us track the trajectories people make when using mobility aids. The tracked trajectory can reveal information about a patient's performance such as the total distance travelled, velocity or accuracy during an assessment test. Such information can be otherwise expensive to reliably obtain especially in a low-cost clinical setting.
MoRe-T2 works by tracking the position and orientation of fiducial markers (that are printed on paper), using low-cost cameras such as web cameras or IP cameras. 1 The affordability of the required hardware (which will be discussed in the following section on related work) means that MoRe-T2 is inexpensive to deploy. As a result, MoRe-T2 is economically feasible to cover larger areas unlike alternative tracking toolkits such as the Cartesian optoelectronic dynamic anthropometer (CODA; www.codamotion.com) motion analysis system (Charnwood Dynamics Ltd, Leicestershire UK) or the Vicon tracking system (Vicon Motion Capture Systems, www.vicon.com).
In the next section, we provide an overview of other tracking systems from the literature and compare their implementation with that of MoRe-T2. In the following section, we provide an overview of how MoRe-T2 is set up and in particular the improvements in the setup procedure from our last work. We then validate MoRe-T2 by comparing its tracking performance with that of CODA. In the last section, we demonstrate MoRe-T2 tracking motion over a large area in a study to compare driving performance when using several input interfaces to control a wheelchair.
Related work
Several industry standard tracking systems have been used to track motion in clinical settings. In particular, CODA has been used extensively to study gait in rehabilitation,2–4 in sports science and in other applications.5–7 Another tracking system, Vicon, has also been used to track human motion in various settings.2,8–13
CODA is a tracking system that uses cameras to track active infrared markers, whereas Vicon is a tracking system that uses cameras to track passive reflective markers. CODA's active markers are uniquely identifiable but require adequate battery life to last through the time needed for motion capturing. Active markers also need a charging system, which is an additional hardware to the tracking system.
On the other hand, Vicon's passive markers are not uniquely identifiable. The system continuously measures changes in all labelled markers to estimate their positions over time. The disadvantage here is that when the system loses track of a certain marker at a particular time, the marker needs to be manually labelled again so that it is identifiable at future points in time. Also, reflective surfaces in the background can be mistaken for a marker. On the positive side, passive markers do not require additional hardware for charging. MoRe-T2 uses passive uniquely identifiable markers that provide the advantage of both active and passive markers whilst offering none of the disadvantages mentioned. However, the disadvantage of MoRe-T2's markers is that they require a significantly larger surface area than either CODA or Vicon markers. This requirement increases the chances that a marker is occluded by any moving part of the tracked person or assistive technology. MoRe-T2 also requires manual realignment of trajectories in a post-processing step (which will be discussed in the Trajectory Post-Processing sub-section).
The major feature that distinguishes CODA and Vicon from MoRe-T2, which uses ordinary cameras is that they both operate at high frame rates (>100 Hz) enabling them to capture high speed motion. However, both of these tracking systems are very expensive to use, 14 whilst MoRe-T2 is readily affordable. There exists however, a tracking solution more affordable than CODA and Vicon but more expensive than MoRe-T2 that offers 100 Hz frame rate for high speed tracking called the OptiTrack (www.optitrack.com). OptiTrack can use both active and passive markers and it has been validated as having accuracy comparable to the Vicon but only over a short range (<15 cm). 15
Another low-cost tracking solution is the Kinect. Kinect has been used in several studies for tracking human motion.16–19 However, these studies used marker-less tracking that employed specific models that can only be applied to parts of human body. Thus, Kinect-based tracking to our knowledge is currently inaccessible to tracking arbitrary objects. Moreover, marker-less tracking is often less accurate than marker-based tracking. 20 More specifically, Kinect's accuracy was not found acceptable for clinical measurement analysis. 21
A popular low-cost tracking software that tracks markers is called ARToolkit/ARToolkitPlus. We use this software at the core of tracking MoRe-T2's markers and it has been employed in several other tracking projects. 22 ARToolkit/ARToolkitPlus has been successfully used in large scale tracking where the markers were placed in fixed positions whilst several cameras were attached to the moving object.23,24 This method, however, is costly to implement when tracking many objects as each object will require several cameras to be attached to it. MoRe-T2s approach is much more cost effective, where several cameras are placed at fixed positions and several markers are attached to the objects to be tracked.
Cost comparison of MoRe-T2 against several existing tracking systems. The information for Vicon is given in Carse et al. 15

System set-up
This section discusses the changes in MoRe-T2's set-up from our initial work. In particular, we have improved the calibration procedure for cameras that produces distorted images. This improved procedure enables us to track motion more accurately over larger areas using fewer cameras. We have also implemented a post- processing technique that improves tracking accuracy in addition to correcting image distortion. We will begin, however, by giving an overview of the MoRe-T2's system.
Overview of MoRe-T2's set-up
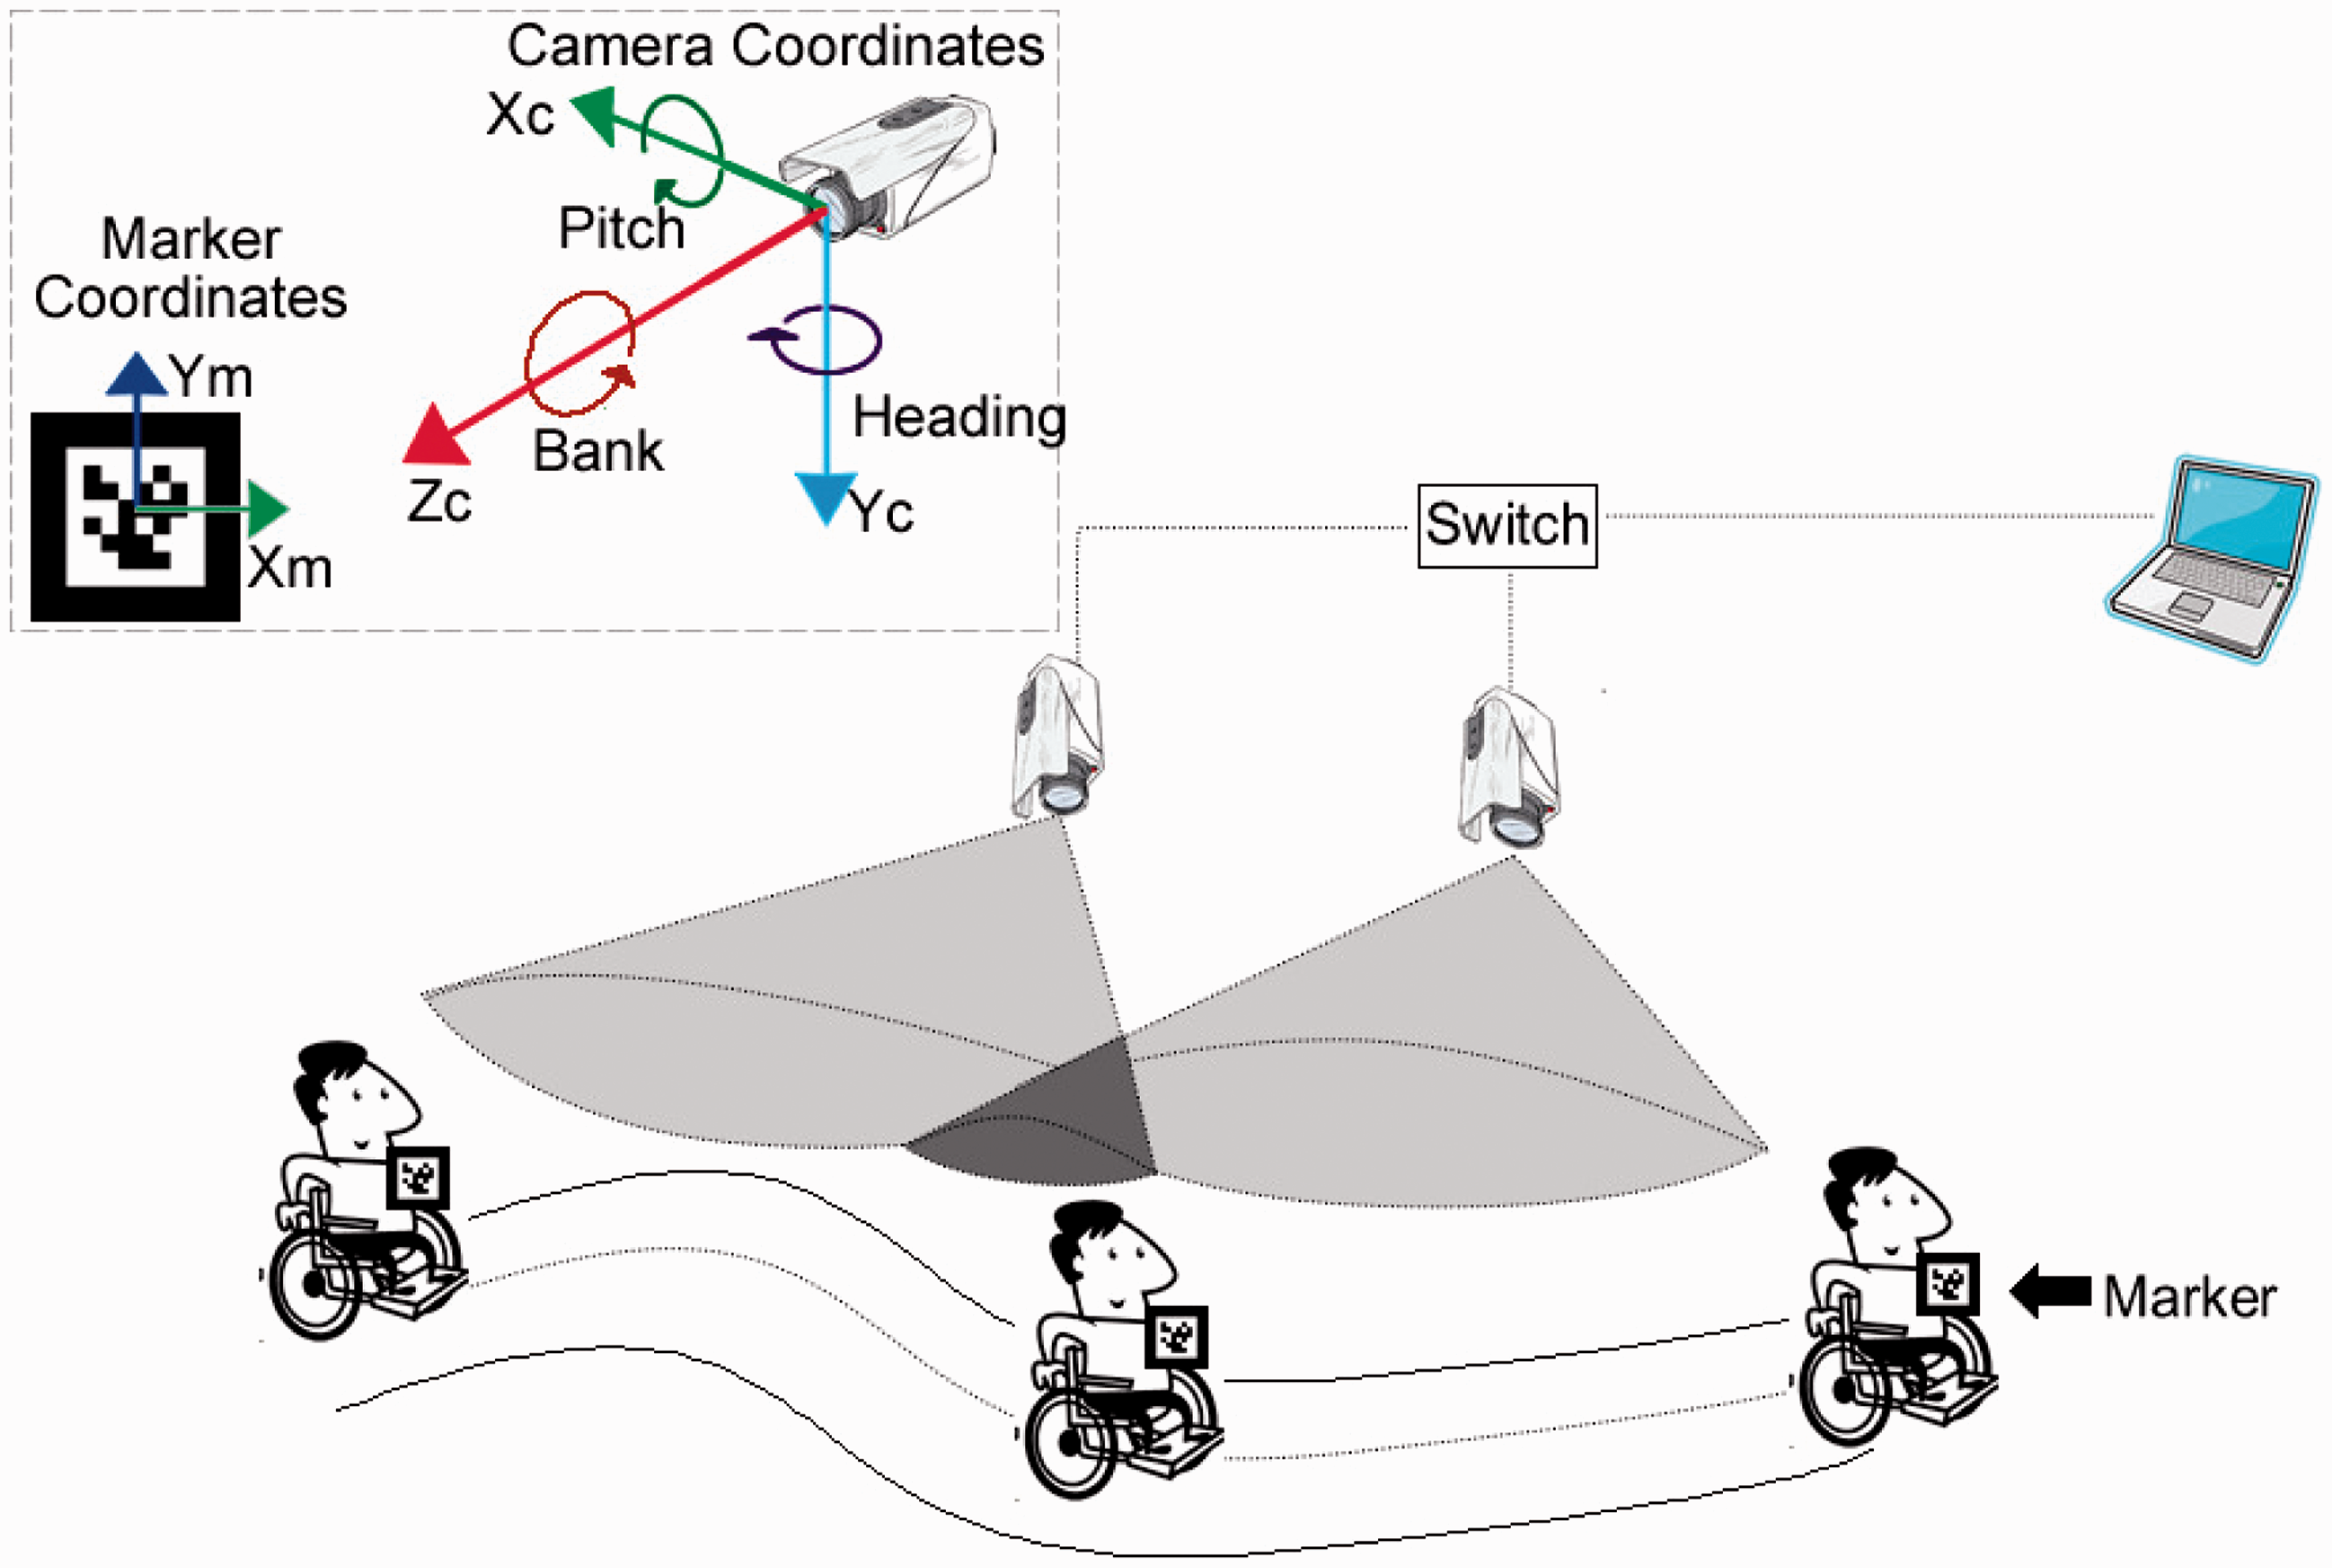
MoRe-T2's setup consists of at least a laptop, almost any inexpensive camera (e.g. USB camera or IP camera) and a fiducial marker (Figure 1). MoRe-T2 works by providing time-stamped 3D position and orientation information of fiducial markers and these markers can be attached to the objects to be tracked (Figure 1). MoRe-T2 markers have unique patterns that allow the ARToolkitPlus library to detect both the position and orientation of the marker from a recorded video of the scene to give real-world measurements.
22
When more than one camera is needed to track motion, MoRe-T2 has procedures to estimate the pose of all the cameras used so that they will all give trajectory results within the same coordinate frame.
The general set-up for MoRe-T2 using two IP cameras connected via a network switch to a laptop. The laptop records videos of a wheelchair and its driver with a MoRe-T2 fiducial marker attached onto the wheelchair. Also shown are the coordinate systems of MoRe-T2's camera and its marker.
1
As shown in Figure 2, using MoRe-T2 begins with a one-time a one-time calibration to ensure that distortions in the lenses of all cameras are properly compensated for. The poses of all cameras are then transformed to the same coordinate frame through a process that estimates each camera's pose in relation to a common point of origin and axis. After the calibration is completed, the system is now ready for recording the desired motion. After recording, MoRe-T2 post-processes the video of the recorded motion to generate trajectories. We have made substantial improvements to the calibration stage and the post-processing stage from our original implementation of MoRe-T2.
Workflow showing procedure sequence for using MoRe-T2
Improved calibration
MoRe-T2 relies on a well-calibrated camera, amongst other requirements, to yield accurate trajectory results. (A list of all the requirements are found in Ezeh et al. 1 ) In fact, for cameras with significant curvature, calibration appears to be the single most important factor affecting accuracy of results.
In our previous work, we used the GML camera calibration toolkit to obtain intrinsic and extrinsic parameters from a camera that would be given to the ARToolkitPlus library,
25
allowing the library to account for distortions in the camera's image. We found that when estimating a marker's position from videos showing significant distortions, the ARToolkitPlus did not adequately compensate for distortions and consequently produced very inaccurate pose estimates regardless of the camera parameter given to software (Figure 3(c)). This phenomenon is most applicable to a camera's wide angle lens as they usually produce images with significant distortion.
Comparison of results from tracking a straight horizontal movement using two different techniques for calibrating cameras. In one technique, GML calibration toolbox estimates camera parameters from the original image (a) and produces a curved line (c). In the better technique, image distortion is first corrected (b) using Matlab computer vision toolbox and this produces a straight line (d).
Hence, to make MoRe-T2 compatible with wide angle cameras (but not fisheye cameras at the moment), we currently use Matlab's computer vision system toolbox to first estimate camera parameters. This estimation also takes into account distortions such as skew. Instead of feeding estimated parameters to the ARToolkitPlus, we corrected the distortion in the recorded video of the scene using the estimated parameters and the Matlab toolbox. We then supply ARToolkitPlus library with constant camera parameters that represent no distortion and this approach produced more accurate trajectory results (Figure 3(d)). We created a specialised program to correct image distortion using Matlab. The program was compiled and run as a standalone application independent of Matlab.
Trajectory post-processing
Despite the steps taken when calibrating MoRe-T2 to produce accurate results, trajectories of a marker produced from different cameras at the same point in time may not be aligned exactly (Figure 4(a)). This misalignment could be caused by errors introduced when estimating the camera's pose or could be caused by the residual errors when correcting for image distortion. Regardless, we can further reduce these errors by orthogonally transforming the trajectory measured from some cameras so that, where camera views overlap, the trajectories are aligned to fit closely (Figure 4(b)).
Comparison of (a) the trajectory result when trajectories are shown as measured by all cameras versus (b) the trajectory modified to compensate for errors in the cameras pose estimation, by ensuring that overlapping trajectories from the different cameras are aligned as closely as possible.
To find the optimal transformation from overlapping points in camera A to points in camera B, we use a procedure detailed by Ho. 26 The person using MoRe-T2 will have to choose cameras A and B manually from the set of cameras that show misalignment. Moreover, points from all cameras whose poses were estimated from camera A will need to be transformed along with points from camera A. This transformation should be done because errors that cause misalignment carry over to the poses of cameras estimated from camera A's pose and consequently to the trajectories of those cameras.
We will now discuss the experiment we performed to verify that, with the help of our improved camera calibration and trajectory post-processing, MoRe-T2's accuracy is comparable to that of CODA.
Method
This section discusses the experiment setup to characterise and compare MoRe-T2's accuracy and precision using our improved setup with CODA's accuracy and precision. We performed two separate sets of experiments: one to characterise static errors (i.e. errors associated with stationary markers) and the other to characterise dynamic errors (i.e. errors associated with moving markers).
Characterising static errors
Static errors were characterised separately for MoRe-T2 and CODA. For MoRe-T2 experiments, we placed the markers so that they are just visible from a corner of the camera's view. Since this area of a camera contains the greatest distortions, and thus the greatest errors in tracking trajectories. Showing that MoRe-T2 tracks accurately in regions covered by a corner of a camera would be convincing evidence of MoRe-T2's validity.
First we determined the errors in the X-Y plane. We simply place two markers at known distances apart and measure the mean and standard deviation of the distance recorded by both tracking systems. Since it is difficult aligning a marker's axis to a camera's axis, we simply found an upper-bound in errors along the X-Y plane, given by the errors in distance measurement in the X-Y plane. We chose the X-Y plane partly because from our observation, the X and Y axis had similar error but these errors were significantly different from those in the Z-axis.
Secondly, we determined the errors in the Z-axis. To do this, we place two markers at different known heights (i.e. distance in the camera's Z axis). We then performed a similar analysis to the first experiment on the Z-axis measurements.
Lastly, we determined the errors in the orientation by taking several recordings of a marker. Before each recording, the marker's roll angle was changed a known angle by rotating it in the X-Y plane (or around the cameras Z axis). We performed similar measurements to analyse the Pitch angle. Since the errors are similar in MoRe-T2s X- and Y- axes, it can be assumed that errors in pitch, which is the angle about the cameras X-axis, behave similarly to errors in yaw, which is the angle about the Y-axis.
To characterise static errors along CODA's X, Y and Z axes, we measured how well the real world distance between two CODA markers matched that measured along each axis. To obtain the real world distance along a specific axis, we align the direction of the line between two markers with that axis. We assumed that the axis of a CODA scanning unit is parallel to the rectangle sides of the scanning unit. To characterise static errors in estimating orientation using CODA, we placed three markers on a board at known distances from each other to form a planar triangle. We then calculate the angles of this triangle using the cosine rule, similar to what was done by Richards. 27
Unlike with MoRe-T2, we placed the CODA markers within the scanning units' detection range to obtain the best results for the CODA. Thus our comparison is between results obtained from tracking at MoRe-T2's worst region of view and CODA's normal region of view.
Characterising dynamic errors
To characterise dynamic errors in MoRe-T2, we tracked the trajectory generated by a line following robot (the Pololu 3pi robot, www.pololu.com/docs/0J21) using both the MoRe-T2 and CODA simultaneously. The robot moved continuously along a predefined rectangular shaped line path (Figure 5) with both a single CODA marker and MoRe-T2 marker attached onto the robot. We then compared the accuracy of the resultant path measured by MoRe-T2 and by the CODA system.
Experiment setup showing a rectangle line on the floor that defines the path the line following robot travelled. Six MoRe-T2 IP cameras attached on the ceiling and two CODA markers were used to track the motion of the robot with the help of CODA and MoRe-T2 markers attached on the robot.
Two CODA scanning units and six cameras for MoRe-T2 (we chose Trendnet TV-IP310pi, but most other cameras could be used) were used in this experiment although four MoRe-T2 cameras were sufficient. The reason for having six MoRe-T2 cameras was to see if tracking errors were significant for as many cameras as we could use whilst being limited by the size of the experiment area, as dictated by the CODA system. A camera's pose estimated from another camera's pose will include errors that should increase as more camera poses are estimated from previously estimated camera poses in a chain sequence. These errors should appear as imperfect alignments of overlapping trajectories seen from different cameras.
It is important to note that the major plane of motion for this particular experiment is the X-Y plane for MoRe-T2 that was also the X-Y plane of the camera whose pose was chosen as the origin of MoRe-T2's coordinate system. Similarly for the CODA, the major plane of motion is also the X-Y plane given by the default axis of one of its scanning units.
To analyse the robot's rectangular trajectory obtained by both MoRe-T2 and CODA, we fitted measurements of each side of the rectangular trajectory to a best fit straight line using singular value decomposition. The standard deviation of position measurement was taken to be the standard deviation of the error between measurements of each side of the rectangular trajectory generated and the corresponding best fit line. Since the robot's orientation shouldn't change when it moves on a straight line, the standard deviation of orientation measurements was taken to be the standard deviation of the error between orientation measurements of each side of the rectangular trajectory and the average orientation for that side of the rectangular trajectory.
Accuracy in position was obtained by comparing the length of the sides of the rectangle formed by the best fit line against the length of the sides of the actual rectangular line path that the robot followed. Accuracy in roll angle was obtained by computing the difference in the average roll angles at vertices of the best fit rectangle generated from the tracked trajectory. The angles at the vertices were compared to 90 °, which is the expected angle between two adjacent vertices of a rectangle.
Finally, to characterise dynamic errors in orientation estimate using CODA, we followed a procedure similar to estimating CODA's static errors in orientation. The difference is that instead of keeping markers stationary, we moved them around.
Results
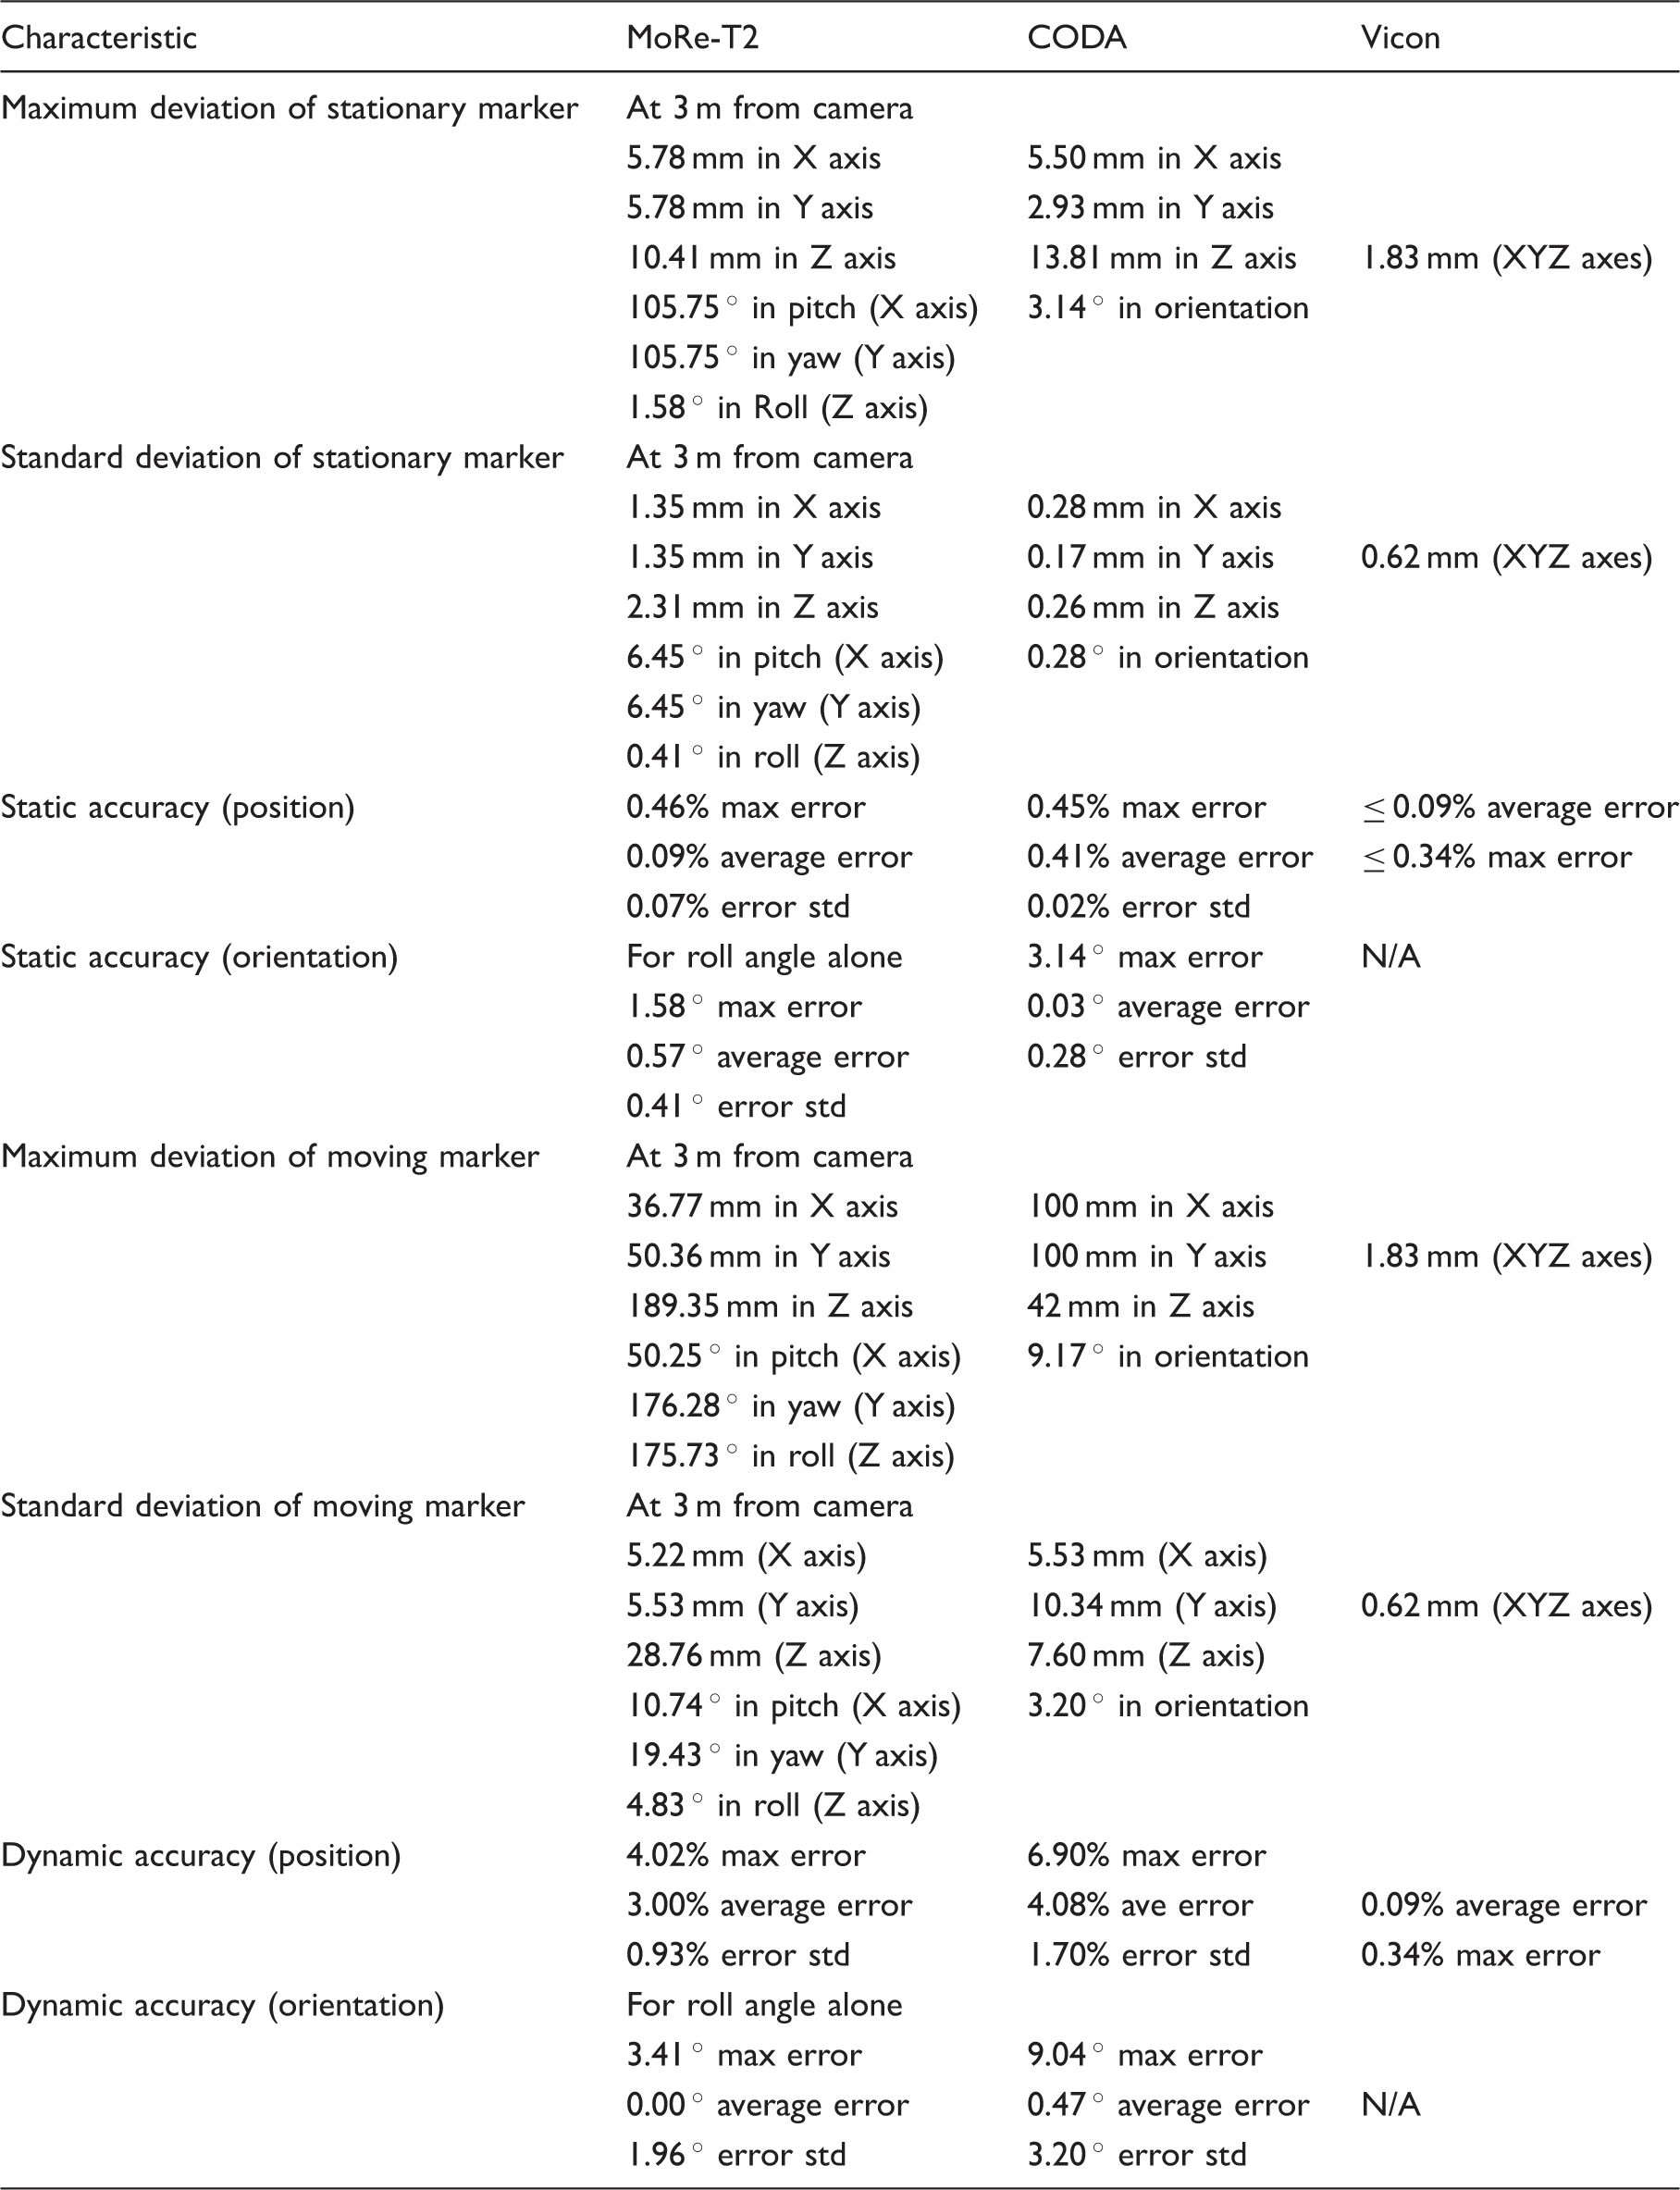
We have validated MoRe-T2 against an industry standard tracking system, the CODA, which we have in our lab. MoRe-T2 achieved static accuracy in position (mean: 0.09%, SD: 0.07%) that were significantly smaller (p < 0.01) than those of CODA (mean: 0.41%, SD: 0.02%) when measuring a distance of 1.2 m (Figure 6). However, MoRe-T2's dynamic accuracy in position (mean: 3.00%, SD: 0.93%) were of comparable magnitude (p = 0.0102) to those of the CODA (mean: 4.08%, SD: 1.7%) at a significance level of 0.01 (Figure 7). At a significance level of 0.05, MoRe-T2's dynamic errors would be significantly smaller than those of CODA. The complete results are detailed in Table 2.
Comparison of accuracy (percentage error) in measuring distance using static markers for MoRe-T2 and CODA showing significant difference (p < 0.01). The error was obtained from comparing the distance between two markers to the ground truth. Comparison of dynamic accuracy (percentage error) in position for MoRe-T2 and CODA showing no significant difference in accuracy (i.e. p > 0.01). The error was obtained from comparing length of the robot's rectangular trajectory to the ground truth. Comparison of performance between MoRe-T2, CODA and Vicon.

Static error result
MoRe-T2's static errors had maximum values for X-Y-Z-pitch-yaw-roll of 5.78 mm, 5.78 mm, 10.41 mm, 105.75 °, 105.75 ° and 1.58 ° and standard deviations of 1.35 mm, 1.35 mm, 2.31 mm, 6.45 °, 6.45 ° and 0.41 ° (Figure 8).
Comparison of static errors in the X, Y, Z axes of the CODA and MoRe-T2 obtained by subtracting CODA measurements from the known real-world distances.
CODA's static errors had maximum values for X-Y-Z-orientation of 5.50 mm, 2.93 mm, 13.81 mm and 3.14 ° and standard deviations of 0.28 mm, 17 mm, 0.26 mm and 0.28 °. In terms of percentage accuracy in measuring distances, MoRe-T2 had a maximum percentage error of 0.46% whilst CODA's had a maximum percentage error of 0.45% (Figure 9). To calculate accuracy, we simply compared the distance measured by both tracking systems with the ground truth of 1.2 m.
Comparison of static errors in orientation for MoRe-T2 Pitch/Yaw angle (M Pitch/Yaw), MORe-T2 Roll angle (M Roll) and CODA angle (C Angle). All MoRe-T2 errors in orientation were significantly different (p < 0.01) from CODA errors in orientation.
In general, MoRe-T2 was more accurate than the CODA in estimating position of static marker but it suffered more variance in its estimates than CODA did.
Dynamic error result
Although MoRe-T2's dynamic accuracy in position was not significantly different from that of CODA, its dynamic accuracy in the roll angle was significantly better (p < 0.01) than CODA's dynamic accuracy in orientation. MoRe-T2 had at most 4.02% error in estimating the position of a moving marker and at most 3.41 ° error in estimating roll angle of a moving marker. CODA had at most 6.9% error in estimating the position of a moving marker and at most 9.04 ° error in estimating the orientation of a moving marker (Figure 10). Unlike our previous work where we only looked at errors in position over a short distance using CODA as the ground truth, here CODA is not used as the ground truth and is itself investigated for accuracy.
Comparison of dynamic errors in orientation for MoRe-T2 pitch angle (M pitch), MoRe-T2 yaw angle (M yaw), MoRe-T2 roll angle (M roll) and CODA angle (C angle). All MoRe-T2 errors in orientation were significantly different (p < 0.01) from CODA errors in orientation.
MoRe-T2's errors when measuring a moving marker had maximum values for X-Y-Z-pitch-yaw-row of 36.77 mm, 50.36 mm, 189.35 mm, 50 °, 176.28 ° and 175.73 ° and standard deviations of 5.22 mm, 5.53 mm, 28.76 mm, 10.74 °, 19.43 ° and 4.83 ° for angles, respectively. CODA's errors when measuring moving markers had maximum X-Y-Z-orientation values of 100 mm, 100mm, 42 mm and standard deviations of 5.53 mm, 10.34 mm, 7.60 mm and 9.04 °. Our CODA errors are consistent with those measured by Richards. 27
To compare our system with Vicon, we consider its reported performance from the literature since we did not have access to a Vicon system. Vicon was reported to have a maximum error of 1.83 mm with standard deviation of 0.62 mm when measuring distance in the same study that reported CODA errors similar to what we obtained. 27 This error measurement can be viewed as an upper bound on the errors along each axis. Also, like CODA, Vicon only measures position and so errors in orientation can be estimated from position measurements.
Figure 11 shows deviations in the X, Y and Z axes from the best fit line when the marker was moving. We see that for the X and Y axes, MoRe-T2 has both lower variances in error and lower absolute errors than CODA. Conversely, along the Z axis MoRe-T2 has higher variance in error and higher absolute error than CODA.
Comparison of dynamic errors in position for the X, Y, Z axes of the CODA and MoRe-T2 obtained by calculating standard deviation from the best fit line of the sides of the rectangle (2880 mm × 3100 mm). Errors in moving markers are significantly different for the two tracking systems along all axes (p < 0.01).
In general, by using Matlab's computer vision system toolbox, we were able to reduce MoReT2 errors to magnitudes less than or comparable with those of the CODA system. This outcome is a remarkable achievement given that the CODA, which has been validated and used extensively is much more expensive than MoRe-T2. The performance in MoRe-T2 and the CODA that we measured are detailed in Table 2.
Discussion
Our results tell us that for MoRe-T2, the X-Y plane is the best plane along which to measure movement. For example, with a MoRe-T2 camera mounted on a ceiling facing straight downwards, a surface perpendicular to the camera's forward direction or Z axis (e.g. a flat floor) is the best plane for measuring motion. Also, the Roll angle, which is rotation about the camera's Z axis, provides the most accurate orientation. Furthermore, it is safe to say that MoRe-T2's yaw and pitch estimations are not reliable given their very large maximum deviations (almost 180 °!) and high standard deviations for both stationary and moving markers.
There were some limitations in our study. The robot we used tracked straight lines very well at a steady speed without wobbling as it used a PID control algorithm for its line following. However, it did not turn perfectly sharp along the corners of the rectangular path but it turned quick enough to begin moving in a straight line shortly after crossing a corner. As a result, we ignored the rounded trajectory edges in our analysis.
The dynamic error measurements of both the CODA and MoRe-T2 depended on having lines that best fit the sides of the rectangular path. For MoRe-T2, however, we found that although the best fit lines formed connected rectangles in the X-Y plane, two vertices of the best fit rectangle were irreconcilably separated by about 56 mm in the Z axis. This separation in the Z axis is primarily caused by a camera typically having larger errors in its Z axis. 28 Even in Table 2 we see a much larger variance in MoRe-T2's Z axis than in its other two axis. CODA shows much more variance along its X-Y plane than MoRe-T2 does and its Z axis shows a significant variance in measurement given that the robot did not move much along the Z axis.
Also in Table 2, we stated that static accuracy in orientation for both MoRe-T2 and CODA were the same as results for maximum and standard deviation. However, this equivalence did not hold for MoRe-T2's dynamic accuracy in orientation but it holds for CODA's dynamic accuracy in orientation. The reason is that both angular deviation of stationary marker and consequently angular accuracy were computed from ground truth whereas angular deviation of MoRe-T2's moving marker was computed differently from its angular accuracy. Angular deviation of MoRe-T2's moving marker was computed from the mean along the straight line trajectory of the robot whilst dynamic accuracy was computed as the difference between the angle at the corner of the best-fit rectangle and 90 °.
Dynamic accuracy for MoRe-T2's roll angle (i.e. angle about the camera's Z axis) was evaluated only for a single angle (90 °), which should be taken as a support but not an absolute validation that the system's roll angle measurements are sound. A more detailed analysis of orientation measurement for moving markers that also accounts for the pitch and yaw angles is left for further investigation. Finally, MoRe-T2's errors for moving markers are larger than errors for stationary markers.
Application: Evaluating interfaces for wheelchair control
As an example application, MoRe-T2 is used to track and analyse the different trajectories made when wheelchair users drive with different interfaces for wheelchair control. These interfaces are the joystick, three-switch head-array and sip/puff switch.
Here, seven cameras were used to cover the assessment course that spanned 8.4 m × 7.2 m (Figure 12) and was set up at UCL Pedestrian Accessibility Mobility and Environment Laboratory (PAMELA). For such a large area to measure, CODA or Vicon would prove to be very expensive to setup and so we only used MoRe-T2. The assessment course contained a varied range of task taken from the clinically validated Wheelchair Skills Tests that a typical wheelchair user might be required to perform in his/her daily life and these tasks included driving through cross slopes, curbs and inclines.
29
Assessment course used to compare control interfaces (joystick, head-array and sip/puff switch) by evaluating user's driving performance when using the interfaces to complete various tasks. The tasks are similar to those a regular wheelchair user may perform in his/her daily life.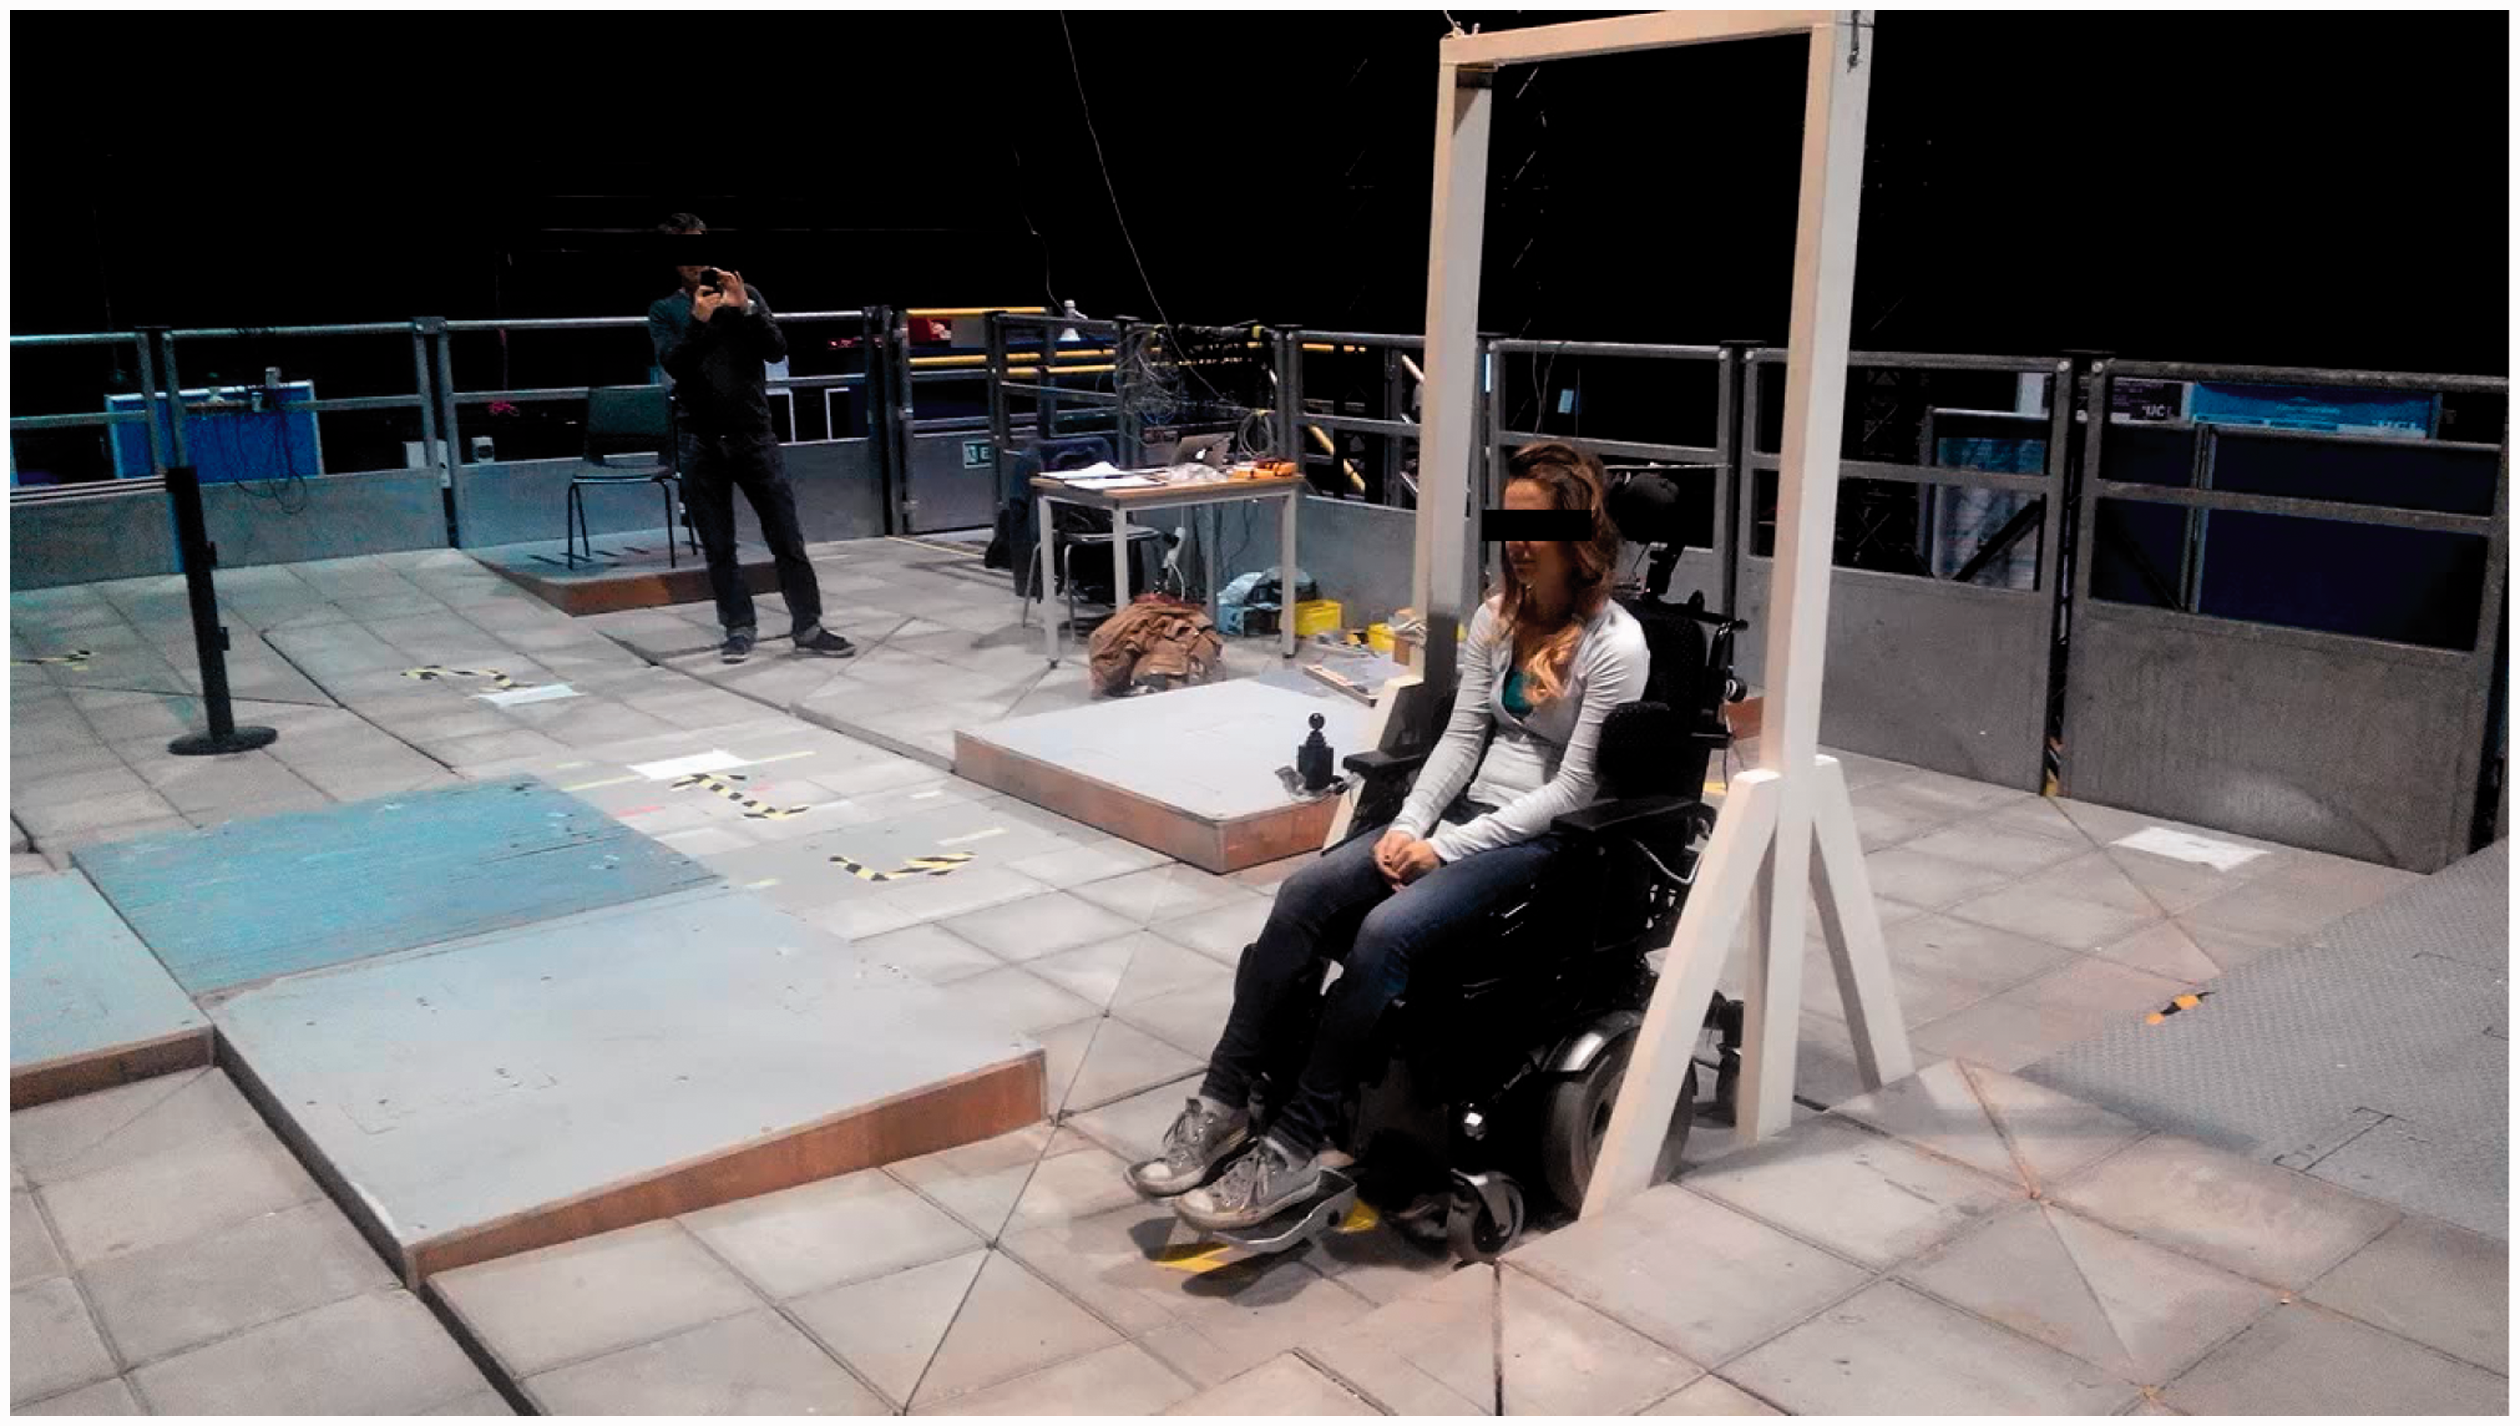
Ten healthy, able-bodied participants were recruited who had no prior experience in driving a wheelchair.
They were asked to drive around the assessment course at their own pace without colliding, whilst we tracked the wheelchair's trajectory using a marker attached on the wheelchair as in Figure 13. In this figure, we see that MoRe-T2 produces trajectories that were reasonable given the dimensions of the assessment course. From the tracked trajectories of the wheelchair's motion, we measured the total distance travelled, task completion time and intermittent level. Mathematically, intermittent level r is defined as,
A trajectory of the participant's trial generated by MoRe-T2. The trajectory was super-imposed on an image of the assessment course layout. Both trajectory and assessment course were scaled to the same ratio.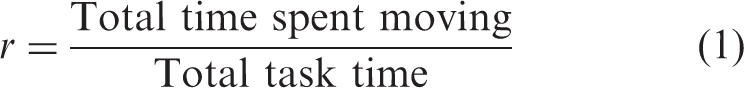

We used a Kruskal–Wallis test to compare metrics amongst the interfaces. We chose an alpha value of 1.1. For interfaces which are more difficult to use, task completion time and distance travelled should be higher whilst intermittent ratio should be lower than for interfaces that are easier to use.
All authors hereby declare that all experiments had been examined and approved by the appropriate ethics committee and have therefore been performed in accordance with the ethical standards laid down in the 1964 Declaration of Helsinki. Furthermore, this research has ethics identification number 6545/002 that was issued by the Research Ethics Committee of University College London.
Case study results
We found that all performance metrics consistently reported that the joystick was easier to use, and the sip/puff switch was the hardest interface to use for wheelchair control (see Figure 14). All results showed statically significant results (p < 0.01).
Objective measures of participant's performance on a wheelchair using different, which has been extracted from MoRe-T2 generated trajectory showing MoRe-T2's use as a tool to evaluate interfaces for wheelchair control.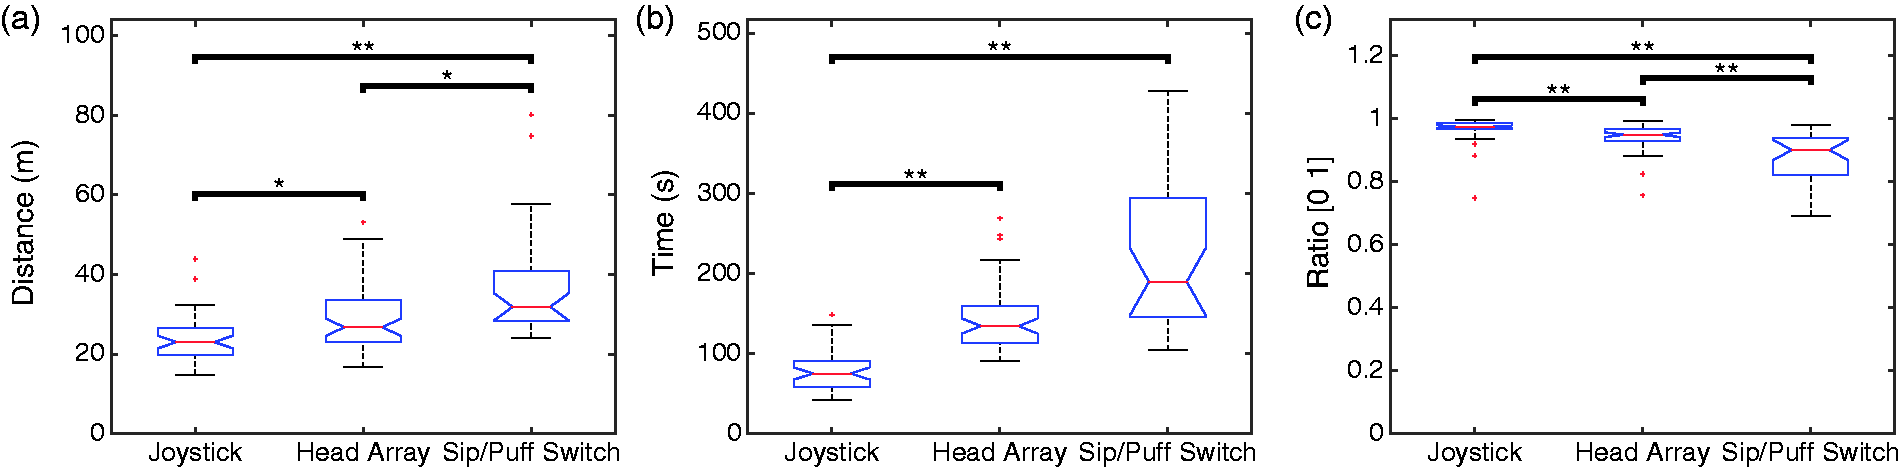
The participants generally moved the largest distance when using the sip/puff switch indicating possible control errors were made where a short distance was sufficient to go around the assessment course. Furthermore, the participants generally spent the most time trying to go round the assessment course using the sip/puff switch. Lastly, they generally spent the least portion of time moving with the sip/puff switch as they paused the most to think of the appropriate commands needed to manoeuvre safely, which indicates difficultly in using the interface.
These results certainly make sense as the joystick has the highest resolution of control, which means that its proportional control is the most suitable for fine and precise motion, whereas the discrete interfaces (the head-array and sip/puff switch) have lower resolution of control. The head-array with three switches consequently has a higher resolution of control than the sip/puff switch, which has two switches. Moreover, the joystick is much more intuitive to use than the other two interfaces as it has a natural mapping of motion to direction. Slightly less intuitive, the head- array also has a natural mapping of head movement to direction. On the other hand, the sip/puff switch is not very intuitive to use and introduces a higher cognitive load. 30 )
Conclusion
We have validated MoRe-T2 as a promising low-cost alternative to industry standard tracking systems, by showing that MoRe-T2's accuracy is comparable to CODA's accuracy. We further validated MoRe-T2 as a tool to evaluate mobility aids for use in clinical settings. MoRe-T2 provides accurate position and useful orientation information, which provides more detailed objective evaluations of how well a patient can use an assistive technology. Such evaluations may help to pinpoint or confirm cases where mobility aids are useful and where they fail leading to the development of more inclusive assistive technologies.
Footnotes
Declaration of Conflicting Interests
The author(s) declared no potential conflicts of interest with respect to the research, authorship, and/or publication of this article.
Funding
The author(s) disclosed receipt of the following financial support for the research, authorship, and/or publication of this article: This Research has been supported by the UCL SLMS Grand Challenge Studentship “Shared Control for Wheelchair Interfaces”, the UCL Grand Challenge Small Grant Scheme “MoRe-T2” and charitable funds from Aspire, UK.