
Abstract
The oxygenation level of a tissue is an important marker of the health of the tissue and has a direct effect on performance. It has been shown that the blood flow to the paretic muscles of hemiparetic post-stroke patients is significantly reduced compared to non-paretic muscles. It is hypothesized that hemodynamic activity in paretic muscles is suppressed as compared to non-paretic muscles, and that oximetry can be used to measure this disparity in real-time. In order to test this hypothesis, a custom-made oximetry device was used to measure hemodynamic activity in the forearm extensor muscles in post-stroke patients’ paretic and non-paretic sides and in a control population during three exercise levels calibrated to the subject’s maximum effort. The change in oxygenation (ΔOxy) and blood volume (ΔBV) were calculated and displayed in real-time. Results show no apparent difference in either ΔOxy or ΔBV between control subjects’ dominant and non-dominant muscles. However, the results show a significant difference in ΔOxy between paretic and non-paretic muscles, as well as a significant difference between normalized post-stroke and control data. Further work will be necessary to determine if the observed difference between the paretic and non-paretic muscles changes over the course of physical therapy and can be correlated with functional improvements.
Introduction
Stroke is quite common across the world: one in six men and one in five women worldwide will suffer a stroke, and it can affect people of any age. 1 The most common long-term effect of stroke is hemiparesis: 50% of post-stroke patients exhibit hemiparesis 2 and are treated with some form of occupational or physical therapy.
The specific therapy prescribed depends in large part on the magnitude and location of the worst effects of the stroke. Regardless of the region or task of focus, all therapies share the common goal of improving a patient’s functional level. In attaining this goal, many therapy protocols focus on improving the function of the paretic muscle as much as possible. There are a few quantitative methods, such as grip strength measurements, used to measure functional improvements.3,4 What is lacking is a way to measure the effects of therapy on muscle metabolism.
Disabling strokes, either ischemic or hemorrhagic, can lead to substantial metabolic and structural changes in the hemiparetic limbs.4–6 In particular, biopsies have shown that a post-stroke patient’s paretic muscles shift towards a more glycolytic metabolism in addition to the shift in muscle phenotype compared to the non-paretic muscles.7–9 Because the paretic limb has a more anaerobic metabolism than the normal limb, a reasonable hypothesis is that the hemodynamic activity in paretic muscles is suppressed as compared to normal muscles. While exercise therapy is a commonly prescribed treatment to improve post-stroke patients’ muscle function and quality of life, there is currently a paucity of real-time diagnostic tools available to physical therapists to monitor the effects of such therapy on muscle metabolism. Muscle oximetry, which provides information regarding the hemodynamic activity of the muscles underneath the probe, has the potential to be an important tool to fill in this gap.
In order to measure the hemodynamic activity, the authors developed a muscle oximeter to measure the relative changes in the concentration of oxygenated and reduced hemoglobin, which were then used to calculate the change in oxygenation (ΔOxy) and blood volume (ΔBV) in the tissue. 10
Near-infrared spectroscopy (NIRS), the basis for muscle oximetry, has come to be recognized as a viable inexpensive method of measuring the oxygen consumption of skeletal muscles.11–14 Several groups have characterized the hemodynamic activity of healthy muscles during exercise,10,13–16 however, a literature search did not find any publications on the study of muscle metabolism using NIRS in stroke patients so far.
NIRS, like other types of spectroscopy, uses different wavelengths of light to determine the composition of a material. The near-infrared window is about 700–1300 nm.
17
In the case of oximetry, near-infrared light is used to specifically measure the change in the concentration of hemoglobin (Hb) and oxyhemoglobin (HbO2) via the modified Beer-Lambert law

After finding the change in ΔCHbO2 and ΔCHb, these findings are used to calculate ΔOxy and ΔBV according to the following formulas,
10


It should be noted from these equations that negative ΔOxy implies that the muscle is using more oxygen than at rest or during the baseline. The oximetry signals acquired are from the capillary bed that feeds the muscle. Thus, a decrease in ΔOxy indicates that the change in the concentration of Hb (ΔCHb) has not kept pace the change in concentration of HbO2 (ΔCHbO2). This relationship has been explored thoroughly elsewhere.10,14,16,18,20,21
When calculating ΔBV, a third wavelength near the isobestic point of Hb and HbO2 is used to find the change in concentration of Hb and HbO2 (ΔCHb and ΔCHbO2), following the method outlined by Britton Chance. 11 The isobestic wavelength used is 805 nm.
Methods
Oximetry device
The oximetry system consists of a probe head connected to an electronic control box, which controls the electronics of the probe head. The probe head consists of a triple-wavelength light-emitting diode (LED) (L735/805/850/PD-35B32, Epitex, Kyoto, Japan) surrounded by four photodiodes (S1133-14, Hamamatsu, Hamamatsu City, Japan) arranged in a cross around the LED.
An important step during designing the NIRS system was defining the optimal distance between the source and detector so the measurements have a high sensitivity to the changes on the target area and also high signal-to-noise ratio during the measurements. The distance between the source and detector depends on the structure of the tissue, desired depth of penetration and also wavelength of the light used for the measurements. In general by increasing the distance between the source and detector, the system can monitor deeper activities in the tissue. 22 However, as source-detector separation increases the signal-to-noise ratio decreases. New Monte Carlo simulations should be performed to obtain the exact signal-to-noise ratio at each desired depth. For a normal body habitus, the sufficient depth to which light should pass in the tissue to observe surface skeletal muscles is 1 cm below the surface of the skin. 23
Optical properties of the tissue model being used for the 3D Monte Carlo simulation (λ = 850 nm).

Figure 1(a) shows the Monte Carlo simulation results for three different source-detector separation distances, 5 mm, 10 mm and 20 mm obtained by simulating the trajectories of 108 photons. Based on the results shown in Figure 1(a), as the source-detector separation distance increases, more information from the deeper areas in the tissue can be obtained. To quantify the sensitivity of the measurements for these three different source-detector configurations, the normalized axial values of the sensitivity profiles along the lines shown in Figure 1(a) are plotted and shown in Figure 1(b). As these curves indicate, the source-detector pair with the distance of 5 mm has the highest sensitivity to the activities in the superficial area while at the depth of 10 mm, sensitivity drops significantly and is close to zero. On the other hand, the source-detector pair with the distance of 20 mm is more sensitive to deeper activities up to 10 mm and has considerable sensitivity to superficial activities beneath the skin and fat layers. Therefore, optimum distance between the source and detector was set to 20 mm which can provide information up to 10–12 mm in the depth. It should be mentioned that although increasing the source-detector separation increases the chance of monitoring deeper activities, it can decrease the signal-to-noise ratio and therefore results in unreliable measurements. Figure 1(c) shows Monte Carlo simulation results for one source - two detectors with 20 mm separation between the source and the detectors.
(a) Simulated measurements sensitivity distribution for three different source-detector separation distances for a multi-layer heterogeneous model of the tissue; (b) normalized axial values of the sensitivity distribution along the cross section shown in part (a); (c) One source - two detectors Monte Carlo simulation results with 20 mm source-detector separation.
Figure 2 shows how the forearm is placed in the experimental setup. This setup will be explained in detail in the “experimental procedure” section. The light propagation as calculated by the Monte Carlo simulation is also shown in the figure. The majority of light penetrates a distance greater than 1 cm and is able to travel through the superficial muscle under the layer of subcutaneous fat. This one source – two detectors Monte Carlo simulation is obtained for the probe head with the optimum source-detector separation (20 mm).
The probe head and the forearm muscles under oximetry experiment. The photon concentrations from the one source – two detectors Monte Carlo simulation with 20 mm source-detector separation are superimposed on the tissue of the forearm. LED: light-emitting diode.
Subjects
Two types of subjects were recruited for this study: healthy control subjects and post-stroke patients. Post-stroke subjects were recruited from community referral networks. Community-dwelling post-stroke patients were sought who had no history of spinal or hand and wrist injury, were hemiparetic, and who had a score ≥3 on the hand section of the Chedoke-McMaster functional assessment, 26 meaning that they had finger extension capability suitable for the finger extension exercises required in this study. Both ischemic and hemorrhagic strokes were allowed, and all subjects were at least six months post-stroke. The latter requirement was instituted for several reasons. First, such subjects were readily available in the community. Secondly, this ensures that the subjects had completed their initial program of intense physical therapy, though some continued with more sporadic rehabilitation exercises. As a result, these subjects were in better physical condition than acute stroke patients. A total of n = 6 stroke subjects were recruited; the average age of the subjects was 64.6 ± 12 years.
Healthy control subjects were recruited from the general population of the University of Wisconsin-Milwaukee. Subjects were sought who had no history of spinal or hand and wrist injury and no history of stroke. A total of n = 6 control subjects, all of whom were right-hand dominant, were recruited and the average age of the control subjects was 30.3 ± 5 years. This study was approved by the Institutional Review Board for the protection of human subjects at the University of Wisconsin-Milwaukee. Written informed consent was obtained from each subject.
Muscles
Two forearm muscles were chosen for this study, extensor digitorum superficialis and flexor digitorum communis. These muscles were chosen because they are the major muscles for finger flexion and extension. The experimental procedure, described below, was performed on both muscles.
However, the flexor data was often corrupted due to the high density of large veins in the anterior region of the forearm. During exercise, the location of these veins relative to the probe changes as the muscles contract and relax. When this muscle contraction caused a vein to move directly underneath one of the detectors on the probe, the device measured a large sudden drop in ΔOxy unrelated to the muscle hemodynamics. In addition, several subjects had black forearm tattoos near the flexor muscles which interfered with the probe in this location, similarly to the veins. As the subjects with these tattoos exercised, the tattoo would occasionally shift directly under either the source or one of the detectors and absorb the light. As a result, only extensor data is presented below.
Experimental procedures
The measurements taken by the oximeter are baseline dependent and are prone to motion artifact, and the hands and wrist are extremely mobile and allow a wide range of motion. In order to isolate the muscle groups of interest and limit the degrees of freedom in the system, the subject’s forearm is secured to a restraining device during data collection as shown in Figure 3. Briefly, this restraint is a set of semicircular pads with straps to securely restrain the forearm. The fingers are immobilized by inserting them between a set of padded plates to the proximal interphalangeal joints, and a load cell (MC3A-1000, Advanced Mechanical Technology, Inc., Watertown, Massachusetts, USA) is coupled to this plate to capture the metacarpophalangeal joint moment the subject exerts while exercising. This restraint system allows the subject to perform isometric flexion and extension of the fingers while the probe head is coupled to the forearm.
The forearm restraint and probe placement used in this study. The adjustable cradle supports the weight of the forearm, and the metal plates reduce the available degrees of freedom in finger motion. The probe was always placed such that detector D1 is oriented laterally and detector D4 is oriented proximally.
The probe is always placed on the forearm such that detector D1 is oriented in the radial direction as shown in Figure 3. In the case of forearm muscles, which are typically quite narrow, this means that detectors D2 and D4 are oriented along the axis of the muscle, while detectors D1 and D3 may be lateral to the muscle. Detectors D2 and D4 are therefore considered the axial pair of detectors, while detectors D1 and D3 are considered the lateral pair. Due to the narrowness of forearm muscles, only the data from the axial pair of detectors is considered to be truly indicative of the hemodynamic activity in the muscle.
Each subject was asked to repeat a basic exercise protocol four times: once for each muscle of interest on each side of the body. In the case of post-stroke patients, the exercise protocol was performed first on the non-paretic flexors, then on the paretic flexors; the extensors were tested in the same order. In the case of healthy control subjects, the flexors of the dominant hand were tested first, then the flexors of the non-dominant hand were tested; the extensors were tested in the same order.
For each muscle, after the probe was secured to the forearm, the subjects’ maximal voluntary contraction (MVC) was collected. The subjects were asked to isometrically flex or extend their fingers as hard as they possibly could and hold that exertion level for around 0.5 s, then relax. They repeated this action three times, and the maximal values set each time were averaged together to form the MVC used to define the rest of the experimental parameters for that muscle.
A baseline is required as the initial point when calculating ΔOxy and ΔBV. This baseline value was obtained when the oximetry signals stabilized after the MVC recording. Approximately 2–5 min of rest was given after the MVC collection to ensure the stabilization of the measured oximetry signals.
After the baseline values were established, the subjects were asked to perform three minutes of isometric finger flexion or extension at a rate of 1 Hz at a specified percentage of the calculated MVC (20%, 30%, or 40%). A metronome provided the timing, and the subjects were given visual feedback regarding their level of exertion. Subjects were not given a practice trial before testing, but were allowed to listen to the beat of the metronome for up to 15 s before beginning to exercise. The subjects were allowed 2–5 min of rest between each exercise period; since the study of muscle fatigue was not a goal of this study, subjects were encouraged to ask for an extended period of rest if desired. Just one of the stroke-affected subjects required more than five minutes rest.
In each case, the order of exercise levels was always linearly increasing, from 20% MVC to 40% MVC. There were several factors that went into the decision not to randomize the order of exercise, but the main factor was concern for subject safety. While exercising at 40% MVC for three minutes is not particularly challenging for healthy subjects, it was a challenge for stroke-affected subjects, particularly when exercising the weaker extensor muscles. There was concern that without proper warm-up, this exercise would be more likely to cause muscle fatigue, or, in the worst case, muscle injury in stroke-affected subjects.
Signal analysis and statistical methods
Offline data analysis was performed using a Python 27 script utilizing the NumPy, 28 SciPy, 29 and MatPlotLib 30 modules. Briefly, this script was designed to take the data from the oximeter and find the concentration of Hb and HbO2 in the muscle. With reference to Equation 1, the software takes the intensity information (I(t) and I0), solves for the attenuation spectrum (ΔA), then solves for the change in the concentrations of Hb and HbO2 (ΔCHb and ΔCHbO2), and finally finds ΔOxy and ΔBV using Equations 2 and 3. A 4 s moving average filter was applied to the acquired signals to reduce the motion artifact noise. 31
It was found that averaging the signals over 4 s removed much of the motion artifacts from exercise, but had no significant effect on the shape of the acquired signals as compared to shorter sampling periods (i.e. 0.5 s and 1 s).
Statistics were performed using a paired two-tailed Student’s t-test for each comparison; significance was based on p < 0.05. The non-paretic muscle (or dominant-side muscle for healthy subjects) was treated as the paired control for the paretic (or non-dominant) muscle.
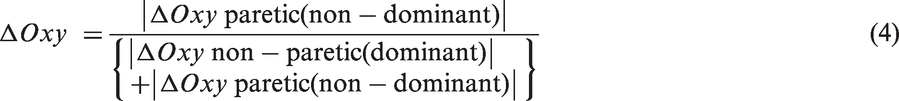
In order to compare the results between the two subject groups, the data must first be normalized as described in Equation 4. When presenting oximetry data in μM, there is a high variance in inter-subject muscle oximetry measurements amongst the general population; 32 this problem only worsens as oximetry is applied to the hemiparetic population. Interpreting the paretic and non-dominant ΔOxy data as a percentage of the total bilateral ΔOxy, called the oxygenation asymmetry ratio (OAR), allows for an index comparable between subjects.
Furthermore, this presentation is simple for both a clinician and a patient to read and interpret. An equal ΔOxy in both muscles should yield ΔOxy% = 50%. Mathematically, the OAR is defined as:
This method allows for inter-subject comparison, and normalizing in this fashion, rather than the more intuitive
When comparing the two subject populations, the question was whether the two data sets were drawn from the separate populations. To answer this question, the normalized data were compared using an unpaired two-tailed Student’s t-test; significance was again based on p < 0.05.
Results
Healthy controls
Figure 4 shows representative ΔOxy and ΔBV data collected from the extensor muscles of a healthy control subject. The three regimes represent each level of exercise intensity as marked on the graphs. During each period of exercise, ΔOxy sharply decreases from the initial baseline at the start of exercise as the muscle begins to use more oxygen for cellular respiration. Soon after exercise, the heart rate increases slightly to compensate for the new demand, and the ΔOxy signal stabilizes. Once exercise ceases, the heart is supplying more oxygen than is utilized by the muscle, and ΔOxy begins to increase immediately. As the heart adjusts to lowered demand for oxygen, the ΔOxy signal stabilizes to a new baseline value. Similarly, the ΔBV signal increases at the start of exercise and decreases during periods of rest. These trends are the same on both the right and left forearms, and agree with previous studies of muscle response to exercise.10,16,20,32–34
Representative change in oxygenation (ΔOxy) (top) and change in blood volume (ΔBV) (bottom) curves from a healthy control subject. (Left) results from the dominant arm; (Right) results from the non-dominant arm. The vertical dashed lines indicate the start and stop times for each period of exercise. Note that vertically stacked plots share x-axes and horizontally adjacent plots share y-axes.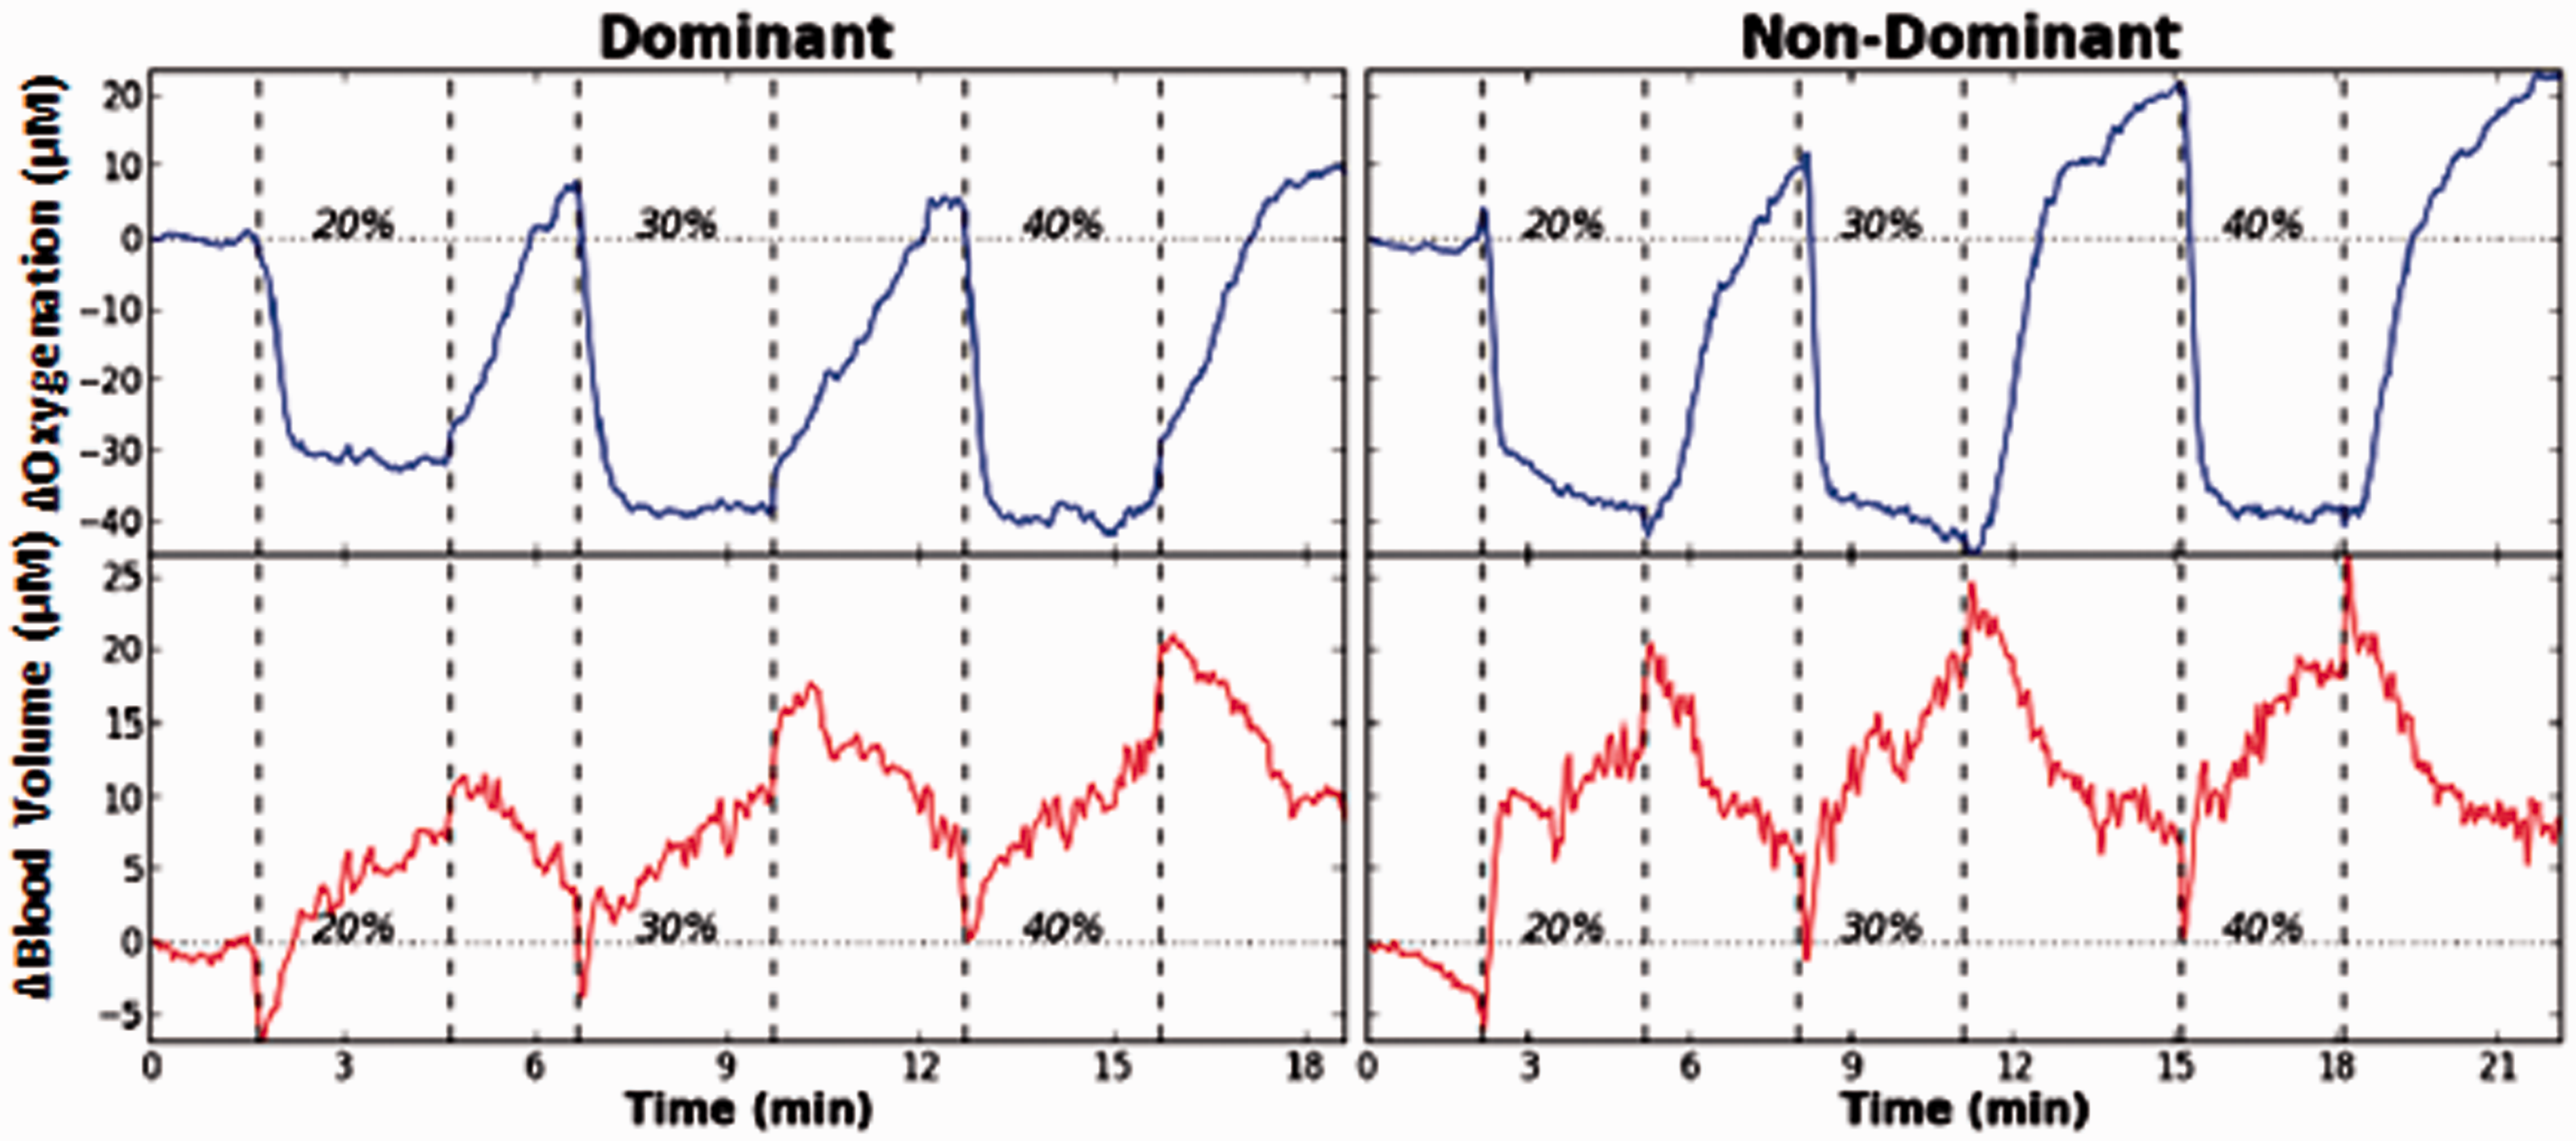
The most important aspect of the data for the purposes of this study is that the two sides of the body produce roughly equal changes in ΔOxy and ΔBV, as can be seen in Figure 4.
In order to establish the significance of our results, the experiments were repeated for n = 6 healthy control subjects and the results combined for statistical analysis. The healthy subjects' dominant and non-dominant hands were compared and these aggregate findings are presented in Figure 5. As can be seen in these figures, there is no statistically significant difference (p > 0.05) between healthy individuals’ dominant and non-dominant extensor muscles. This result implies that any difference observed in the post-stroke population is more likely caused by hemiparesis than by hand dominance or some other factor found in the general population.
Aggregate control subject statistics. Change in oxygenation (ΔOxy) (left) and change in blood volume (ΔBV) (right) for the control group. Each bar represents the average ΔOxy or ΔBV during the specified level of exercise in the left and right extensor muscles. There is no statistically significant difference between the two arms during exercise.
Post-stroke patients
Figure 6 shows representative ΔOxy and ΔBV data collected from a post-stroke patient. The general trends in the signals are the same as those found in signals acquired from control subjects. The important feature of this data set is the obvious disparity in the paretic and non-paretic ΔOxy signals, but it is also important to note that ΔBV is roughly the same between the paretic and non-paretic muscles.
Representative change in oxygenation (ΔOxy) (top) and change in blood volume (ΔBV) (bottom) signals obtained from a poststroke patient’s non-paretic (left) and paretic (right) extensors. The vertical dashed lines delineate periods of exercise from rest. Note that vertically stacked plots share x-axes and horizontally adjacent plots share y-axes.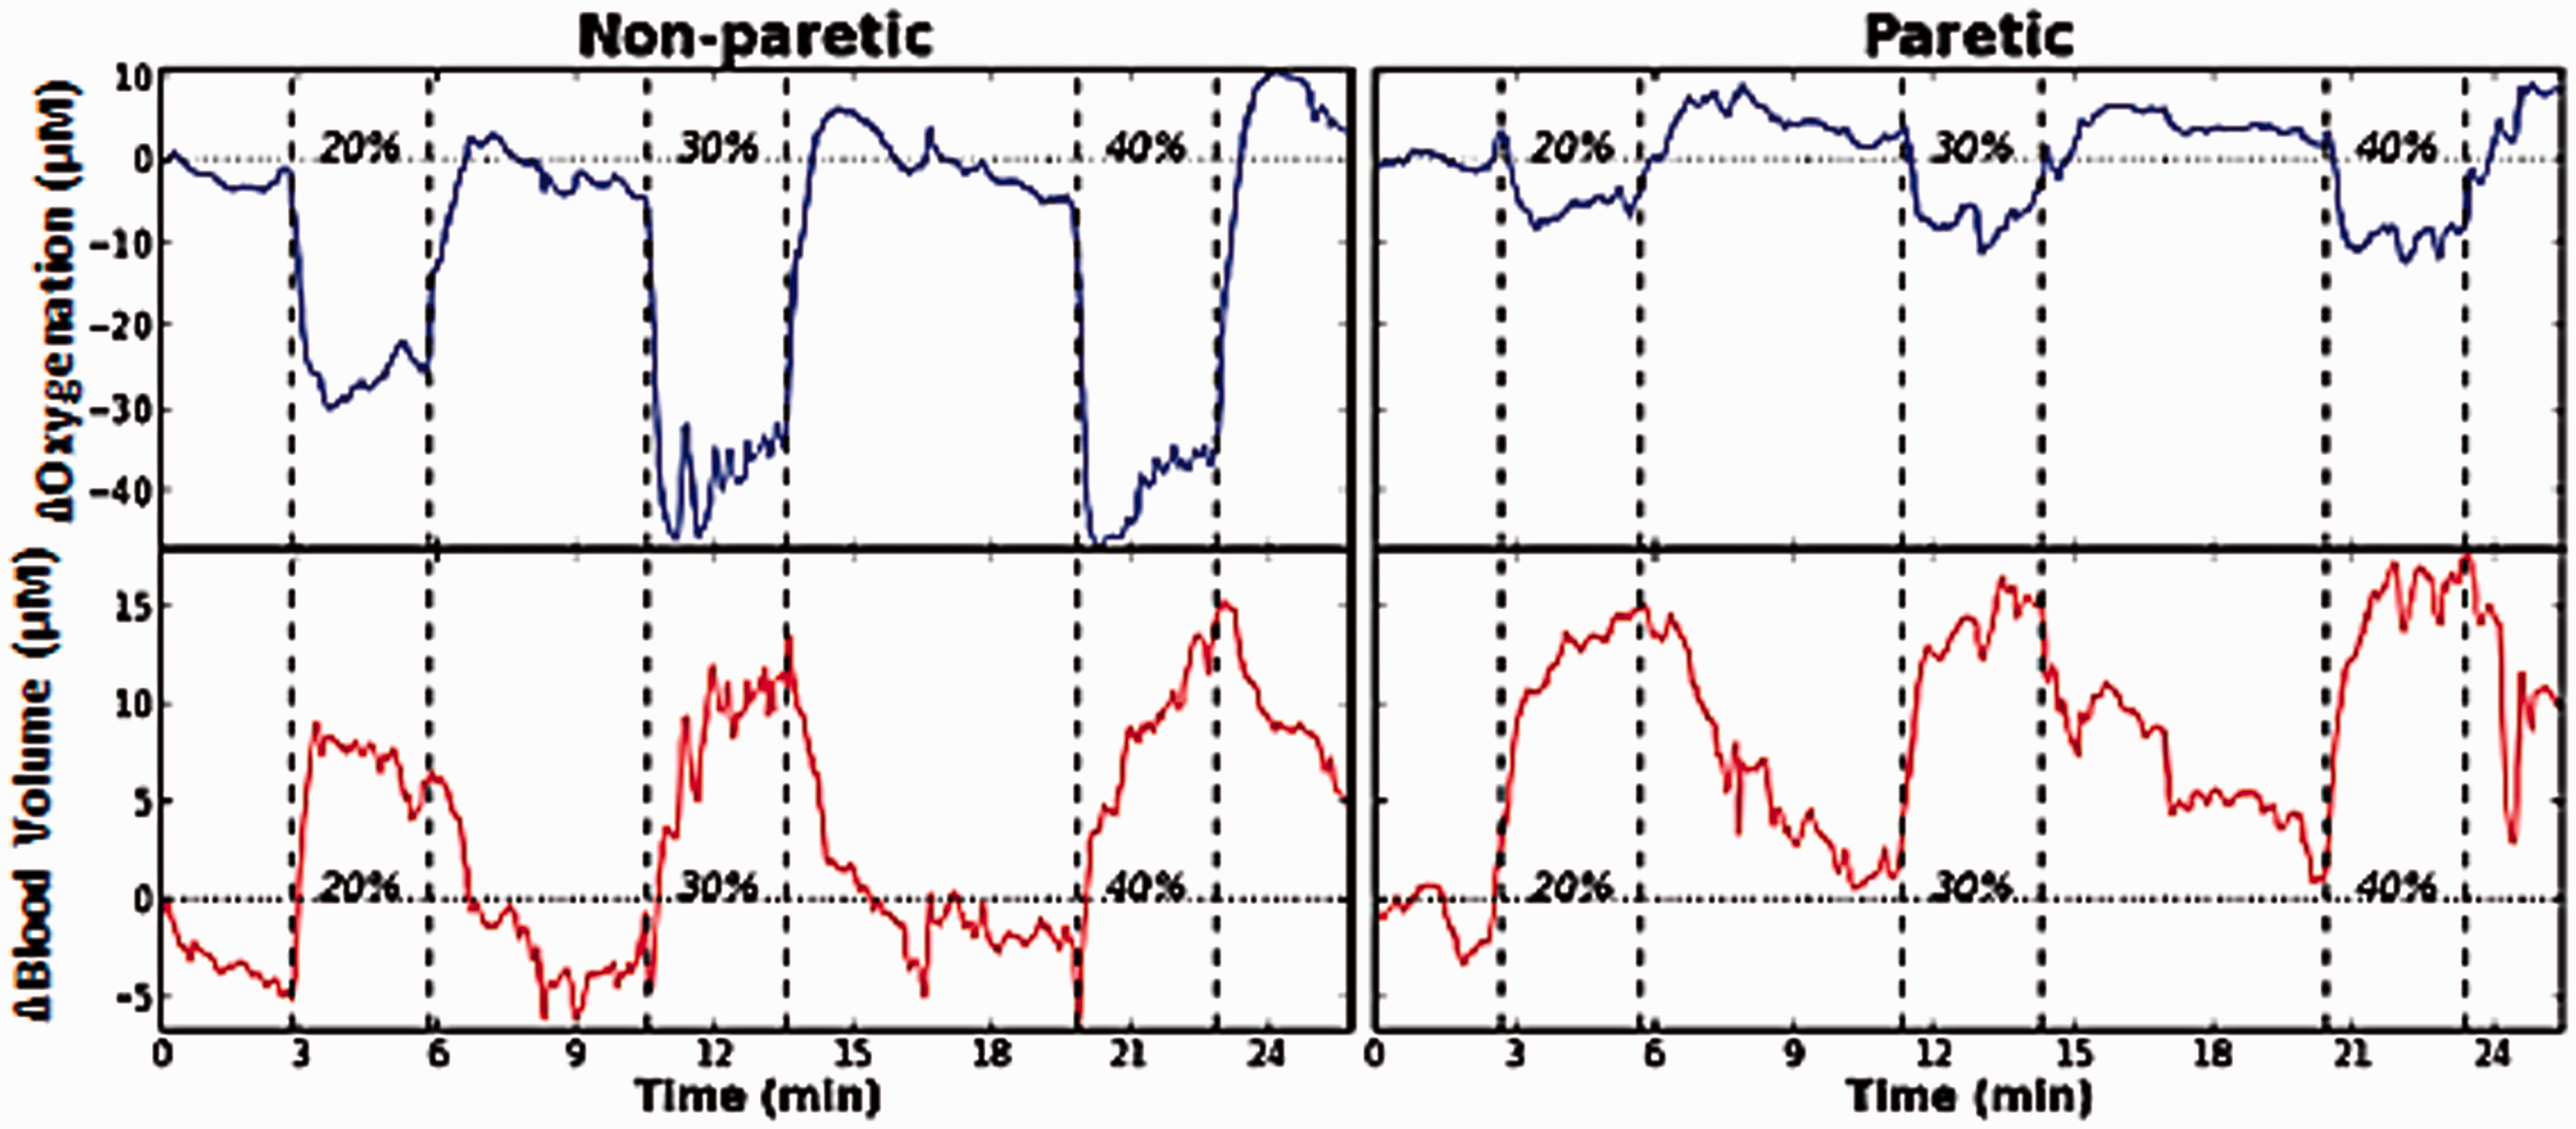
The experiments were also repeated for n = 6 post-stroke subjects, using each subject’s non-paretic muscle as the control, and combined the results. As is shown in Figure 7, there is a statistically significant (p < 0.05) difference in ΔOxy between paretic and non-paretic muscles; any observed differences in ΔBV did not achieve statistical significance.
Aggregate post-stroke patient statistics. Change in oxygenation (ΔOxy) (left) and change in blood volume (ΔBV) (right) for the stroke group. Each bar represents the average ΔOxy during the specified level of exercise in the paretic and non-paretic extensor muscles. There is a statistically significant (p < 0.05) difference between the ΔOxy of the two arms during each level of exercise, but there is no significant difference between the ΔBV in the two arms.
This significant difference in ΔOxy was found across all three exercise levels. Both paretic and non-paretic muscles were exercising at 20–40% of MVC for that particular muscle. A patient’s absolute MVC on the non-paretic side was typically found to be 36% higher than the absolute MVC of their paretic side, since the paretic muscle tends to be weaker than the non-paretic muscle. Yet, there was an overlap in the absolute exercise level (in Nm). Specifically, the absolute exercise level was similar between paretic limbs exercising at 30% MVC and nonparetic limbs exercising at 20% MVC, as well as between paretic limbs at 40% MVC and nonparetic limbs at 30% MVC. The substantial difference between paretic and non-paretic muscles still exists if ΔOxy for paretic 30–40% MVC are compared to that for nonparetic 20–30% MVC.
As discussed in the Methods section, subjects were asked to perform extension exercises at a rate of 1 Hz. Several of the post-stroke patients (n = 3) had difficulty exercising at the prescribed frequency, and instead consistently exercised at 0.5 Hz. These subjects were not excluded from the study, since they exercised at a consistent frequency throughout the whole experiment.
Comparison of post-stroke and control
When the normalized post-stroke and control extensor data were compared, the authors found that the ΔOxy for the paretic muscle was roughly 13% of the total bilateral ΔOxy, as can be seen in Figure 8. This contrasts with those in the control group who had roughly the same ΔOxy in the dominant and non-dominant muscles. It is important to note that a value of 50% corresponds to equal ΔOxy in the two muscles. Our findings show that there is a statistically significant difference in the measured ΔOxy of post-stroke patients’ paretic and non-paretic forearm extensor muscles during exercise. Furthermore, our findings indicate that such asymmetry in muscle oxygenation does not exist in the general population.
A statistical comparison of normalized change in oxygenation (ΔOxy) between stroke and control subjects (n = 6 for both groups). *Indicates p < 0.05, two-tailed Student’s t-test when compared to the corresponding exercise intensity data from the other subject group.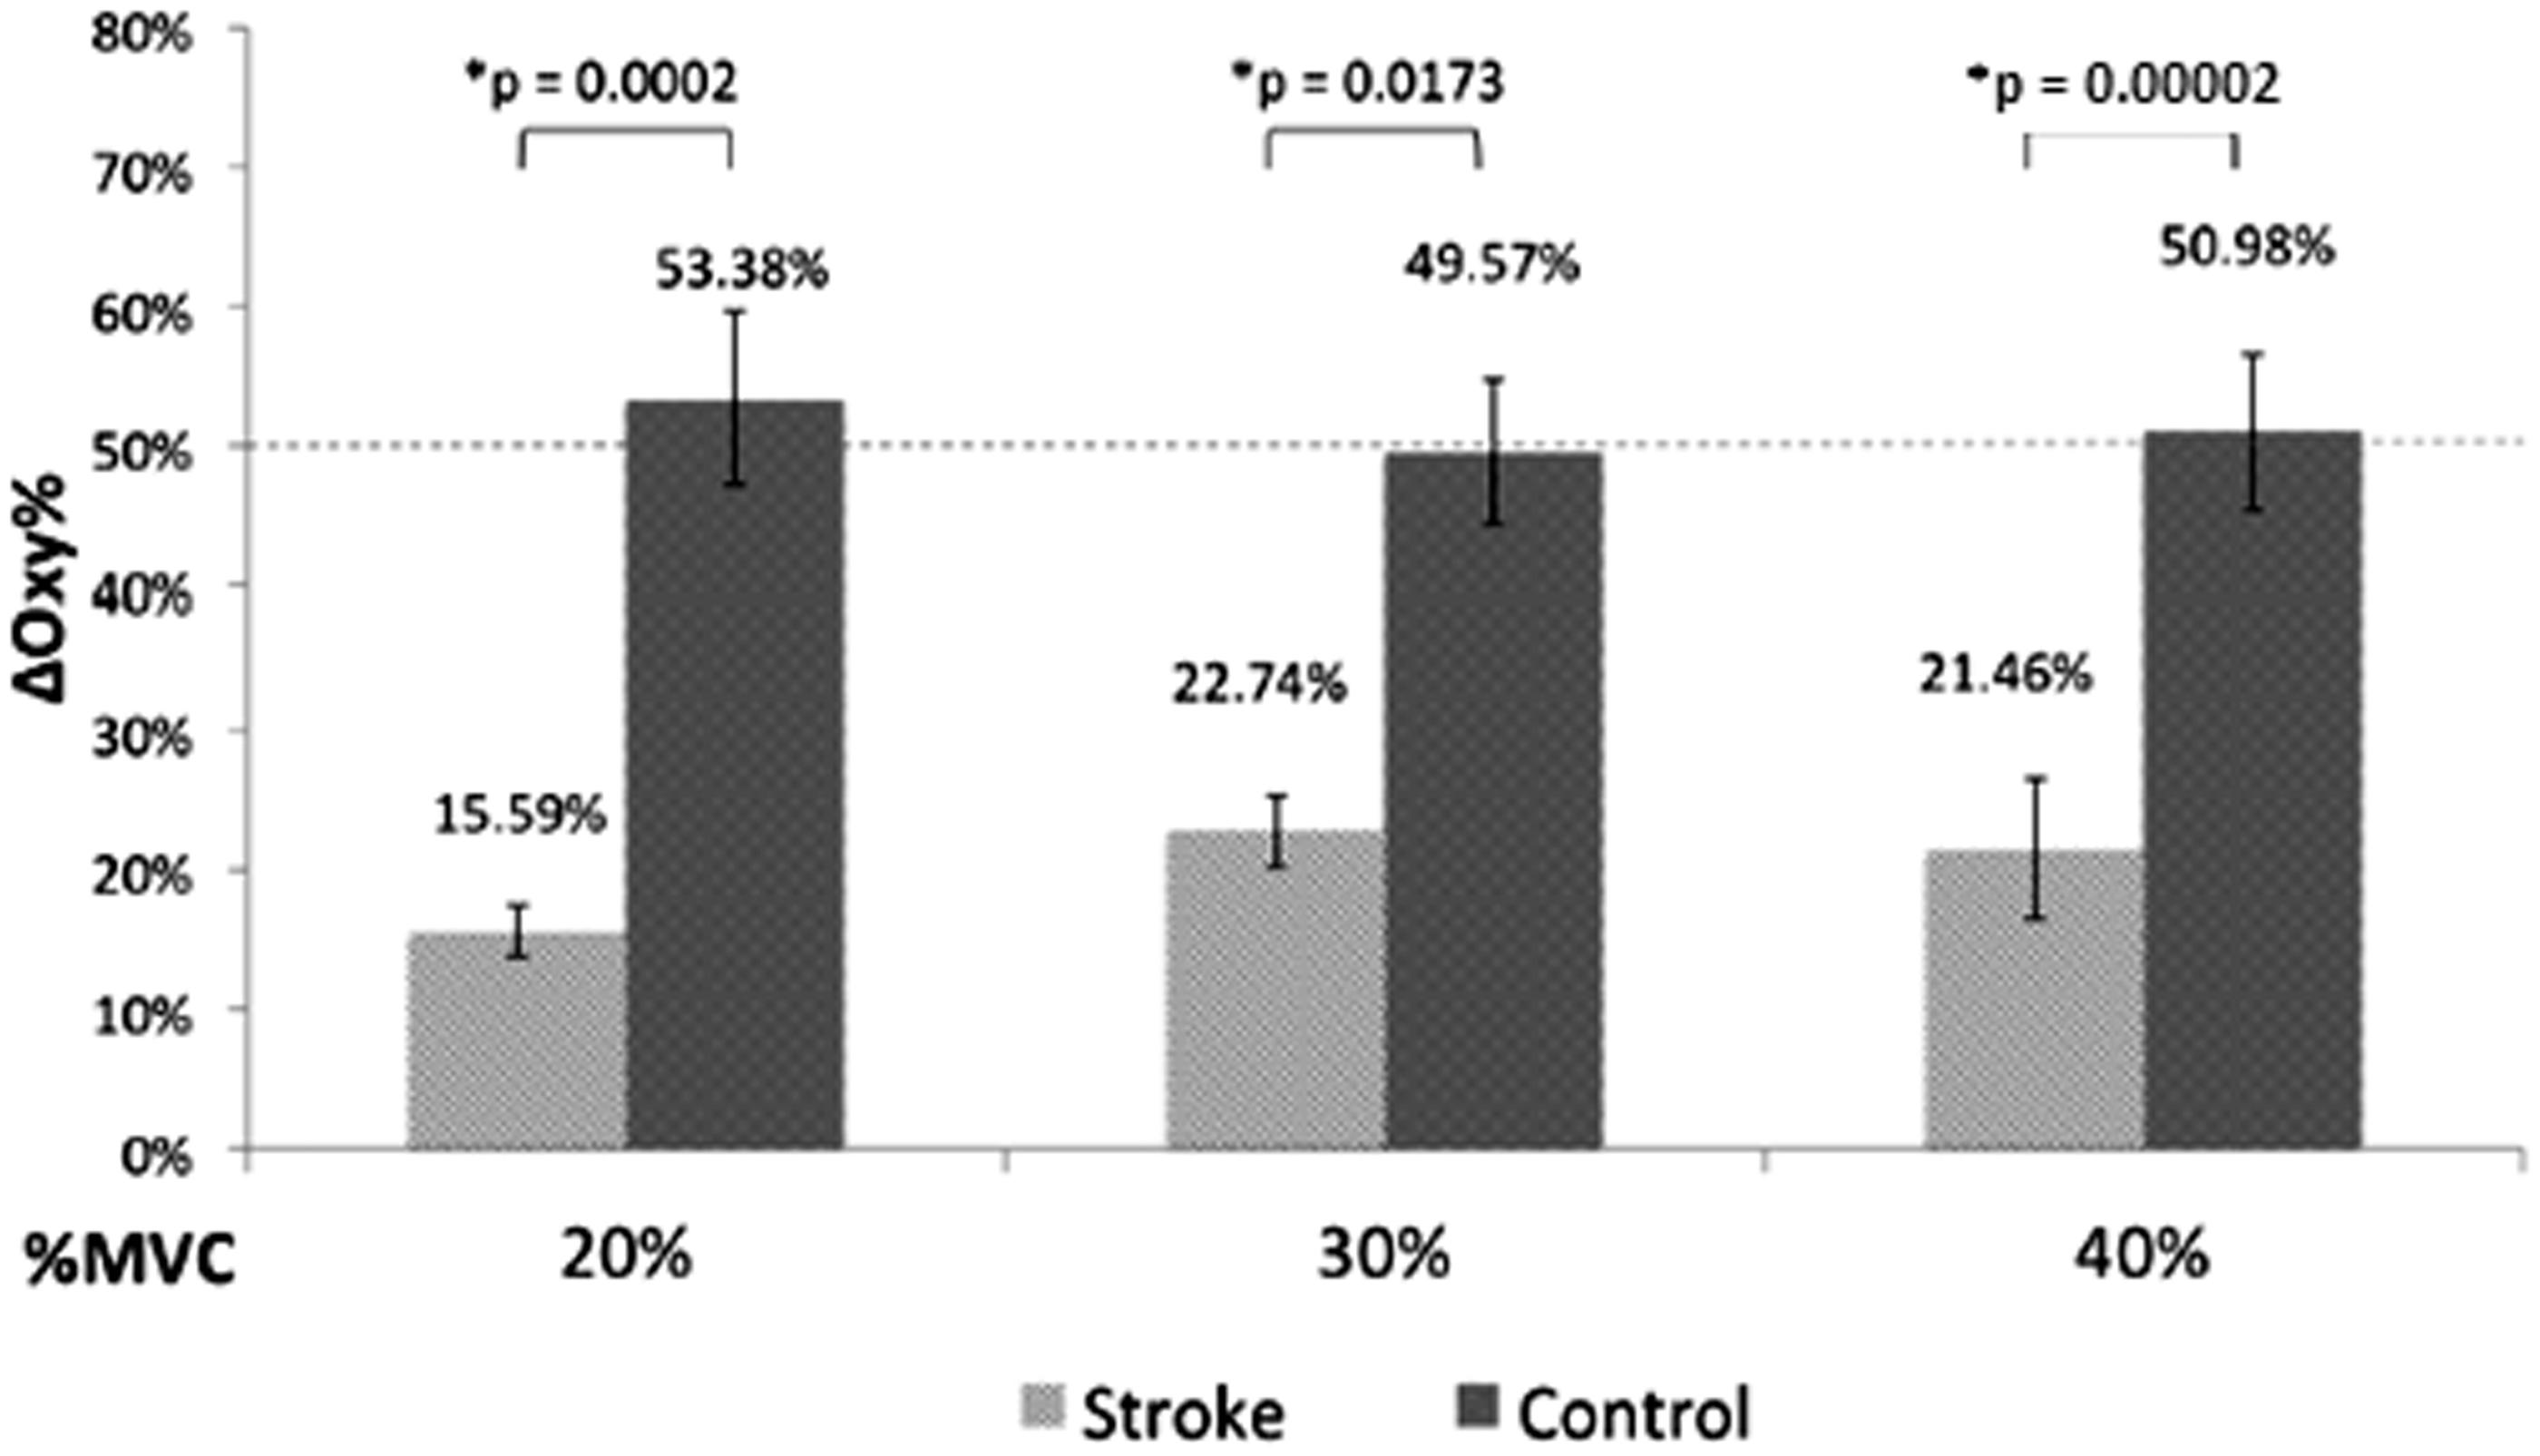
The observed difference between the stroke subjects’ paretic and non-paretic muscles fits with observations that paretic muscles have more anaerobic-dominated metabolism than non-paretic muscles.9,35–38 Anaerobic metabolism utilizes glucose for cellular respiration, whereas aerobic metabolism utilizes oxygen and glucose for metabolism. It makes sense then that an anaerobic-dominant muscle would use less oxygen than an aerobic-dominant muscle during moderate exercise. While there have been very few studies on stroke induced muscle wastage, a recent review of literature has shown that there is reason to believe that the muscle mass of the paretic limbs has been decreased. Specifically, the cross-sectional area of the extensor digitorum superficialis muscle in the paretic arm was found to be approximately 85% of that in their nonparetic arm and 96% of that in age-matched adults’ nondominant arm, using ultrasonographic techniques. 4 Muscle wastage could potentially cause a lower demand for oxygen in the paretic arm, partially accounting for the observed asymmetry in ΔOxy. 39
As discussed, there is no statistically significant difference between ΔBV in either the control or stroke group. As a result, it was decided that it would not be worthwhile to compare the normalized ΔBV between the two groups. The lack of significant difference in ΔBV between the paretic and non-paretic muscles is also interesting, particularly since it has been shown that vasodilatory function is decreased in paretic leg muscles compared to non-paretic leg muscles following a stroke. 5 These results are not contradictory to previous results: this study measured a relative change in blood volume in the tissue during exercise, whereas previous work focused on resting blood flow rates. It has been shown that the brachial arteries on the paretic side of chronic stroke patients have a significantly smaller diameter than non-paretic limbs. They also have a depressed dilation response. These two facts would have opposite effects upon a relative change in blood volume during exercise, making it difficult to establish an expected outcome. 40
Discussion
The stated goal of this research was to design a more objective quantitative means of evaluating the progress of physical therapy in hemiparetic patients. The results presented here provide an important first step in this process. The most obvious and immediate application of muscle oximetry in a clinical setting is in physical and occupational therapy, where it could be used to quantitatively track the progress of therapy in terms of changes in muscle oxygenation. Another potential application would be in disability examinations, as a means of providing objective evidence of the degree of paresis, thus eliminating examiner bias. Current clinical tools are subjective, and scores can vary amongst examiners. Furthermore, currently available tools do not provide any information about hemodynamic activity or status, for which this oximetry can fill the gap.
Since this device provides realtime feedback of muscle oxygenation, it can be used to examine which types of exercises (eccentric vs concentric, low-load long duration vs medium-load short-duration, or movement speed/frequency) best induce muscle oxygenation for individual patients. The oximeter can be paired with dynamic braces (as opposed the static brace used in this study) to quantify muscle oxygenation during dynamic exercises as well. Furthermore, the realtime feedback may be used as a motivational tool to keep people engaged in and committed to their therapy regimens. Now that it has been shown that there is a significant observable difference between paretic and non-paretic forearm extensor muscles, further exploration can be done on the applications of this technique to other muscles and to patients affected by stroke and other injuries and diseases. For instance, asymmetry in muscle oxygenation may be even more substantial in the leg muscles contributing to early fatigue in standing or walking post stroke.
These are just a few examples out of a multitude of potential applications; in principle, this device is not limited to hemiparetic patients: it could be used in a clinical setting to monitor or potentially diagnose the severity of any unilaterally weak muscle (e.g. after musculoskeletal or nerve injury).
Future work should focus on addressing the clinical potential of muscle oximetry. In particular, work should be done to determine whether this observed difference in ΔOxy between the paretic and non-paretic muscle changes during the course of physical therapy and other treatments, and if such changes can be correlated with functional improvements. This technique should also be applied beyond the forearm muscles and into the leg muscles and should be extended beyond post-stroke patients into other hemiparetic patients. There is also the potential for the oximeter to be useful beyond the confines of hemiparesis. Other diseases and injuries resulting in unilateral muscle weakness, such as ligament injuries and muscle lacerations, should be evaluated for study.
There are several challenges and limitations to this study that should also be addressed in future work. First, due to the requirements of the study (i.e. the requirement of finger function in extension) the majority of post-stroke patients recruited were high-functioning. Although significant differences were detected between the paretic and non-paretic forearm muscles, these differences may be more pronounced in lower-functioning individuals. Secondly, the control population is not age-matched to the stroke population. There may be an aging-related reason for the measurable differences in the two sides of the body.
Finally, besides requiring that post-stroke subjects exhibit hemiparesis, the study made no effort to distinguish between strokes in different locations in the brain. The location of the lesion could possibly affect the severity of the differences in metabolism between the paretic and non-paretic sides of the body.
There are a few improvements to the design of the hardware and software of the oximeter that should be implemented in future versions. First, an adaptive filter should be added to the software to reduce motion-artifact noise during periods of exercise and potentially reduce the effects of venous blood on the acquired signal. There is also the potential to create a map of muscle oxygenation if more detectors are added to the probe head. In order to implement such a design, the control box of the oximeter would need to be redesigned and miniaturized to accommodate the increase in the number of detectors.
Conclusion
This work used a custom-built oximeter to study the differences between the oxygen consumption in the arms of stroke patients. The purpose of this study is to support the the hypothesis a shift toward more anaerobic metabolism in these affected muscles. Our findings show that there is a statistically significant difference in the measured ΔOxy of post-stroke patients’ paretic and non-paretic forearm extensor muscles during exercise. Furthermore, our findings indicate that this such asymmetry in muscle oxygenation does not exist in the general population. These differences are expected when one considers the phenotypical shift which has been observed in the paretic limbs of stroke survivors. These differences can be used as a marker of muscle functionality improvement over time. The custom built oximeter has the potential to aid rehabilitation for hemiparesis.
Footnotes
Acknowledgments
The authors would like to thank all the subjects who participated in this research, particularly the post-stroke patients. This research would not be possible without their contributions.
Declaration of Conflicting Interests
The author(s) declared no potential conflicts of interest with respect to the research, authorship, and/or publication of this article.
Funding
The author(s) disclosed receipt of the following financial support for the research, authorship, and/or publication of this article: The authors gratefully acknowledge support from UWM 101x248, 118-197025 to MR; NJS gratefully acknowledges support from the National Center for Advancing Translational Sciences, National Institutes of Health, through Grant Number 8UL1TR000055 for this publication