
Abstract
Background
Imaging investigation of cerebrospinal fluid (CSF) in multiple sclerosis (MS) is understudied. Development of noninvasive methods to detect pathological CSF changes would have a profound effect on MS diagnosis and would offer insight into MS pathophysiology and mechanisms of neurological impairment.
Objective
We propose magnetization transfer (MT) MRI as a tool to detect macromolecular changes in spinal CSF.
Methods
MT and quantitative MT (qMT) data were acquired in the cervical region in 27 people with relapsing-remitting multiple sclerosis (pwRRMS) and 38 age and sex-matched healthy controls (HCs). MT ratio (MTR), the B1, B0, and R1 corrected qMT-derived pool size ratio (PSR) were quantified in the spinal cord and CSF of each group.
Results
Both CSF MTR and CSF qMT-derived PSR were significantly increased in pwRRMS compared to HC (p = 0.027 and p = 0.020, respectively). CSF PSR of pwRRMS was correlated to Expanded Disability Status Scale Scores (p = 0.045, R = 0.352).
Conclusion
Our findings demonstrate increased CSF macromolecular content in pwRRMS and link CSF macromolecular content with clinical impairment. This highlights the potential role of CSF in processing products of demyelination.
Keywords
Introduction
Multiple sclerosis (MS) is a chronic autoimmune disease of the central nervous system (CNS) and is the most prevalent neurological condition in young adults, with an estimated 1,000,000 cases in the United States and 2.5 million worldwide. 1 MS is characterized by inflammation, demyelination, and variable degrees of axonal degeneration. MRI is the primary diagnostic tool as it can identify brain and spinal cord lesions 2 over time. Conventional MRI, e.g., T1-weighted (T1-w) and T2-weighted (T2-w) images are sensitive to inflammatory lesions and tissue atrophy, but often poorly mirror clinical decline and cannot assess the underlying pathophysiology of MS. 3
Recent studies have highlighted the potential role of cerebrospinal fluid (CSF)-mediated metabolism of neurologic waste products.4,5 Tailored imaging focused on the CSF of MS patients offers potential insight into disease processes, however, MRI assessment of CSF in MS is unexplored. Conventional MRI of CSF has been limited to flow dynamics and volumetric measurements. T1-w and T2-w images of the CSF are overwhelmed by the water signal and are not sensitive to small changes in CSF composition. In white (WM) and gray matter (GM), demyelination is a hallmark of MS pathology, and previous studies have shown that magnetization transfer (MT) imaging is an indirect surrogate for demyelination in the CNS.6–8 The MT ratio (MTR) is a clinically relevant method for characterizing the MT effect and has been shown to correlate with myelin density within WM,6,7,9 however, it is only semi-quantitative and depends on MRI scan parameters as well as water content which can confound accurate assessment of myelin change.10–12 Advanced, quantitative MT (qMT) is a model-based approach sensitive to myelin content. It removes dependencies on nonphysiological parameters and the influence of inflammation.7,13
qMT utilizes T1, B1, and B0 maps to fit MT-weighted signals as a function of offset frequency (z-spectra) to a 2-(or more) pool biophysical model and provides maps of physiological values such as the pool size ratio (PSR), which has been shown to be related to myelin content.14,15 MT-weighted MRI as well as qMT-derived PSR show MS abnormalities in superficial cord structures proximal to CSF in relapsing-remitting and progressive forms of the disease. 16 MTR and qMT have generically been utilized in WM and GM of the brain and spinal cord to relate to myelination; however, these metrics have been often ignored in large water components such as the CSF because normal, healthy CSF does not generate MT contrast. Here, we hypothesize that if myelin products of demyelination aggregate in sufficient concentration within the CSF, an increased MT effect could be noted. If present, elevated MTR and PSR values within the CSF of MS patients could reflect important evidence of CSF-mediated clearance of products of demyelination in MS, though additional work would be needed to conclusively determine that these signal changes are not derived from alternative CSF content such as pro-inflammatory proteins. The goal of this study is to provide evidence of an increased MT effect in the CSF of MS patients and to assess the relationship between the abnormal MT in the CSF to MT changes within WM. We chose the spinal cord and surrounding CSF because of the proximity of the spinal cord WM to the large pool of surrounding CSF.
Methods
Study cohort
The local Institutional Review Board approved this study and all participants provided signed informed consent prior to examination. Thirty-eight age and sex-matched healthy controls (HCs) participated (22 female/16 male, 22–40 years of age, average age 30.6 years), with seven returning for repeatability assessment. Twenty-seven people with relapsing-remitting multiple sclerosis (pwRRMS) meeting the revised McDonald's Criteria (2) were consecutively recruited (17 female/10 male, 20–42 years of age, average age 34.9 years). All patients exhibited low disability (Expanded Disability Status Scale [EDSS] score range 0–2.5, median EDSS = 0). 17
MRI protocol
Imaging was performed using a 3.0-T, Philips Elition X scanner (Philips Healthcare, Best, The Netherlands) with a quadrature body coil for excitation and a 16-channel neurovascular coil for reception. For each subject, we acquired a multi-echo fast-field echo (mFFE) as our anatomical reference and registration/segmentation target (details in Supplementary Data). 18 qMT data were obtained as listed in Table 1. The qMT protocol used a 3D MT-prepared spoiled gradient echo sequence. 13 The MT pre-pulse is a 20-ms single-lobed sinc-Gauss pulse, applied at a single power (B1,MT = 820°) and offset frequency (Δω = 2.5 kHz) for “single-point” qMT analysis14,19–21 and calculation of the MTR. The field-of-view (FOV) spanned the C2 to C5 vertebrae over 14 slices. Other parameters can be found in Table 1.
Imaging parameters.

Image processing and analysis
All data analyses were performed in Matlab 2019b (Mathworks, Natick, MA). All MT-weighted images were cropped and diffeomorphically registered to the mFFE using the Advanced Normalization Toolbox. 22 Similarly, B0, B1, and R1 maps were coregistered to the first offset of the MT-weighted acquisition and transformed to the mFFE space. Observed relaxation rate (R1,obs) maps were calculated by fitting multiflip angle (MFA) T1-weighted imaging data to the SPGR signal equation in the steady state 23 voxel by voxel. R1,obs is the calculated R1 from the MFA measurement that has been B1 corrected. Conventional qMT fitting requires the assumption of a specific saturation-lineshape, typically super-lorentzian in CNS tissue. However, no studies have confirmed the correct line-shape assumption for CSF, or even in healthy or damaged tissues. Because of the lack of knowledge about the line shape, and the unconventional approach of estimating the MT effect in the CSF, we chose to utilize the single-point qMT model. The single-point fitting approach utilizes the 2-pool MT model to apply T1, B1, and B0 corrections to the MT-weighted signal at one offset frequency (e.g., the MTR) to generate an estimate of the PSR. 21 Therefore, the offset frequency and RF amplitude were corrected on a voxel-by-voxel basis using the B0 and B1 maps, and the PSR was derived voxel-by-voxel utilizing the additional input of R1.
MTR and single-point qMT
Contrary to a qMT fit to the entire MT-weighted z-spectra obtained with multiple saturation parameters (full-fit model), for the single-point model, the exchange rate (kmf), macromolecular T2 (T2,m), and free-pool T2 (T2,f) can be fixed, as they exhibit relatively constant values across tissue types,3,4 however they have only been studied in healthy WM and GM. The details for parameter estimation for the single-point qMT model in the spinal cord are shown in Smith et al.
14
The remaining free parameter in the model, PSR, is then estimated using a single normalized MT-weighted scan at offset frequency and saturation power (MTR), which is corrected by B1, B0, and R1. In this work, values for fixed assumptions were selected to be those derived from WM and GM, and deviations from the assumptions could increase (or decrease) the observed PSR leading to a bias. While we recognize that a bias may exist by incorrectly assumed values for fixed parameters, since the same assumptions are utilized in both HC and pwRRMS, comparisons between cohorts can be evaluated. Lastly, the single-point fit, while it provides an estimate of the PSR, is, in fact, an MTR measurement that has been corrected for T1, B1, and B0, and a model is employed solely to apply these corrections. As such, the qMT acquisition was also used to calculate standard MTR maps (without B1, B0, and T1 correction) using the equation:
WM, GM and CSF were automatically segmented from the mFFE using Spinal Cord Toolbox v3.2.7 (NeuroPoly, Montreal, Canada) 24 and applied to all other image types that were co-registered to the mFFE. Anatomical images in axial and sagittal planes, anatomy labels, and tissue segmentation are shown in Figure 1 for an HC subject. Note that the CSF was eroded around the contact with the cord to minimize partial volume effects with the spinal cord WM. CSF was selected as the area outside the spinal cord and within the spinal canal for the same C2–C5 FOV as seen in blue in Figure 1.

Axial anatomical image (left top) and segmentation (bottom left). Also shown is the sagittal T2 (right) with FOV (yellow box).
Statistical analysis
Statistical comparisons were performed on the mean values within each tissue type (WM, GM, and CSF). Box plots were created for both cohorts, comparing values of MTR, PSR, and R1,obs in each tissue type. A nonparametric Wilcoxon rank sum test was performed to determine any group differences in the mean PSR, MTR, and R1,obs values for each tissue type. The correlation of CSF PSR and WM PSR with EDSS score was assessed using Spearman Rank correlations. The correlation of SC PSR and WM PSR with CSF PSR was also assessed. Reproducibility was assessed using a Bland Altman test for both PSR and MTR in all tissue types over repeat visits in healthy volunteers. Reported are the normalized Bland-Altman difference (DBA), 95% confidence interval, and the limits of agreement. A significance threshold of α = 0.05 was used for all statistical analyses.
Results
Cohort differences
Anatomical mFFE, MTR, PSR, R1,obs, B1, and B0 maps for a representative HC and pwRRMS are displayed in Figure 2. MTR and PSR are decreased in the WM and GM of pwRRMS (blue and green) when compared to the HC (yellow and red). As expected, all MT indices are lower in CSF relative to spinal cord tissue. In pwRRMS, however, CSF MTR and PSR values are higher than in HC. The MTR map in one MS patient shows a mottled appearance in the left lateral CSF, while PSR shows hyperintensity in the dorsal CSF. No notable differences are observed for R1,obs in either the GM, WM or CSF. R1,obs, B1, and B0 maps are shown for completeness. Note, the differences in the B0 and B1 maps between these two individuals highlighting the need for B1, B0, and R1 correction.

Anatomical data (a), MTR (b), PSR (c), R1,obs (d), B1 map (e), and B0 map (f) for representative healthy control (left column) and MS patient (right column). Observe the decrease in the MTR and PSR within the spinal cord of the MS patient when compared to the control, accompanied by increases in the surrounding CSF.
The mean and standard deviation for MTR, PSR, and R1,obs for each tissue type (CSF, WM, GM, Lesion) are shown in Table 2.
Mean tissue values.

*p > 0.05.
MTR: magnetization transfer ratio; PSR: pool size ratio; CSF: cerebrospinal fluid; WM: white matter; GM: gray matter.
Figure 3 compares the mean values for each subject within the CSF, GM, and WM for the HC and pwRRMS groups. The MTR in the CSF was significantly higher in pwRRMS (p = 0.027) and trended lower in the GM and WM, though not statistically significant (p = 0.255, p = 0.278, respectively). PSR is significantly different in all tissue types, pwRRMS PSR is higher in CSF (p = 0.020) and lower in the GM (p = 0.010) and WM (p < 0.001). R1,obs are similar in the CSF of pwRRMS and lower in the GM and WM, but no significant differences were detected.

Cross cohort box plot comparison for MTR, PSR, and R1obs in each tissue type (CSF, WM, GM). Only CSF values exhibited significant differences in MTR (p = 0.027) and all tissue types were significantly different in PSR (pCSF = 0.020, pWM < 0.001, pGM = 0.023). In both MT measurements, values in patients are higher in the CSF and lower within the cord when compared to healthy controls. No differences were found in the R1obs values.
Associations among tissue types and clinical disability
Associations between CSF PSR and EDSS (A), WM PSR and EDSS (B), SC PSR and CSF PSR (C), and WM PSR and CSF PSR (D) as shown in Figure 4. In pwRRMS, CSF PSR is significantly correlated with EDSS (p = 0.045, R = 0.352) (4A), while WM PSR and EDSS were not correlated (p = 0.866, R = −0.036) (4B). CSF PSR exhibits a trending negative correlation with SC PSR (p = 0.063, R = −0.371) (4C), and a trending negative correlation with WM PSR (p = 0.095, R = −0.347) (4D).
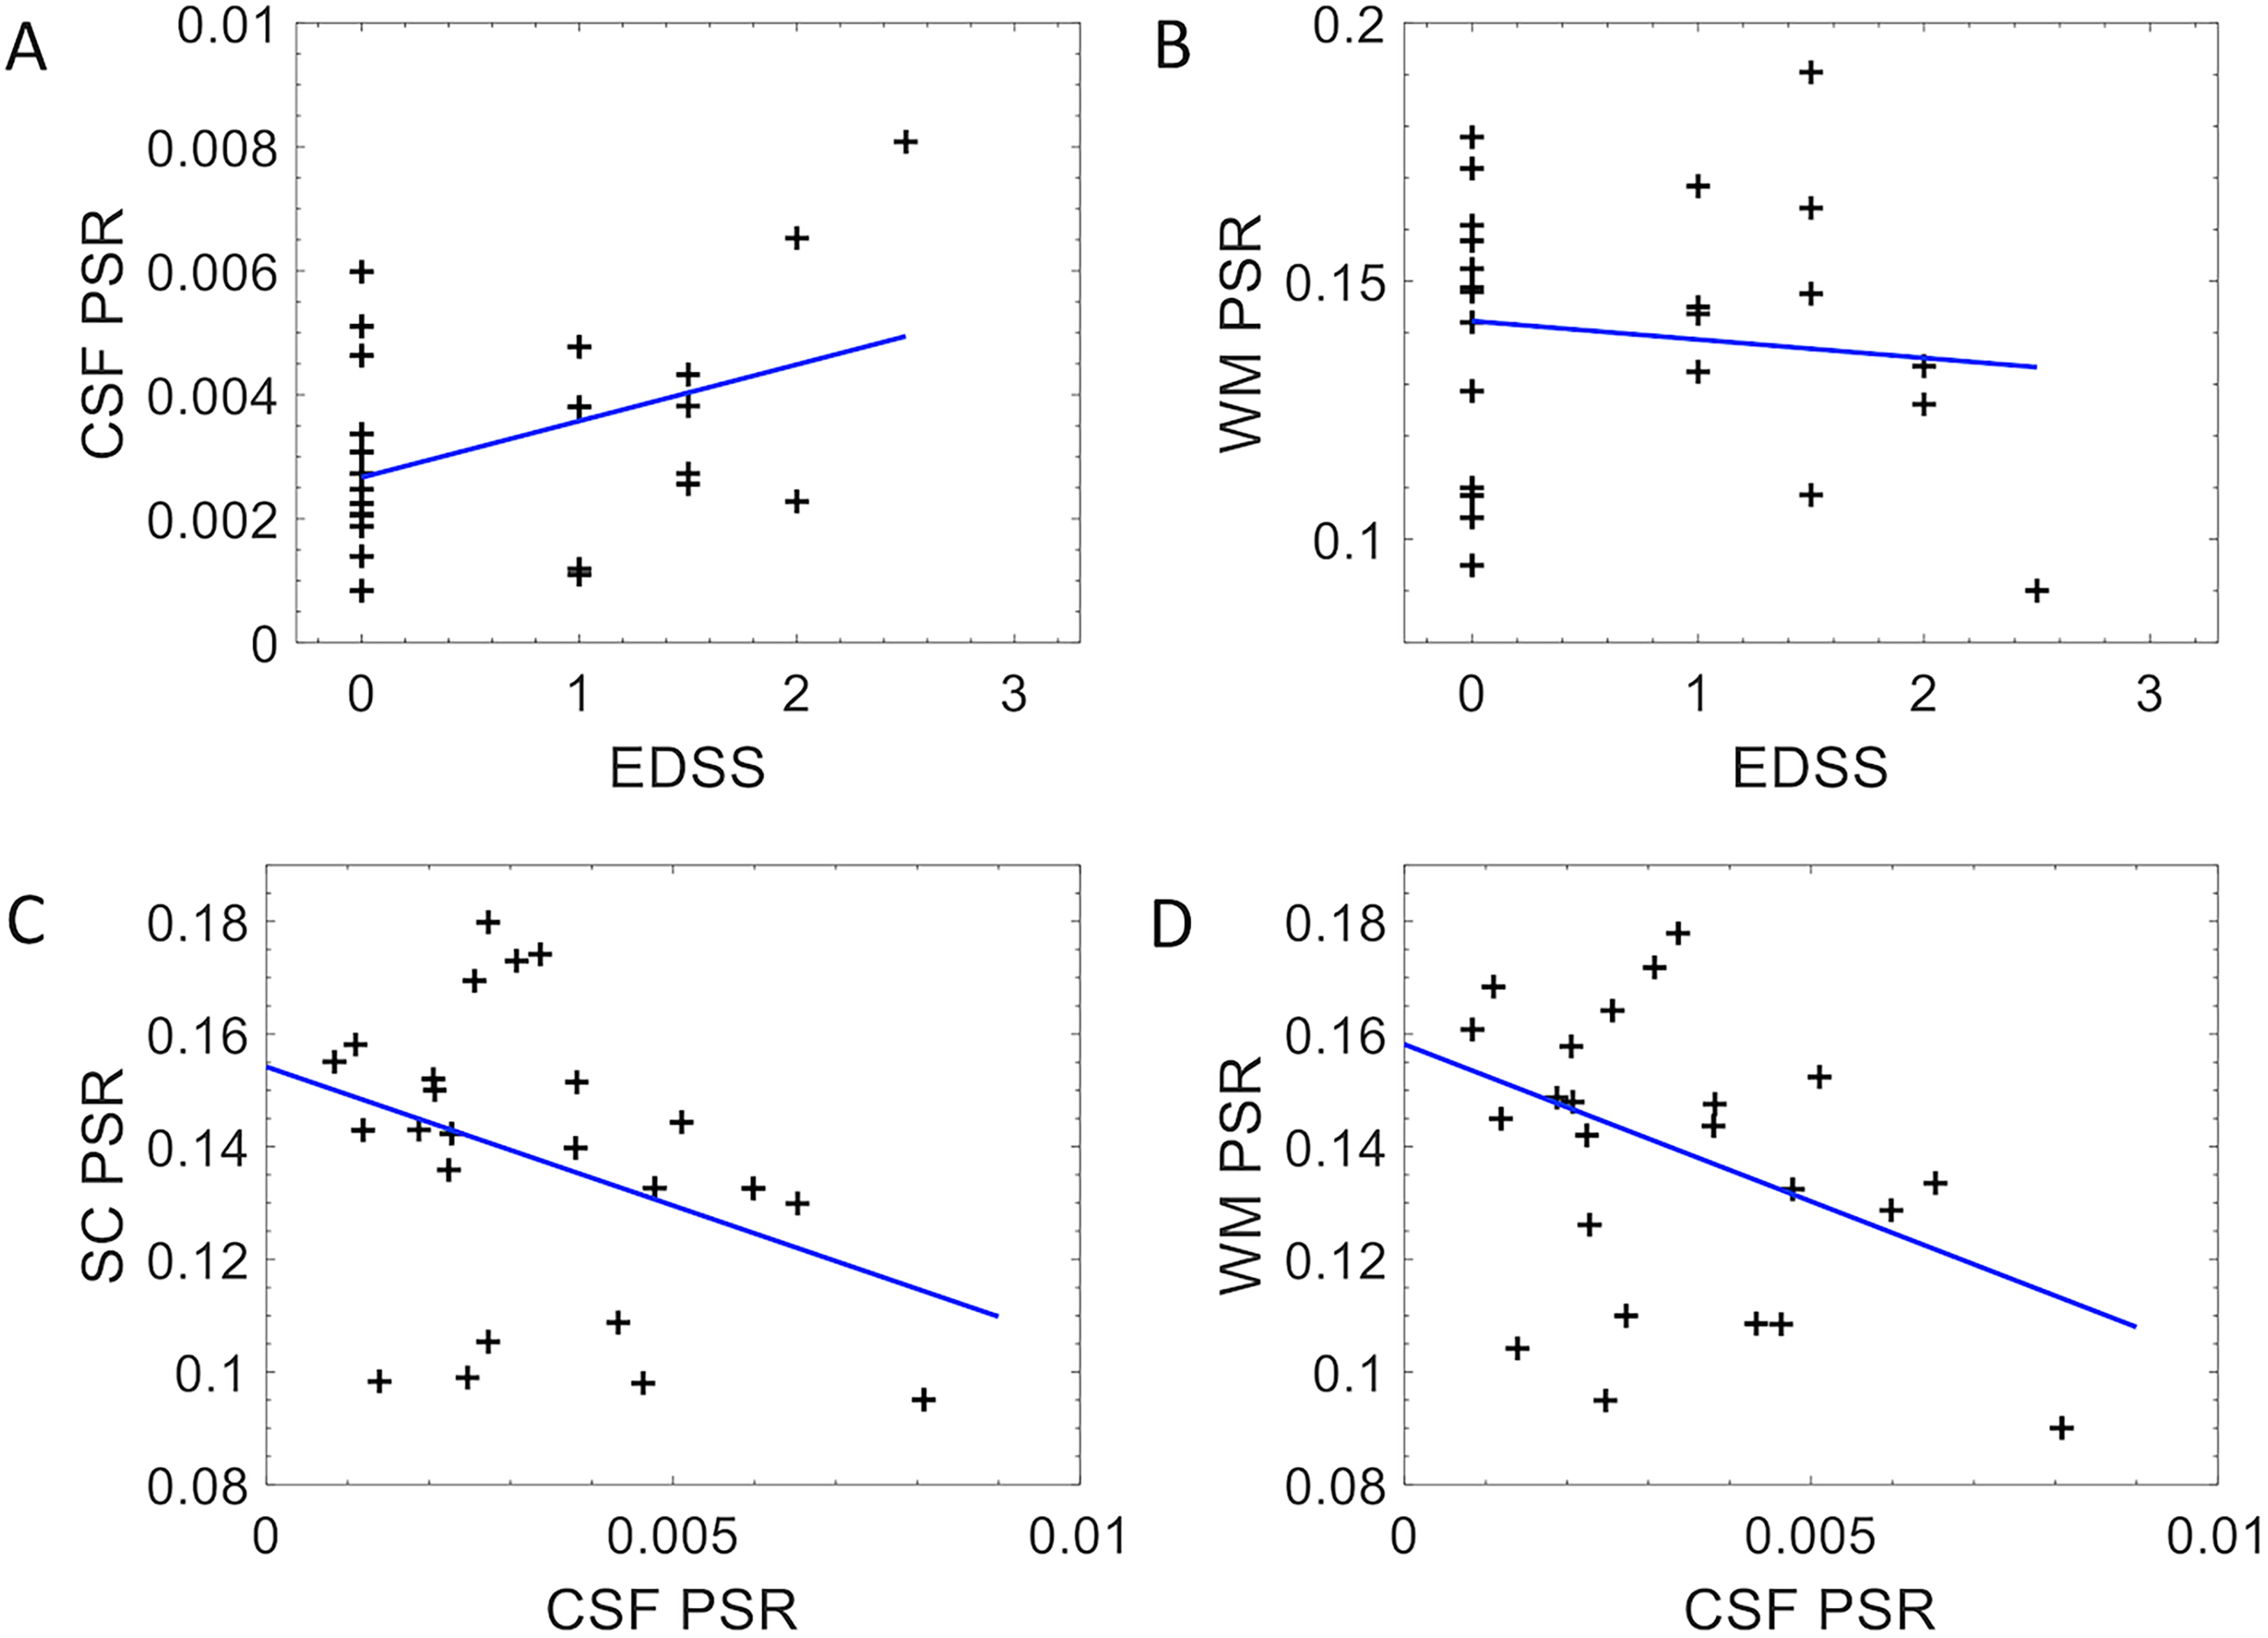
Correlation plots comparing CSF PSR in MS patients to expanded disability status scale (EDSS) score (A) (p = 0.045, rho = 0.352) and WM PSR to EDSS (B) (p = 0.866. rho = −0.036). Correlation plots comparing SC PSR to CSF PSR (C) (p = 0.063, rho = −0.371) and WM PSR to CSF PSR (D) (p = 0.095, rho = −0.347).
Reproducibility
Reproducibility was assessed using Bland-Altman, interclass correlation coefficients (ICC) and mean coefficients of covariances for CSF and WM for both PSR and MTR as shown in Figure 5. For Bland–Altman analysis, the dotted red lines indicate the 95th percentile confidence interval (±1.96 SD), and in each imaging method and tissue type, overlaps 0, indicating no bias in the reproducibility estimate. Note, however, that the PSR measures are slightly more clustered around the mean difference. Regarding ICC, both measures, MTR and PSR in the CSF show strong reproducibility with ICC = 0.74 and 0.80, respectively. When considering the WM, the ICC is slightly lower for the PSR and, due to the clustering of data, low for the MTR. Regarding the coefficients of variation, WM MTR and PSR are lowest (<10%) while the variation for CSF is higher. This is not unexpected as the MTR and PSR were designed to exploit contrast from WM and some optimizations need to be explored to improve both the model and sensitivity for CSF characterization. In all, reproducibility is in the moderate to strong range for both MTR and PSR for both tissue types.

Evaluation of reproducibility for CSF MTR, WM MTR, CSF PSR, and WM PSR in healthy control subjects. Plots demonstrate Bland–Altman characterization of reproducibility, where red-dotted lines indicate 95% confidence interval of mean difference, black solid line shows the mean difference. In each plot, the 95th percentile overlaps 0, indicating no observable bias. CSF MTR and PSR show strong agreement as shown by ICC, with the latter showing slightly greater reproducibility compared to the former, however, the mean coefficient of variation for the former is lower than the latter. For WM, the ICC for MTR is clustered and does not show a strong correlation with follow-up, however, the coefficient of variation for WM MTR is low, as is WM PSR. It is expected that the variation in WM is lower as both the MTR and PSR are designed to be sensitive to white matter changes, more so than tailored for CSF evaluation.
Discussion
CSF imaging and MT indices
We demonstrated that MT (qMT-derived PSR and MTR) is abnormal in the CSF in pwRRMS compared to HC. In pwRRMS, we identified a negative correlation between WM PSR and CSF PSR, as well as a positive correlation between CSF PSR and clinical disability (EDSS). Finally, we demonstrated that both the PSR and MTR techniques are repeatable for both CSF and WM.
Despite the increasing evidence of CSF-mediated neurologic waste clearance, imaging of CSF has been limited to flow dynamics and volumetric measurements. This is primarily because of the limited information that can be provided by standard T1-w and T2-w images, and, until recently, no MRI methodology could provide evidence of CSF abnormalities in disease populations. MT imaging has a long history of providing indices sensitive to demyelination, however, has not been studied in the CSF due to the general, expected lack of macromolecular aggregates that would give rise to MT signals. However, we recognized that the CSF MT was different in HCs and patients with MS prompting a further evaluation into using MT as a probe for CSF abnormalities relating to MS in vivo.
Even though MTR is sensitive to non-physiological parameters,10,11 we included it in this evaluation because it is the most commonly used method for evaluating MT changes in clinical practice, does not require fitting, or advanced modeling and yet has been shown to correlate with myelin concentration. 7 qMT corrects for these nonphysiological dependencies and potential sources of error through application of R1, B0, and B1 corrections using a model and can provide indices that are more physiologically linked such as PSR, which is also strongly associated with myelin density throughout the CNS.14,15,20 Our MT measurements within the SC are consistent with previous studies of demyelinating disorders14,15,20: detecting decreased PSR and MTR in MS patients compared to HCs. Similarly, measures in the CSF indicate increased MT effect in the CSF of MS patients compared to controls, which, to our knowledge, is the first report of such a finding.
CSF-mediated CNS waste clearance and correlation to disability
Recent research pertaining to the glymphatic system indicates that the CSF serves as a critical mediator of CNS parenchymal waste products which traverse the subarachnoid CSF en route to clearance from the CNS. Our preliminary findings demonstrate abnormal MT indices in the subarachnoid CSF pool of MS patients, which could reflect macromolecular waste product accumulation in the setting of MS. Other explanations for this finding include increased cellular content and increased proinflammatory proteins such as cytokines, chemokines and immunoglobulins. The increased CSF PSR of MS patients and the apparent negative correlation between PSR in the WM versus the CSF (although this did not reach statistical significance) raises the possibility of parenchymal to CSF demyelination product clearance that merits further investigation. CSF PSR also shows a correlation to EDSS, highlighting a potential biomarker of disease. Identifying imaging correlations to clinical measures of disability has long been an issue in radiological studies of MS. 25 Previous investigation has demonstrated substantially different cellular and protein content in ventricular CSF as compared to lumbar CSF in MS patients. 26 Future studies should measure the MT indices within the various CSF compartments to further characterize the etiology and significance of the elevated cervical CSF MT signal seen in MS patients in this study.
Study limitations and conclusions
While this study is preliminary and opens the door for further studies, we report some limitations to the current study. For qMT, we utilized an MT pulse sequence with saturation (saturation power, duration, and offset frequency) and readout (excitation flip angle, sequence TR) parameters optimized for SC GM and WM. 21 However, we recognize that these pulse sequence parameters could be improved for CSF-specific imaging. Nevertheless, MTR and qMT-derived parameters showed a high degree of reproducibility both within the SC and surrounding CSF. CSF-MTR and CSF-PSR coefficients of variation are noted to be relatively elevated, possibly limiting the ability of these measures to detect small differences between patient populations and longitudinal changes within the same subject. Future studies would benefit from CSF-specific MT pulse sequence refinement to reduce these coefficients of variation.
We chose to evaluate the single-point qMT over the “full-fit” model typically used in qMT experiments. 27 While the single-point method requires more assumptions than the full model, it can be a useful tool for estimating the PSR in healthy and damaged SC. 20 Regarding single-point qMT in the CSF, the assumptions used may not be suitable for extracting true PSR from the CSF, however, to compare with the MTR, we chose to use the single-point model of qMT to apply corrections to the MTR to remove dependencies on B1, B0, and T1. Further validation of the assumptions for the CSF is necessary to ascertain truer values of the PSR. Incorrect assumptions applied to the single-point model will result in a bias in the observed PSR, however, we feel that the measurements result in consistent indices that are potentially more reproducible than the model-free MTR. A similar argument is made for the calculation of the observed R1, where MFA measurements can bias T1 measurements to a lower value than inversion-recovery-based assessments. Lastly, it is assumed that the exchange rate in CSF is the same as that of spinal cord tissue. We recognize that this assumption needs to be further studied, though previous work has shown that the dependency on the exchange rate for single-point qMT is relatively weak, but can create a bias.
In summary, we understand that the single-point qMT model and the pulse sequence chosen were designed for SC WM and that assumptions as well as model-fitting can result in a bias. However, we show that the calculated indices are reproducible, and correcting for B1, B0, and T1 using the single-point qMT model improves associations, and enhances differences between healthy and MS CSF compared to the standard, uncorrected MTR.
We recruited patients with short disease duration and low clinical disability (EDSS ≤ 2), which may limit the association between WM PSR and EDSS (Figure 4). However, there were statistically significant differences between HC and pwRRMS for PSR in the GM, WM, and CSF (Figure 3). The MTR was not different between HCs and MS patients for GM and WM, but differences within CSF were noted. The lack of MT correlation between WM MT measures with EDSS may relate to the relatively small sample size and small range of EDSS values in this population. However, a continuation of this study would include a larger patient cohort with a wider range of clinical disabilities, age and sex-matched controls, and longitudinal assessment of neurological change as well as changes in tissue abnormality.
A full analysis of CSF samples in congregation with MRI findings would also reveal correlations to biomarkers typically used in the differential diagnosis of MS using CSF. Such tests include measurements of elevated levels of IgG, the presence of MBP, and the CSF/serum albumin ratio, which is an indicator of blood-CSF barrier disruption. 28 We also intend to perform lipid and proton magnetic spectroscopy (1H-MRS) on samples from both MS and HC populations to establish differences in CSF composition and evaluate how these differences are reflected in qMT experiments in vivo. 29
This study demonstrated that MT MRI is sensitive to cervical CSF abnormalities in patients with MS and that elevated CSF PSR values correlated with measures of clinical disability. Further comparison of regional CSF MT MRI differences and correlation mass spectrometry laboratory CSF analysis is needed to provide insight into the molecular processes occurring within the CSF in the setting of MS demyelination.
Supplemental Material
sj-doc-1-mso-10.1177_20552173231211396 - Supplemental material for Detecting macromolecular differences of the CSF in low disability multiple sclerosis using quantitative MT MRI at 3T
Supplemental material, sj-doc-1-mso-10.1177_20552173231211396 for Detecting macromolecular differences of the CSF in low disability multiple sclerosis using quantitative MT MRI at 3T by Richard D Lawless, Colin D McKnight, Kristin P O’Grady, Anna JE Combes, Baxter P Rogers, Atlee A Witt, Mereze Visagie, Delaney C Houston, Logan E Prock, Francesca R Bagnato and Seth A Smith in Multiple Sclerosis Journal – Experimental, Translational and Clinical
Footnotes
Acknowledgments
The authors would also like to thank the VUIIS technologists (Christopher Thompson, Clair Jones, Leslie McIntosh, and Kristen George-Durett), VUIIS Center for Human Imaging, and Dr Alex Smith for their contributions to this project.
Authors’ Notes
Richard D. Lawless and Colin D. McKnight contributed equally to the production of this article.
Declaration of conflicting interests
The authors declared no potential conflicts of interest with respect to the research, authorship, and/or publication of this article.
Funding
The authors would like to acknowledge and thank the sources of funding for this project: Conrad Hilton Foundation (SAS), National MS Society (SAS), NIH/NINDS 1R01NS109114-01 (SAS), NIBIB T32EB021937, and Radiological Society of North America (CDM), NIH/NIBIB 5K01EB030039 (KPO).
Supplemental material
Supplemental material for this article is available online.
References
Supplementary Material
Please find the following supplemental material available below.
For Open Access articles published under a Creative Commons License, all supplemental material carries the same license as the article it is associated with.
For non-Open Access articles published, all supplemental material carries a non-exclusive license, and permission requests for re-use of supplemental material or any part of supplemental material shall be sent directly to the copyright owner as specified in the copyright notice associated with the article.