
Abstract
Background
To date, little is known about the presence and extent of cerebellar cortical pathology in early stages of MS.
Objective
The aims of this study were to (i) investigate microstructural changes in the normal-appearing cerebellar cortex of early MS patients by using 7 T MRI and (ii) evaluate the influence of those changes on clinical performance.
Methods
Eighteen RRMS patients and nine healthy controls underwent quantitative T1 and T2* measurement at 7 T MRI using high-resolution MP2RAGE and multi-echo gradient-echo imaging. After subtracting lesion masks, average T1 and T2* maps were computed for three layers in the cerebellar cortex and compared between groups using mixed effects models.
Results
The volume of the cerebellar cortex and its layers did not differ between patients and controls. In MS patients, significantly longer T1 values were observed in all vermis cortical layers and in the middle and external cortical layer of the cerebellar hemispheres. No between-group differences in T2* values were found. T1 values correlated with EDSS, SDMT and PASAT.
Conclusions
We found MRI evidence of damage in the normal-appearing cerebellar cortex at early MS stages and before volumetric changes. This microstructural alteration appears to be related to EDSS and cognitive performance.
Introduction
Histopathological studies have shown that the cerebellar cortex of multiple sclerosis (MS) patients represents a predilection site for demyelination and that this region is particularly affected in late-stage MS patients, where about 40% of cerebellar cortical area is affected. 1 Similarly to what reported in the forebrain cortex, focal demyelinated areas are also found in the cerebellar cortex of MS patients: they involve the cerebellar cortex and the adjacent white matter (leukocortical lesions), small intracortical perivenous areas (pure intracortical lesions)1,2 and (most frequently) they affect the cerebellar cortex in a band-like manner (subpial lesions). 3 In most instances, the cerebellar cortex is affected independently from white matter (WM) lesions and areas of cortical demyelination in the cerebellum show relative preservation of neurons, axons and synapses. 1
Cerebellar damage in MS patients has been shown to be a major determinant of disability and to represent a predictor of poor outcome. 4 Cerebellar abnormalities may affect both the coordination and control of movements as well as cognition and affective processes in patients suffering from MS. 5 Besides, alterations in cerebellar–neocortical connectivity may affect adaptive changes in brain motor control in MS patients and healthy controls.6–8
For all these reasons, sensitive measures of alterations in cerebellar cortical integrity might provide not only a new window into early changes in MS pathology but also potential means to screen patients requiring therapies that are more aggressive.
Ultra-high-field MRI may provide new insights into cerebellar pathology throughout early MS stages, due to the improved spatial-resolution, the lower partial-volume effects, and the higher contrast-to-noise-ratio (CNR) achievable in clinically compatible scan times. Magnetization-prepared 2 inversion-contrast rapid gradient-echo (MP2RAGE) 9 at 7 T enables the generation of quantitative T1 maps. T1, the longitudinal relaxation time in MRI, is influenced by the amount of macromolecules (eg. myelin) in the tissue and, to a lesser extent, by the presence of paramagnetic substances, like iron. 10 Hence, shorter T1 relaxation time (RT) indicates an increase of brain macromolecules or iron content while longer T1-values suggest a loss of brain structural integrity or iron concentration. Multi-echo gradient-recalled echo (ME-GRE) at 7 T MRI provides high-spatial resolution quantitative T2* maps. The T2* RT describes the loss of transverse magnetization due to T2 relaxation and to magnetic field inhomogeneities. Essentially, it reflects microscopic susceptibility variations which are induced by tissue components with different magnetic behavior. An increase in T2* most often indicates a reduction of macromolecules (myelin, cell membranes, proteins), while a decrease suggests an augmented iron concentration or increased density of macromolecules. 11
By combining T1 and T2* measurements at 7 T, we have recently shown a decrease in mean T1 RT from the outer to the inner layer of the cerebellar cortex in healthy subjects. This pattern was attributed to an increase in myelination in the deeper layers of the cerebellar cortex, 12 similar to what has previously been reported for the forebrain.13,14
By exploiting the above-mentioned methodology, in this work we aimed to explore (i) the presence of microstructural changes in the normal-appearing cerebellar cortex of early MS patients by using ultra-high field magnetic resonance imaging (MRI) and (ii) the potential relation of those changes withclinical disability, motor and cognitive performance.
Methods
In this pilot study, we recruited eighteen relapsing-remitting MS (RRMS) patients [14 females, mean age 34 years, less than five years disease duration, mean Expanded Disability Status Scale (EDSS) 1.6 (range 1–2), 9/18 had very mild cerebellar deficits (as defined by SARA – Scale for assessment and rating of Ataxia – 1 ≤ 4) and nine age-matched healthy controls (7 females, mean age 32 years)]. All participants provided written informed consent and the studies were approved by the local ethics committee.
Imaging
MS patients and healthy controls underwent quantitative T1 and T2* MR imaging using high-spatial resolution MP2RAGE 15 (repetition time TR =6000 ms, echo time TE = 2.84 ms, first inversion time TI1=750 ms, second inversion time TI2 =2350 ms, first flip angle = 4°, second flip angle = 5°, matrix size 300 × 320 × 160, voxel size 0.75 ×0.75 × 0.9 mm3) and a ME-GRE sequence (TR = 45 ms, TE1 = 4.59 ms, TE9 = 41.3 ms, with an echo spacing, ΔTE, of 4.59 ms, matrix size 300 × 320 × 160, voxel size 0.75 × 0.75 × 0.9mm3) acquired on a Siemens Magnetom 7 T head-only scanner (Siemens Healthcare Sector, Germany) with a single-channel transmit and 32-channel receive volume coil (Nova Medical Inc, MA, USA). A map of the transmit B1 field was acquired by means of a SA2RAGE sequence (TR = 2400ms, TE = 0.72 ms, matrix 116 × 128 × 64, voxel size 2.3 × 2.3 × 4mm3, same transmit voltage as MP2RAGE). The T2*-maps were generated from a 3D multi-gradient echo dataset with nine echo times. Three dielectric pads were placed around the upper neck to improve the inversion efficiency over the cerebellum and whole brain B1 homogeneity as reported in. 12 T1 and T2* RT were mapped onto three different layers of the cerebellar cortex using the method recently presented by Boillat et al. 12 In short: the cerebellar cortex was segmented into three layers of equal dimension using CBS Tool (www.cbs.mpg.de/institute/software/cbs-tools) as previously reported by our group. 16
Before extracting the T1 and T2* values, the lesion masks were subtracted in order to study the normal-appearing cerebellar GM pathology in our patients’ cohort. Average T1- and T2* maps were computed for each layer in the hemispheres and vermis. Both hemispheres and the vermis were separated based on the CHROMA atlas (a group-wise average of a T1-map acquired at high resolution), which is part of the CBS Tools. (Fig. 1)

Summary of the processing pipeline to extract T1 and T2* RT from different cerebellar lobules and layers (a detailed description is provided in ref. 12). First, T1 and T2* maps are registered to the MNI space and a chroma atlas is registered to T1 and T2* maps. Then a Multiple Object Geometric Deformable Model (MGDM) segmentation is applied to the T1 maps to obtain cerebellar WM and GM masks, which are then manually corrected. Further, Fuzzy and Noise Tolerant Adaptive Segmentation Method (FANTASM) is subsequently applied to segment the masked cerebellum into WM, GM and CSF, followed by Cortical reconstruction using implicit surface (CRUISE) to differentiate the three cerebellar layers. T1 and T2* RT are then extracted using the three layers and lobules from the CHROMA atlas as masks.
Cerebellar cortical and cerebellar layers volumes
Cerebellar cortical volume was assessed on MP2RAGE images by using the CBS Tool 16 in both patients and controls.
Cerebellar cortical lesions
Lesions were identified and delineated manually on the so-called uniform MP2RAGE images, which are obtained through a complex ratio of images acquired at two different inversion times, as described by Marques et al. 15 (see Fig. 2) The manual segmentations were performed by consensus between 1 radiologist (A.T., 6 years of experience) and 1 neurologist with expertise in MS and neuroimaging (C.G., 13 years of experience). Each lesion was labeled as either 1) leukocortical, extensions of WM lesions in the folia, affecting adjacent cortical tissue and 2) intracortical, lesions within the cerebellar cortex without contact to the WM. Mean T1 and T2* values were extracted from cortical cerebellar lesions.
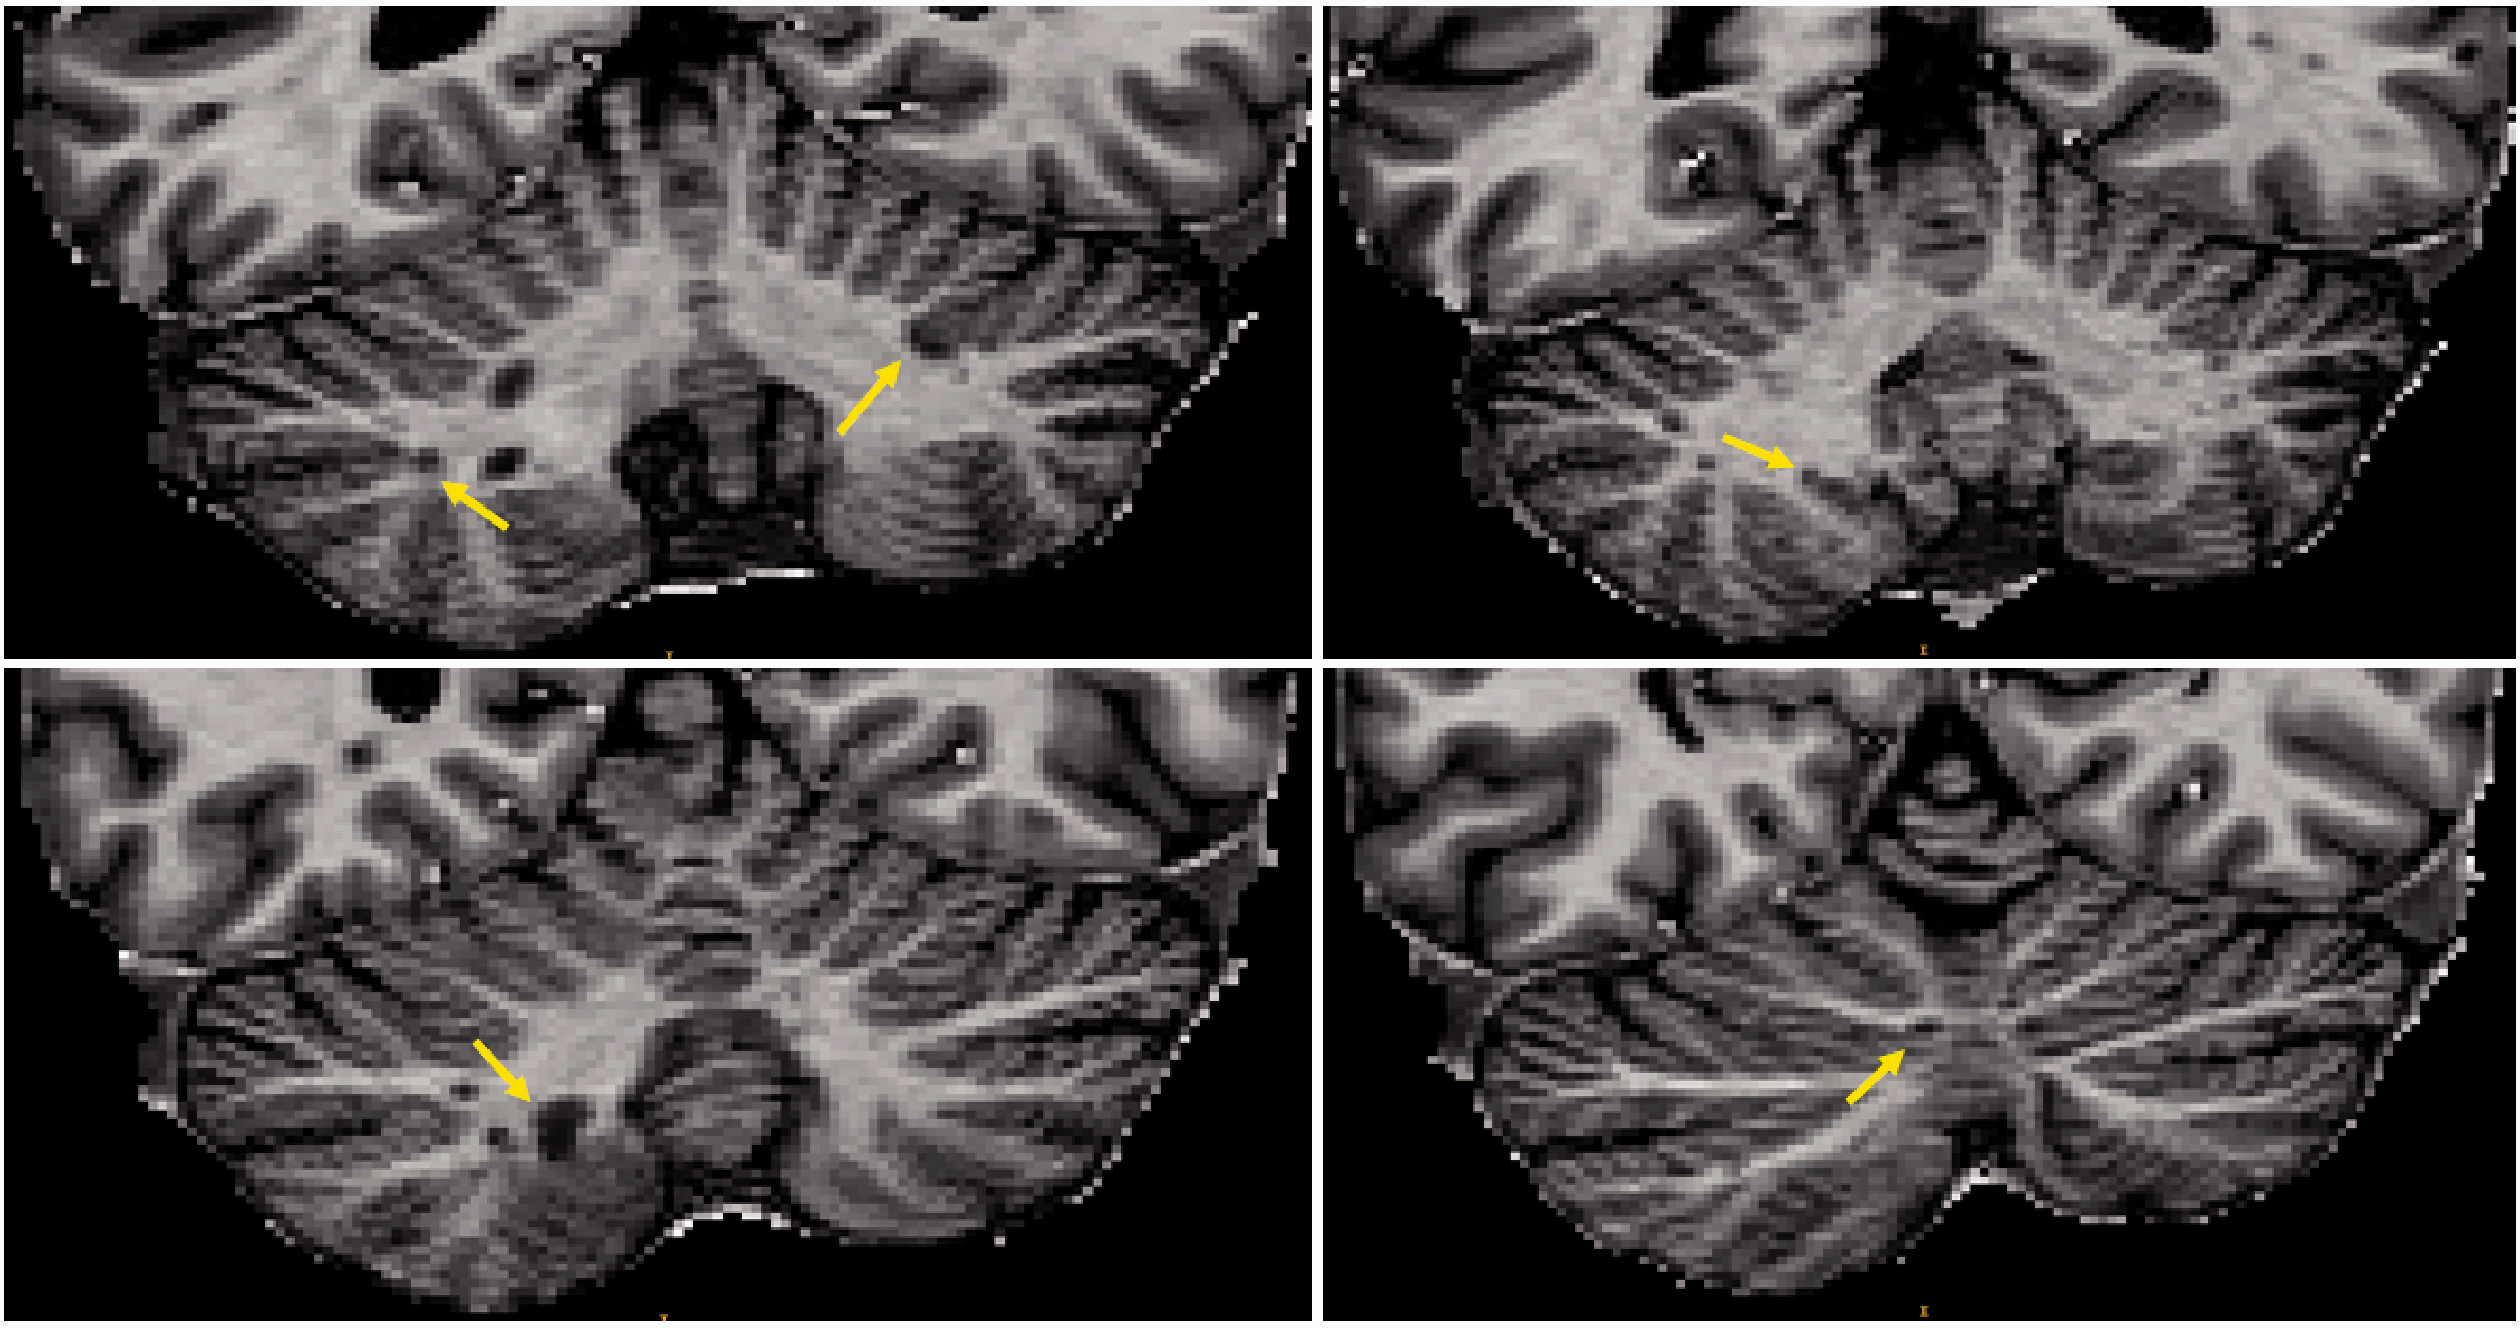
Cerebellar cortical lesions in axial MP2RAGE uniform images.
Total cerebellar cortical lesion load provided by the lesion mask was subtracted from total cerebellar cortex volume, in order to segment the normal appearing cerebellar cortex. Mean T1 and T2* RT were then computed for the normal-appearing cortical tissue.
Clinical assessment
Clinical disability was measured using the Expanded Disability Status Scale (EDSS) before the MRI scan. Grade of cerebellar involvement was assessed by means of SARA – Scale for assessment and rating of Ataxia, composed of 8 items related to gait, stance, sitting, speech, finger-chase test, nose-finger test, fast alternating movements and heel-shin test. The motor performance was evaluated by means of the Timed 25-Foot Walking (T25-FW) and the 9-Hole Peg Test (9-HPT). Cognition was assessed using selective reminding tests (SRT) (SRT-Long Term Storage, SRT-Consistent Long-Term Retrieval and SRT-Delayed), Spatial Recall Test (SPART), Spatial Recall Test Delayed (SPART-D), Symbol Digit Modalities Test (SDMT) and Paced Auditory Serial Addition Test (PASAT).17,18
Statistical analysis
Average T1- and T2* maps were computed for each layer in the hemispheres and vermis and then compared between patients and controls using mixed effects models. False discovery rate was applied to correct for multiple comparisons.
Between-group comparison in cerebellar layers volume and cerebellar volume was performed using a univariate t-test since the two groups did not differ for age and gender (Table 1).
Characteristics in MS patients and healthy controls (HC).

As explorative analysis, a generalized linear model was performed using the mean T1 in the middle/external cerebellar cortical layers (vermis and hemispheres were considered as one region), the mean lesion volume in the cerebellum, and age as independent predictors and clinical scores (EDSS, 9-HPT, T25-FW, SRT-LTS, SRT-CLTR, SRT-D, SPART, SPART-D, SDMT and PASAT) as outcome. Backward-stepwise selection was performed to select the best prediction model for each clinical score. A leave-one-out cross-validation (LOOCV) was conducted to assess the prediction quality of each model.
Results
Demographics and number of cortical cerebellar lesions are reported in Table 1, T1 and T2* RT of cerebellar normal-appearing grey matter (NAGM) and cortical lesions in Table 2. Clinical scores in MS patients are summarized in Table 3.
T1 and T2* RT in cerebellar normal appearing grey matter (NAGM) of patients and cerebellar grey matter (GM) of healthy controls (HC) and in cerebellar cortical lesions.

Clinical scores in MS patients.

EDSS: Expanded Disability Status Scale; 9-HPT: 9-Hole Peg Test; T25-FW: Timed 25-Foot Walk Test; SRT-LTS: Selective Reminding Test - Long Term Storage; SRT-CLTR: Selective Reminding Test - Consistent Long - Term Retrieval; SPART: Spatial Recall Test; SPART-D: Spatial Recall Test Delayed; SRT-D: Selective Reminding Test-Delayed Recall; SDMT: Symbol Digit Modalities Test; PASAT = Paced Auditory Serial Addition Test.
Cerebellar lesions
Based on manual segmentation of MS lesions, our cohort of patients exhibited a total of 15 cerebellar cortical lesions (median, range: 0, 0–10) with an average lesion volume of 72.1 µL. The total number/average volume per lesion of the subcategories of cortical lesions were 14/76.4 µL (leukocortical) and 1/11.6 µL (intracortical), respectively.
T1 RT in the grey matter part of cortical lesions (1899.4 ± 198.6 ms) were longer than those in normal-appearing cortical tissue (1794.8 ± 85.6 ms, p < 0.05), whereas T2* RT (33.2 ± 5.9 ms) did not differ (32.6 ± 2.1 ms).
Volumetric and T1/T2* relaxometry in the normal appearing tissue of three cerebellar cortical layers in MS patients and controls
Cerebellar cortex volume did not statistically differ between MS patients and healthy controls, nor did the volume of the different layers.
In MS subjects, significantly longer T1 RT values were observed in all vermis layers (p for individual layers <0.01 to <0.02), and in the middle and external layer of the cerebellar hemispheres (p < 0.03, Fig. 3)

Quantitative T1 RT in cerebellar vermis and hemispheres, comparison between healthy controls and MS patients. Significantly longer T1 RT are found in MS patients in all three vermis layers (p < 0.01 to < 0.02) and in the middle and external layer of the cerebellar hemispheres (p < 0.03).
No between-group differences in T2* values were found (see Table 2).
Relationship between T1 relaxometry in the normal appearing tissue of three cerebellar cortical layers in MS patients and clinical tests
The T1 RT values of the mean outer layer of the cerebellar cortex correlated with EDSS (P < 0.01, adjusted R2 = 0.4), see supplementary data. Besides, T1 RT values in the middle layer and mean outer layer were associated to SDMT (P < 0.05, adjusted R2 = 0.4) and PASAT scores (P < 0.05, adjusted R2 = 0.5), see supplementary data.
Discussion
In this pilot study, we measured longer T1 RT in some layers of the normal-appearing cerebellar cortex in early MS patients compared to healthy subjects. These results suggest the presence of widespread microstructural damage in the cerebellar cortex at early stages of the disease, which appear to be independent from the presence of detectable focal lesions and of cerebellar cortical atrophy.
Since cerebellar involvement is predictive of development of greater disability and poor prognosis in MS patients, 4 it is of the utmost importance to have it recognized as early as possible. The detection of early cerebellar involvement in MS could in fact permit to identify patients that may benefit of a more aggressive therapeutic approach than the one currently suggested.
To date, few studies addressed the presence of cerebellar abnormalities in early MS. Cortical cerebellar lesions and cortical atrophy in the cerebellum was reported in clinically isolated syndrome (CIS) patients or at early RRMS stages in patients with mild disability and on therapy.9,19–21 Previous work of our group using multicontrast connectometry revealed subtle local connectivity disruptions in a group of early MS patients and suggested loss of axonal integrity in local cortico-cortical cerebellar connections. 22 Up to the present time, however, there are no studies attempting to measure microstructural damage in the normal-appearing cerebellar cortex in early stage MS. This is mainly due to technical challenges arising from the tight folding of this histological structure and the relatively poor contrast and resolution of conventional brain imaging.
Thanks to ultra-high-field MRI, it is now possible to investigate the brain tissue in-vivo at a sub-millimeter resolution, which is of crucial importance to study thin and convoluted brain structures like the cerebellar cortex.23,24 In this study, we performed a quantitative laminar analysis at 7 T MRI and compared the T1/T2* RT measured in different cerebellar cortical layers between early MS patients and healthy controls.
In MS patients, we showed an increase in T1 RT in all cortical layers in the vermis as well as in the middle and external cortical layer of the cerebellar hemispheres compared to healthy subjects. Interestingly, those abnormalities occurred outside areas of focal damage as identified with 7 T MP2RAGE and independently from the presence of cerebellar cortical atrophy. The observed alterations in the most external layers may be due to demyelinating processes developing from the subpial region of the cerebellar cortex (i.e. molecular layer), as previously reported in postmortem 1 and experimental studies.25,26 In alternative or in addition, it cannot be ruled out that the observed gradient of damage may be a consequence of more effective remyelinating activity in the inner cortical layers, such as observed in the forebrain cortex. 27 However, the presence of partial volume effects might also contribute to the observed gradient. Therefore, we have tried to limit such effects by thresholding out values that are in the range of the T1 RT in the cerebrospinal fluid.
As to T2* RT, we have not observed any significant differences between patients and controls: this may be due to the lower sensitivity of T2* RT (compared to T1 RT) to occurring mechanisms of damage or to an inadequate statistical power. Besides, the high sensitivity of the T2* contrast to changes other than demyelination or axonal loss (e.g. iron accumulation) could also overshadow the sensitivity to the former.
The reported microstructural alterations in our cohort of RRMS patients correlated to clinical score (EDSS). Moreover, our exploratory analysis showed a relationship between the measured T1 RT in the outer and middle cerebellar layers of both vermis and hemispheres and auditory information processing speed and flexibility (measured by the PASAT) but also attention, visual scanning, and motor speed performances (measured by the SDMT). The modest association between T1 changes and cognitive performance might well reflect the limited sample size, therefore larger studies are required to verify the robustness of the reported relationship.
The major limitation of this study is the limited sample size and the fact that we have investigated a cohort of RRMS patients at early stage but with minimal functional impairment. Another important limitation is the lack of any analysis of the rest of the brain. Future work will aim to expand the current findings in larger cohorts of early MS patients and in longitudinal settings.
In conclusion, our pilot study showed that quantitative T1 imaging at ultra-high-field MRI is sensitive to alterations in the normal-appearing cortex of the cerebellum in early-MS patients, which are compatible with diffuse subpial demyelination and widespread microstructural damage. Indeed, subpial demyelination can be extensive, subtle, and not well delimited, and as such easily missed during lesion segmentation. Those alterations appeared to be independent from focal disease activity, intended as leukocortical or pure intracortical lesions, and volume loss in the cerebellar cortex and were related to clinical score and cognitive performance in our cohort of mildly impaired early-stage RRMS patients.
Data availability
The data that support the findings of this study are available from the corresponding author on request.
Conflict of Interests
The author(s) declared the following potential conflicts of interest with respect to the research, authorship, and/or publication of this article: Riccardo Galbusera reports no disclosures in relationship to this work Katrin Parmar reports no disclosures in relationship to this work Yohan Boillat reports no disclosures in relationship to this work Mario Joao Fartaria works for Siemens Switzerland Alexandra-Ramona Todea reports no disclosures in relationship to this work Kieran O’Brien works for Siemens Australia Anna Smolinski reports no disclosures in relationship to this work Ludwig Kappos reports no disclosures in relationship to this work Wietske van der Zwaag reports no disclosures in relationship to this work Cristina Granziera reports no disclosures in relationship to this work.
Supplemental Material
sj-pdf-1-mso-10.1177_2055217320961409 - Supplemental material for Laminar analysis of the cerebellar cortex shows widespread damage in early MS patients: A pilot study at 7T MRI
Supplemental material, sj-pdf-1-mso-10.1177_2055217320961409 for Laminar analysis of the cerebellar cortex shows widespread damage in early MS patients: A pilot study at 7T MRI by Riccardo Galbusera, Katrin Parmar, Yohan Boillat, Mario Joao Fartaria, Alexandra-Ramona Todea, Kieran O’ Brien, Anna Smolinski, Ludwig Kappos, Wietske van der Zwaag and Cristina Granziera in Multiple Sclerosis Journal – Experimental, Translational and Clinical
Footnotes
Funding
The author(s) disclosed receipt of the following financial support for the research, authorship, and/or publication of this article: Study funded by the Swiss National Science Foundation (under grants PZ00P3 131914/1 and PP00P3_176984 to CG), Switzerland, the Swiss MS Society and the Societé Académique Vaudoise in Switzerland.
Supplemental Material
Supplemental material for this article is available online.
References
Supplementary Material
Please find the following supplemental material available below.
For Open Access articles published under a Creative Commons License, all supplemental material carries the same license as the article it is associated with.
For non-Open Access articles published, all supplemental material carries a non-exclusive license, and permission requests for re-use of supplemental material or any part of supplemental material shall be sent directly to the copyright owner as specified in the copyright notice associated with the article.