
Abstract
Introduction
The Multiple Sclerosis Prediction Score (MSPS, www.msprediction.com) estimates, for any month during the course of relapsing–remitting multiple sclerosis (MS), the individual risk of transition to secondary progression (SP) during the following year.
Objective
Internal verification of the MSPS algorithm in a derivation cohort, the Gothenburg Incidence Cohort (GIC, n = 144) and external verification in the Uppsala MS cohort (UMS, n = 145).
Methods
Starting from their second relapse, patients were included and followed for 25 years. A matrix of MSPS values was created. From this matrix, a goodness-of-fit test and suitable diagnostic plots were derived to compare MSPS-calculated and observed outcomes (i.e. transition to SP).
Results
The median time to SP was slightly longer in the UMS than in the GIC, 15 vs. 11.5 years (p = 0.19). The MSPS was calibrated with multiplicative factors: 0.599 for the UMS and 0.829 for the GIC; the calibrated MSPS provided a good fit between expected and observed outcomes (chi-square p = 0.61 for the UMS), which indicated the model was not rejected.
Conclusion
The results suggest that the MSPS has clinically relevant generalizability in new cohorts, provided that the MSPS was calibrated to the actual overall SP incidence in the cohort.
Introduction
The outcome spectrum in multiple sclerosis (MS) is diverse; it spans from clinically monosymptomatic MS to MS-related death. 1 By consensus, it is accepted that a conversion from the relapsing–remitting MS (RRMS) phase to the secondary progression (SP) phase marks the onset of continuous disability accrual.2,3 Several survival and proportional hazards models have provided medium- to long-range predictions of outcomes (e.g. SP transition or disability milestones), based on clinical markers that appear in the early phases of MS.4–10 Some studies found that the initial relapse phenotype could predict the long-term outcome,9,11 however, that effect was not confirmed in other reports. 10 The relationship between relapses and disability remains controversial. Recent studies compared the accrual of disability in periods with or without relapses and found that relapses were associated with an increase in periods of disability worsening.12–14 However, this association was not confirmed when relapses were related to 1-year periods of sustained worsening or with successive periods defined with the Expanded Disability Status Scale (EDSS).15,16 Here, we examined the association between relapses, age and SP onset.
The Multiple Sclerosis Prediction Score (MSPS) 17 is based on the same principle that was used for the Fracture Risk Assessment Tool (FRAX) online prediction of osteoporosis. 18 The MSPS estimates, at 10 points per year, the immediate risk of conversion to an SP course. It is based on commonly available clinical data, including the severity of the most recent relapse. The MSPS model was derived from a longitudinal follow-up of the Gothenburg Incidence Cohort (GIC). 19 In the present study, we aimed to validate this model with an essentially untreated Swedish cohort, the Uppsala MS cohort (UMS).
Methods
The UMS included patients in the Uppsala region that were registered in the Swedish National MS Registry (www.neuroreg.se).20,21 Uppsala joined the registry in 2001, and patient data for our study period were entered retrospectively, during 2001–2002. These data were retrieved from the medical records stored at the Uppsala University Neurology Department, including records from other hospitals on patients that migrated to the Uppsala region after disease onset. The Uppsala department had the highest frequency of registered hospital visits with MS attack information of any centre in Sweden. In the present study, all patients with RRMS in the GIC and UMS were included that fulfilled the Poser criteria. 22 Patients were excluded when SP occurred before the second distinct attack. For the present study, patient data were included in a database (matrix) starting from the second attack (the diagnostic event) and ending at detection of SP, censoring due to death or the last examination before study termination. From the UMS we included patients with onset of MS from January 1, 1975 and termination of follow-up December 31, 2000. We previously derived the MSPS, based on data from the GIC with 50 years of longitudinal follow-up data. However, in the present validation study, the UMS-data were aligned only with the first 25 years of each GIC patient.
During this follow-up, no disease-modifying therapy (DMT) was used in the GIC, but in the UMS, a few patients received ‘first generation DMT’ (IFN-beta or glatiramer acetate) 1996–1999 (covering 99/1762 patient-years). Definitions of SP and MS attacks were described previously
17
(see text box). Definitions of variables: Secondary progression was defined, according to established criteria,
23
as continuous progression for at least 1 year, without remission, and detectable at time intervals of months or years. SP was determined retrospectively, after 1 year of observation, and the probable year of onset was recorded retrospectively. A relapse was defined as new MS-related symptoms that appeared within a time frame of weeks.
24
The severity grade (number of unfavourable characteristics 0, 1, or 2) was defined according to two dichotomous attack characteristics: afferent symptoms (yes/no) and complete remission from the relevant attack (yes/no). The term, afferent refers to lesions in afferent nerve tracts in the skin, muscles, eyes, or labyrinths. Afferent relapses included optic, sensory and vestibular symptoms with a documented absence of efferent symptoms, such as central paresis. Minor associated efferent symptoms were included, such as the Babinski sign or increased tendon reflexes. For instance, parahypesthesia with hyper-reflexia was recorded as afferent. Complete remission was defined as the absence of any constant residual symptoms in the appropriate functional system, evaluated 1 year after the acute phase of a relapse. A residual Babinski sign was not considered sufficient to indicate incomplete remission. Clinical characteristics tested as independent variables in the original derivation of MSPS
17
included age at onset attack, current age (continuous variable), gender, time from the second attack, number of previous attacks, the severity grade of the onset attack, the severity grade of the most recent attack before the current MSPS score, and time since the most recent attack. Clinical characteristics that remained significant in the regression analysis, which constituted the MSPS were current age, time from last attack, and the severity grade of the most recent attack before the current MSPS score was determined.
Outcome data
Complete relapse information was available in 84% in the GIC and >99% in the UMS. The proportion of attacks in each severity grade were similar in the UMS (grade 0: 21%, grade 1: 47%, grade 2: 32%) and GIC (grade 0: 18%, grade 1: 43%, grade 2: 38%).
The MSPS was calculated yearly for each patient, based on current age, time since last relapse, and severity grade of the last relapse 17 (Figure 1). The first MSPS was recorded 1st January after the second attack, and the last 24 years later. Patients were excluded when they entered SP or were censored during the same calendar year as the second attack, or when they were censored during the following year. Based on these criteria, the validation included 145 patients in the UMS and 144 in the GIC. The timescale for SP was 1 year.
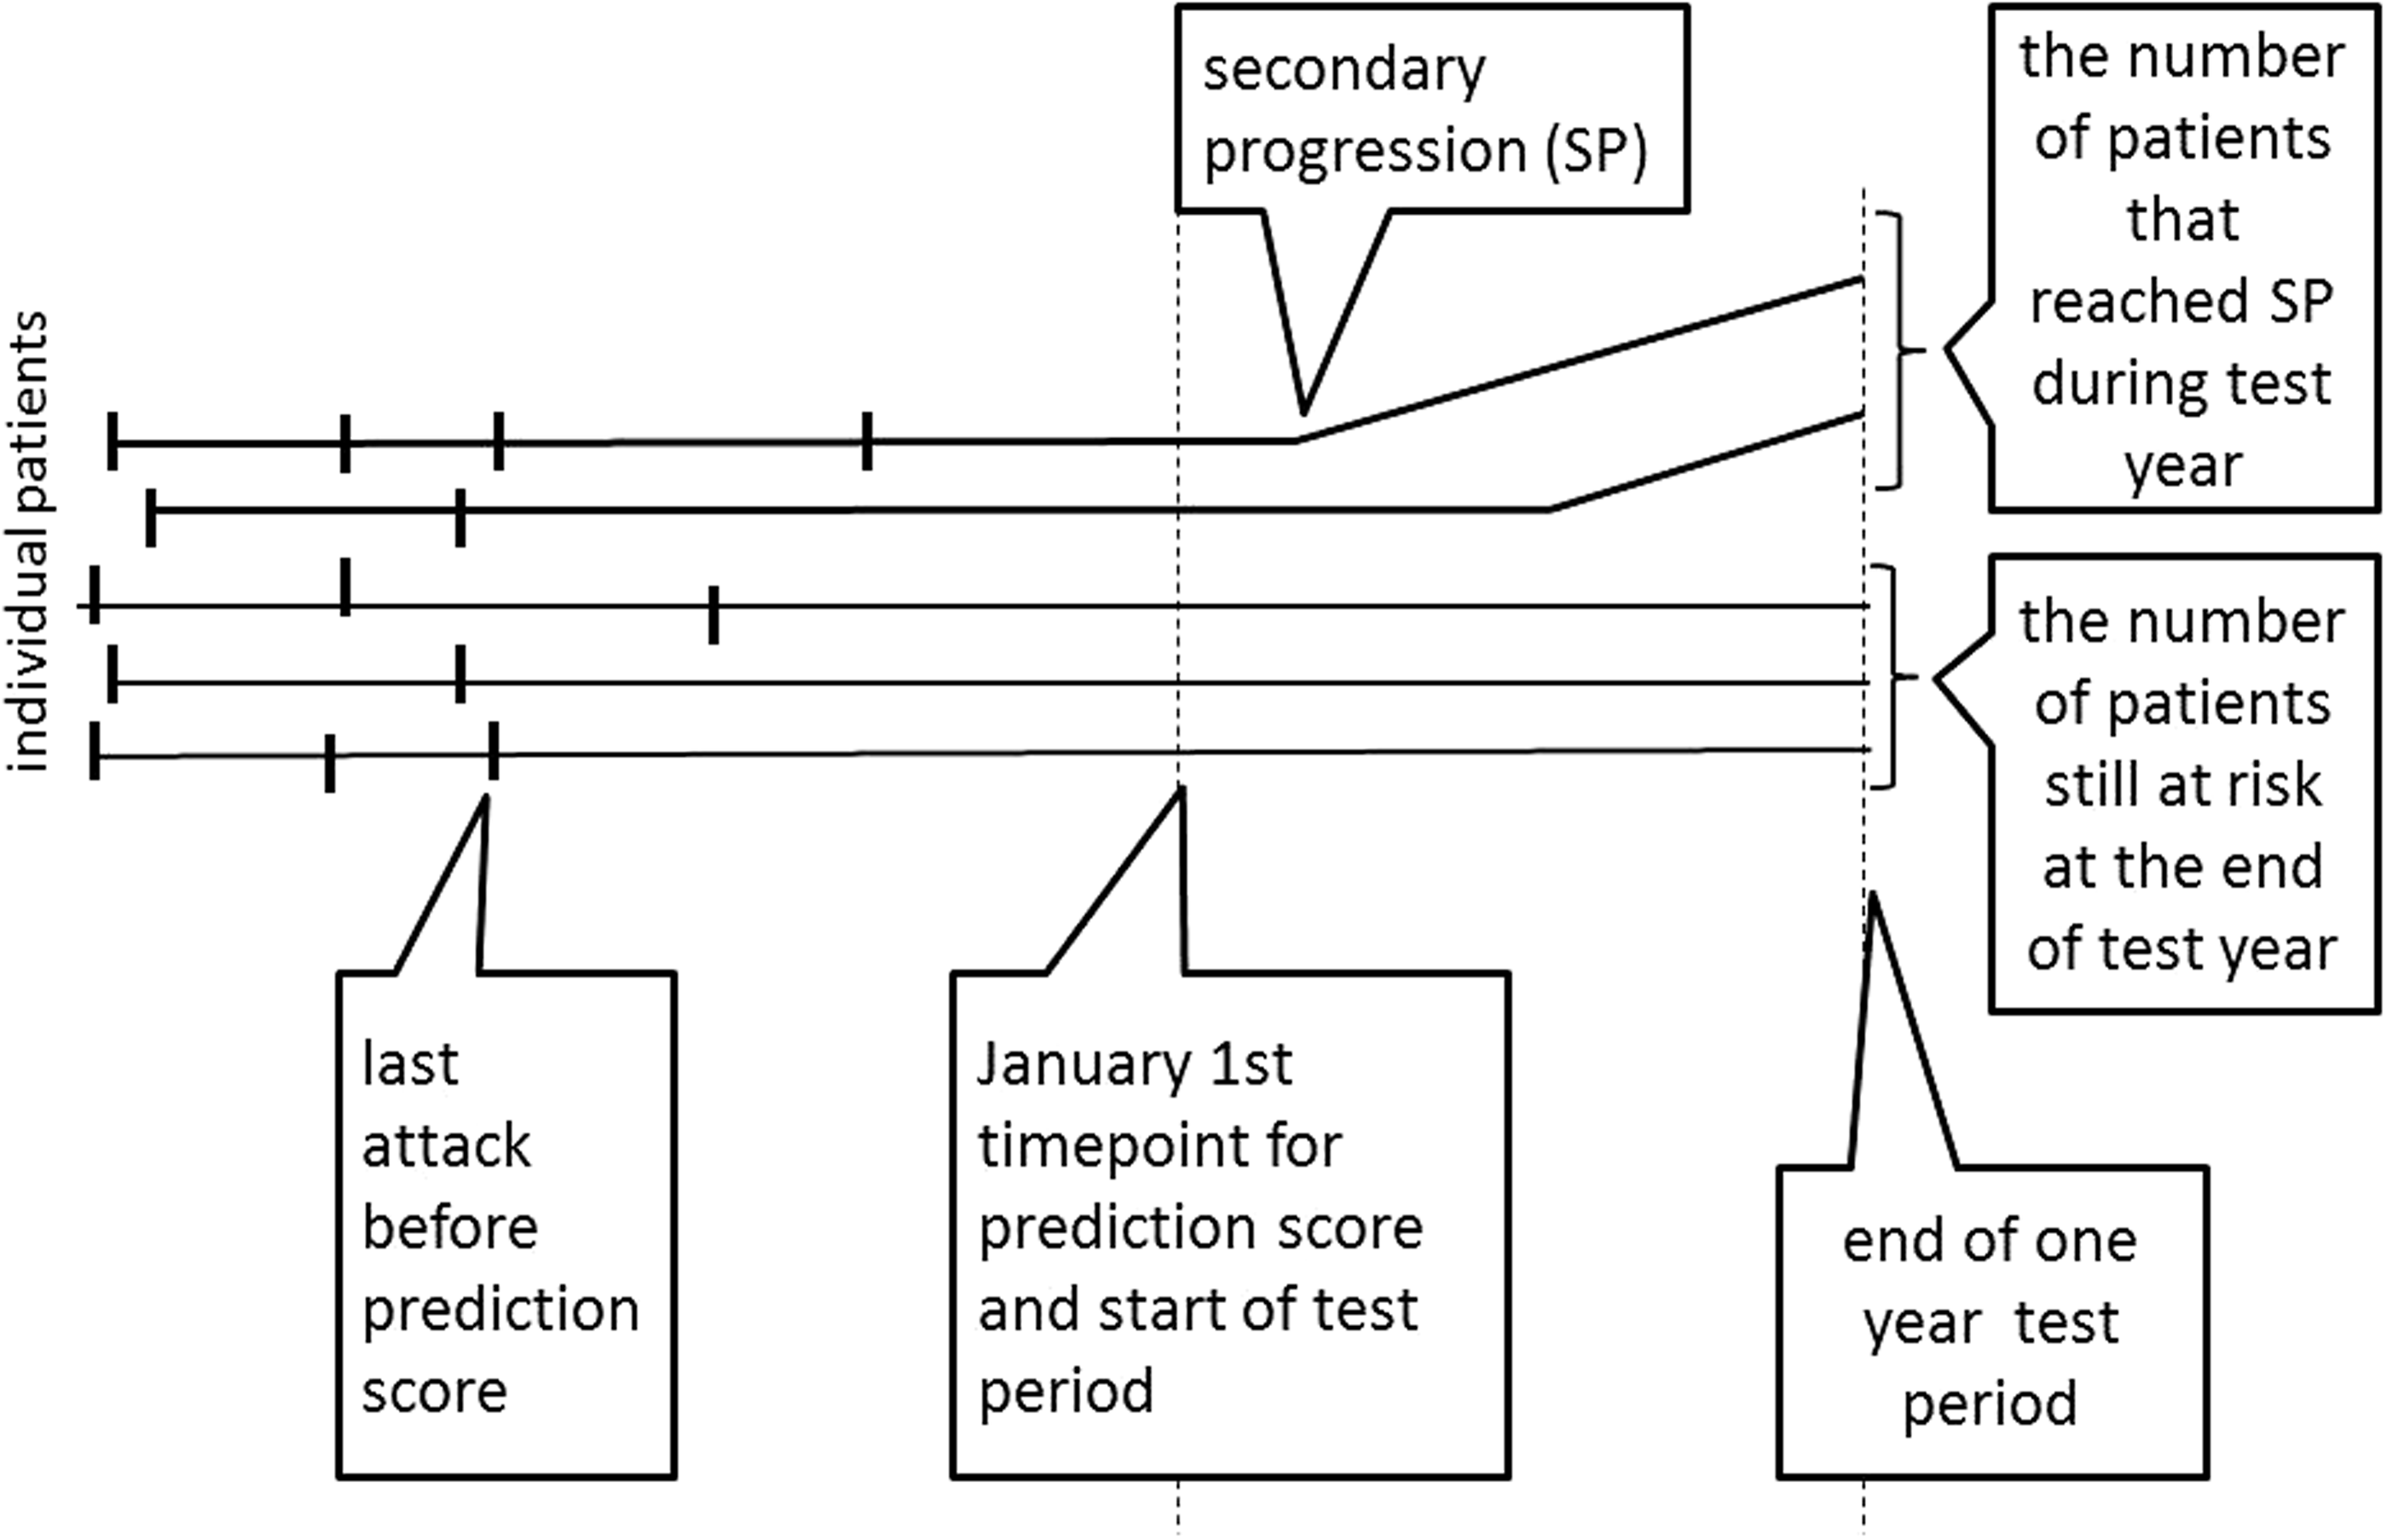
Diagram of the timeline for the prediction score validation. Dashed vertical lines indicate the selected time point for performing the prediction score and the end of the 1-year test period.
Statistical methods and primary statistical analysis
The derivation (GIC) and validation (UMS) cohorts were described in terms of the median time to SP, evaluated by Kaplan–Meier estimates (SPSS version 22). Established predictors for time to SP were tested by log-rank test. 19
To evaluate the MSPS, we constructed a matrix with yearly MSPS values (GIC = 1902, UMS n = 1101) and observed outcomes (SP or not) during the following year (1-year test period). Next, periods with predetermined MSPS strata (<0.025, 0.025–0.05, etc.) were summed. In each stratum the expected number of SP transitions was aligned with the number of annual observed SP transitions. The dispersions between expected and observed SP-transitions in each stratum of the UMS were calculated with chi-square analysis.
This study was approved by the Gothenburg Research Ethics Committee DNR 2016-08-15
Results
Comparison of the cohorts
The Kaplan–Meier estimates (Figure 2) indicated that the UMS tended to experience a lower frequency of SP transitions than the GIC; the median time to SP from the second attack was longer in the UMS than in the GIC (15.0 vs. 11.5 years, p = 0.19), and the median age at SP tended to be higher in the UMS than in the GIC (50.9 vs. 46.0 years, p = 0.066) (Table 1). Four factors that previously predicted the onset and 5-year limit in the GIC (sex, polyfocality, efferent/afferent symptoms, and complete remission 8 ) could not predict the time from the second attack to SP in the UMS.

Kaplan–Meier estimates of cumulative progression-free survival, based on different disease characteristics, in the Gothenburg (blue) and Uppsala (green) multiple sclerosis (MS) cohorts. Left: Survival according to the number of years between the second distinct (diagnostic) RRMS attack and the transition to secondary progression (SP) or censoring. Right: Survival according to the age at the transition to SP or censoring. Cum Survival = cumulative progression-free survival
Characteristics of two cohorts of patients with multiple sclerosis.
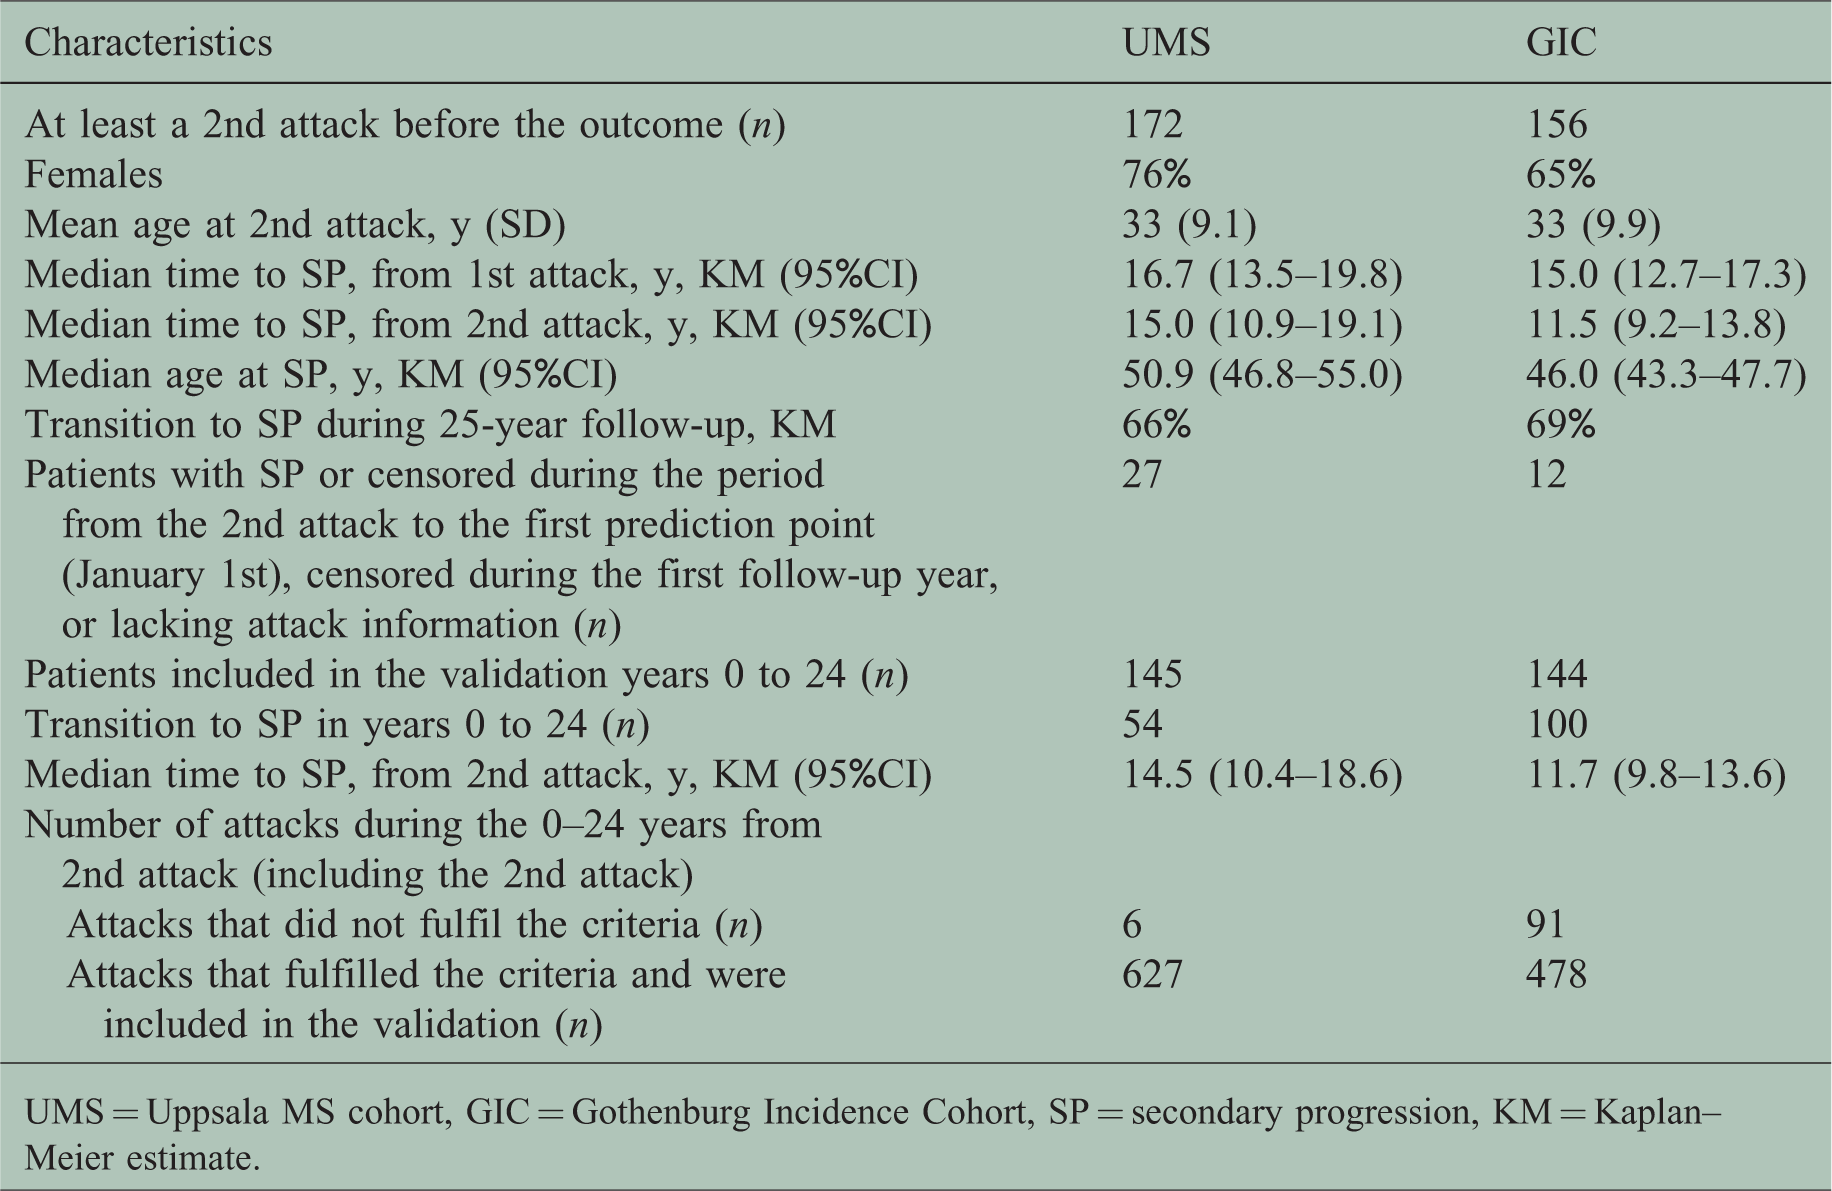
UMS = Uppsala MS cohort, GIC = Gothenburg Incidence Cohort, SP = secondary progression, KM = Kaplan–Meier estimate.
Internal validation of the prediction score
As described in a previous study 17 the MSPS gave a prediction of the immediate risk of SP at time point t, for a particular patient, which was interpreted as the instantaneous risk intensity at time t. These risk intensities were expressed on a yearly scale; thus when the risk intensity was constant during the following year, the probability of SP during that year would be approximately equal to the risk intensity (slightly smaller, particularly with high risk intensity).
To investigate whether it remained valid to use the immediate updated intensity as a prediction of the probability of disease incidence during the coming year, we re-evaluated the first 25 years of data from the GIC.
17
For each patient-year combination i (of the matrix) we designated the expected probability (the MSPS)
Comparison of the observed and expected incidences of multiple sclerosis secondary progression (SP) that occurred in the Gothenburg Incidence Cohort over a 1-year period, according to different strata of the Multiple Sclerosis Prediction Score (MSPS).
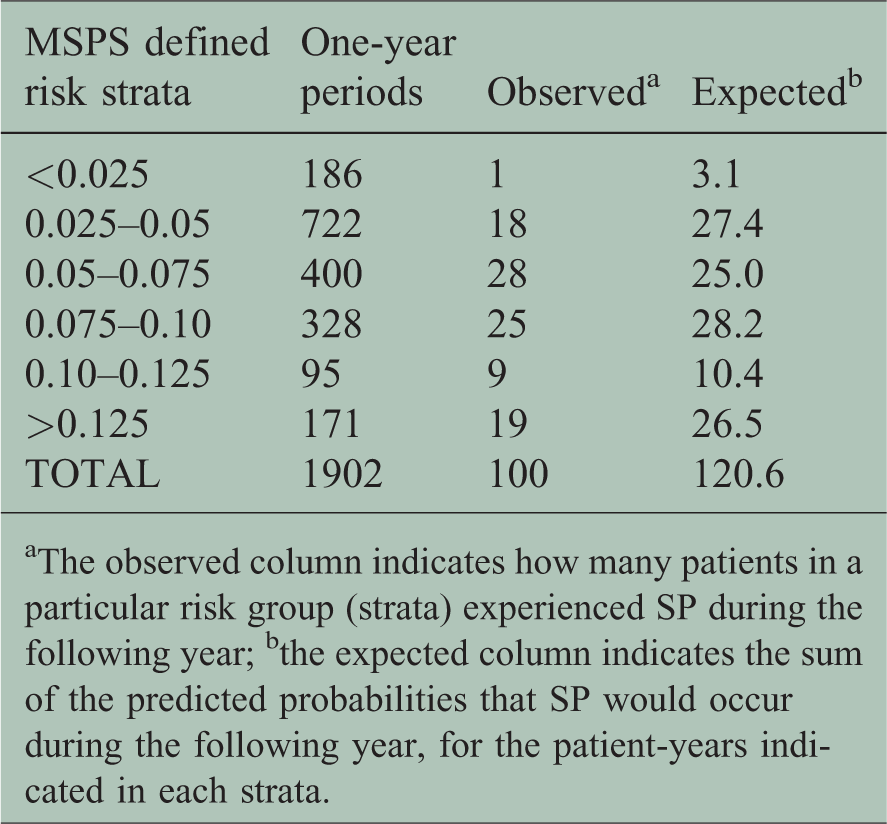
aThe observed column indicates how many patients in a particular risk group (strata) experienced SP during the following year; bthe expected column indicates the sum of the predicted probabilities that SP would occur during the following year, for the patient-years indicated in each strata.
The total number of observed SP events (n = 100) was substantially smaller than expected (n = 120.6), particularly in the two largest risk groups. The ratio, k, of the total observed SPs/expected SPs, was calculated as follows:

This ratio was used as a simple scale-calibration, and the results provided a better fit to the data. We illustrated this fit by sorting the calibrated pairs of expected and observed SPs

Agreement between the expected and observed secondary progression (SP) events for the Gothenburg cohort. Each dot of the red line shows the cumulative number of predicted SP events and the corresponding number of observed events, exported from one field in the matrix of single-year observations. The expected numbers of SP events were calculated with the Multiple Sclerosis Prediction Score (MSPS). Values were sorted according to the increasing number of predicted events (0.829 · e(ἱ), n(ἱ)) at the single patient-year level (red line). The blue stars (with the indicated original MSPS limits) show the successive accumulation of events, exported from the six strata shown in Table 2. For reference, we included an ideal diagonal line, in black, which indicates 100% agreement.
After the 25-year censoring time point, nine SP events occurred during 534 patient-years in the GIC, which were not included in the present study. Most of these patient-years represented low-risk strata, which could partially explain the overestimation of the MSPS observed in the first part of the plot in Figure 3.
Evaluations of Gothenburg predictions on Uppsala data
We performed an external statistical validation of the Gothenburg-based method, and the Gothenburg-calibrated Gothenburg-based method, with the independent Uppsala data set.
We first evaluated the observed and expected SP incidences that occurred in the UMS during the coming year (Table 3).
Comparison of the observed and expected incidences of multiple sclerosis secondary progression (SP) that occurred in the Uppsala cohort over a 1-year period, according to different strata of the Multiple Sclerosis Prediction Score (MSPS).
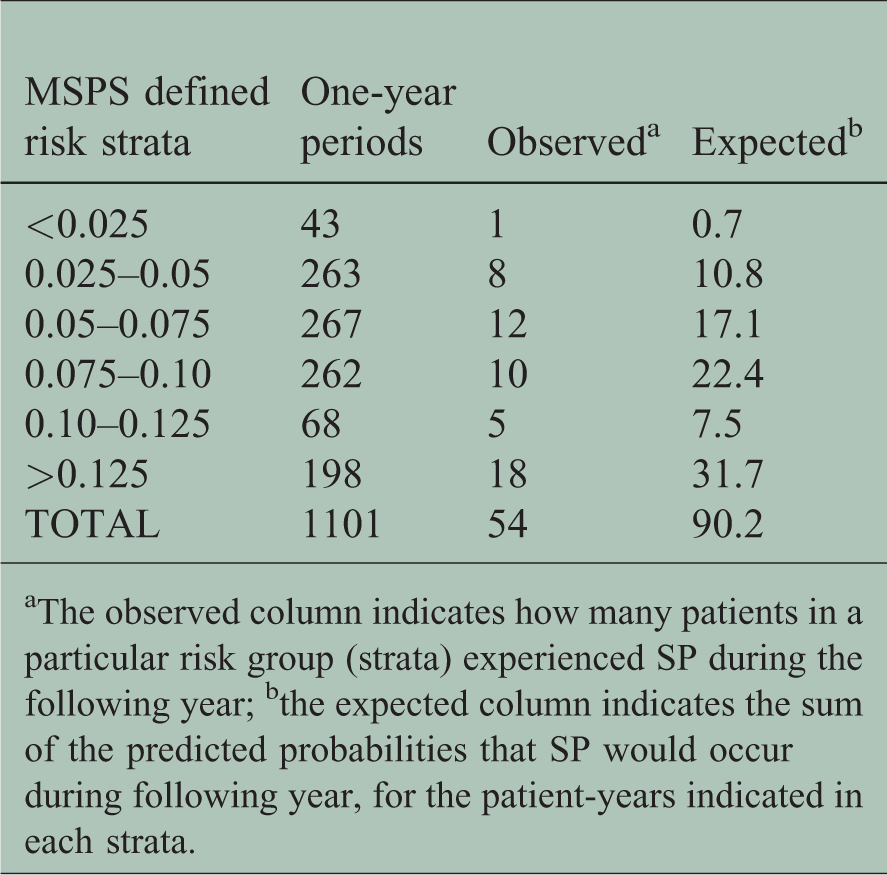
aThe observed column indicates how many patients in a particular risk group (strata) experienced SP during the following year; bthe expected column indicates the sum of the predicted probabilities that SP would occur during following year, for the patient-years indicated in each strata.
Next, we considered whether there was a simple way to test how well the observed and predictive (expected) values in Table 3 coincided. First, we assumed that all the 0–1-prediction experiments were fixed in both number and probabilities; thus all
The Uppsala data (from Table 3), after data reduction, grouped by the level of SP risk predicted with the Multiple Sclerosis Prediction Score (MSPS).

aThe observed column indicates how many patients in a particular risk group (strata) experienced SP during the following year; bthe expected column indicates the sum of the predicted probabilities of SP occurrence during the following year, for the patient-years indicated in each strata; cthe observed statistic T and the corresponding p-value were derived from a chi-square test. Here, we used 4 degrees of freedom.
The goodness-of-fit test statistic was calculated as follows:

Next we asked: Would the Gothenburg-calibrated method (multiplying the expected number by 0.829) work better? The chi-square(4) statistic value was 7.1 (p = 0.069) for the Gothenburg-calibrated Uppsala data (no table reported). Again, this result was much lower than predicted (i.e. 75 and 54, for predicted and observed cases, respectively).
Another risk-scaling-variable was the total number of cases divided by the expected number of cases (ratio = 0.599) in the Uppsala material (Table 5). Here the values in the idealised independent Poisson approximation model were conditional on the total number of cases. This can be interpreted as the outcome of a multinomial with probabilities proportional to the original expected number for any unconditional model, where the parameters are proportional to the original prediction probabilities with an arbitrary proportionality parameter. This proportionality parameter is estimated by the ratio 54/90 = 0.599.
The Uppsala data (from Table 3), after data reduction, grouped by the level of SP risk predicted with the Multiple Sclerosis Prediction Score (MSPS).
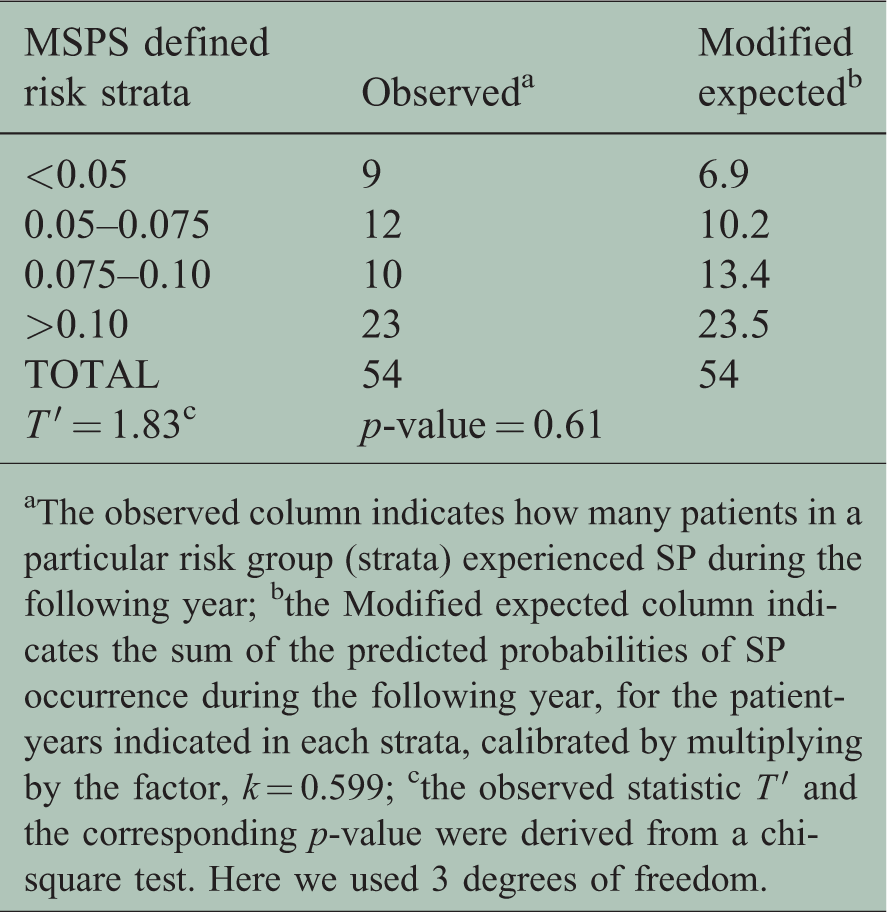
aThe observed column indicates how many patients in a particular risk group (strata) experienced SP during the following year; bthe Modified expected column indicates the sum of the predicted probabilities of SP occurrence during the following year, for the patient-years indicated in each strata, calibrated by multiplying by the factor, k = 0.599; cthe observed statistic T ′ and the corresponding p-value were derived from a chi-square test. Here we used 3 degrees of freedom.
For this idealised Poisson model with a scaling factor, the relevant conditional chi-square test, now with 3 degrees of freedom, was calculated as follows:
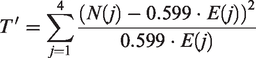
The resulting observed test statistic

Agreement between the expected and observed second progression (SP) events for the Uppsala data. Each dot of the red line shows the cumulative number of predicted SP events and the corresponding number of observed events, exported from one field in the matrix of single-year observations. Predictions of SP events were calculated with the Multiple Sclerosis Prediction Score (MSPS). Values were sorted according to the increasing number of predicted events (0.599 · e(ἱ), n(ἱ)) . The blue stars (with the indicated original MSPS limits) show the successive cumulation of events, exported from the four strata bins shown in Table 5. For reference we included a diagonal line, in black, which indicates 100% agreement.
Remarks about the idealised modelling
In reality both N(j) and E(j) are random and dependent between the strata. The convenient Poisson approximation used in the derivation of the MSPS has to be substituted by independent normal (0,1) approximations of the components 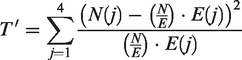
Discussion
We tested whether our MSPS algorithm, which was derived from the GIC, could be generalised, based on the Swedish UMS validation cohort. We found that the expected number of SP transitions estimated with the MSPS corresponded well to the observed number in the UMS, after we calibrated it, based on a general trend towards lower rates of SP conversions in the UMS.
The MSPS is a novel type of predictor. It is based on a floating starting-point, with a timescale of 1 month, applied as a sliding window throughout the RRMS course. 17 The starting point might, for example, be a patient’s visit or conceivably the start of a registry study with SP as the outcome. The average annual risk of a transition from RRMS to SP was previously estimated at approximately 4%. 17 The MSPS identified a wide range of individual risks for SP, from <2.5% to >12.5% annually. This model apparently uncovered a basic relationship between relapses and progression, or rather, between age, severity, and relapse frequency and the onset of SP.
The strength of the MSPS was that it reduced complex data sets to a few readily available clinical parameters. Individual courses may alternate between periods of low and high risk, as defined by the MSPS, which presumably corresponded to periods of increasing or decreasing inflammatory activity. A limitation of the MSPS was that the EDSS was not included, due to the lack of sufficient EDSS values for the derivation process.
The main strength of the present validation procedure was the identical criteria in the derivation and validation cohorts, including the common relapse severity grade. However, the related structures of the derivation and validation cohorts might also be considered a limitation, because the generalizability of the MSPS remains to be demonstrated with data collected and studied outside Sweden and with different methods.
A limitation was the unavoidable subjectivity of timing of the SP; however, this parameter might have been more informative than the EDSS records, particularly in studies with few EDSS records available. 14 A relationship between EDSS stage 4 and the onset of SP was described previously. 25
A remaining challenge is the 25-year difference of the onset of the two cohorts. There is a contemporary trend towards a milder course of MS probably due to improved awareness and new diagnostic tests, and which was described before the impact of the new disease-modifying MS drugs.26–29 This may explain why the calibration of the MSPS (0.59 times × calculated risk) provided a better fit with the data. This change is not trivial because it suggests a better prognosis for SP. The change might be related to inclusion of more benign cases. Today all MS patients get disease-modifying MS drugs (DMDs). There is no consensus on whether the effect of DMDs is exerted by diminishing the relapse rate and associated progression, or whether there is a lower propensity for entering SP, or that SP indeed becomes slower and less disabling.
Practical conclusion
In this study, the MSPS identified a basic relapse-progression relationship. It allowed us to identify segments of the individual MS course that were associated with an increased risk of transition to SP. The web-based version (www.msprediction.com) is currently based on the calibration factor derived from the UMS, which was essentially an untreated cohort. If current MS therapy acts primarily by suppressing intermittent inflammatory episodes with a proportional reduction in the risk of subsequent SP, the MSPS may be valid in treated cohorts without further calibration. However, if there is a selective propensity for transition to SP in cohorts under highly effective therapy, 30 further calibration may be required (estimated from total observed/MSPS data). The MSPS has potential that is much needed for controlling natural course confounders in registry studies and for dimensioning clinical trials. The use of the MSPS might considerably reduce the number of patients needed in a clinical trial. 17
Footnotes
Acknowledgements
We are grateful to Professor Anders Odén for the development of the methodology and the earlier work on implementation of this on the Gothenburg cohort. We thank Leszek Stawiarz for the excellent help from the Swedish MS Registry, including the initial survey showing that Uppsala had the highest frequency of recordings of relapses with severity indicators, and for the elegant solution of problems originating from the database of the registry.
Conflict of Interests
The author(s) declared the following potential conflicts of interest with respect to the research, authorship, and/or publication of this article: Oluf Andersen received a research grant from Sanofi.
Funding
The author(s) disclosed receipt of the following financial support for the research, authorship, and/or publication of this article: Gothenburg Multiple Sclerosis Society, Björnsson Foundation, Gothenburg.