
Abstract
Background
Few studies of cognitive rehabilitation in multiple sclerosis (MS) have targeted working memory specifically.
Objective
We examined the effects of n-back working memory training on cognitive performance and brain function in patients with MS.
Methods
Patients with MS (n = 12) and healthy controls (HC; n = 12) underwent 20 sessions of n-back working memory training. Before and after training (pre- and posttest) cognitive event-related potential (ERP) measures were obtained during a 3-back task. In addition, a battery of cognitive tests was administered.
Results
Following n-back training, both MS patients and HCs showed significant improvement on tests of working memory, processing speed, complex attention, and reasoning ability. MS and HCs also exhibited an enhancement of N2 ERP component amplitude, and earlier N2 and P3 latencies, following n-back training.
Conclusions
Targeted training of working memory with the n-back task may improve cognitive function in MS. Enhancement of N2 ERP component amplitude and shorter N2 and P3 latency following training in patients with MS is consistent with plasticity of neural processes that are involved in working memory.
Introduction
Cognitive rehabilitation is currently an important focus for therapeutic intervention in multiple sclerosis (MS), 1 but the findings from investigations of this therapeutic modality have been inconclusive. Meta-analyses of controlled trials suggest low-level evidence for improved cognitive outcomes in MS following cognitive rehabilitation.2,3 There is also evidence for improved performance on memory tests following memory-based cognitive interventions in randomized/quasi-randomized control trials. 4 Recent randomized clinical trials provide class I evidence for improved cognitive outcomes following cognitive rehabilitation,5,6 and another randomized clinical trial that used patient-specific cognitive rehabilitation found sustained improvements in subjective perception of cognitive impairment for up to 2 years. 7 However, there is currently no consensus regarding the optimal approach for cognitive rehabilitation programs, and the differential impact of various cognitive training approaches on cognitive outcomes and neuropathology is not well understood.
The efficacy of cognitive rehabilitation may depend upon both the cognitive profile of the patient and the specific cognitive domains that are targeted. Rehabilitation programs focused on attention, executive functions, memory, and a combination of domains have shown promise in MS. 8 Studies in healthy individuals have indicated that targeted training of working memory (WM), in particular, may produce improvements in WM capacity and fluid reasoning9–11 (though there have been null findings as well12,13). WM involves the short-term maintenance and manipulation of information, and it is assumed to be central to cognitive functioning. Generally, in healthy adults, improvements in short-term memory and WM are consistently observed across WM training studies, whereas improvements in fluid reasoning are less consistently found.14–16 In patients with MS, there is evidence that WM capacity mediates the relationship between cognitive reserve and cognitive outcomes, such as long-term memory decline. 17
Impaired information processing is commonly observed in patients with MS, 18 including on tests purported to measure WM, such as the n-back task (see Figure S1A and S1B for examples of an n-back paradigm (supplementary information)).19,20 The n-back task has been widely used in WM training studies with healthy individuals, as noted above.9–14 Although n-back tasks are assumed to primarily measure WM, they also place substantial demand on speed of information processing. 21 Processing speed is also a primary impairment in MS, 22 and processing speed is likely an important factor that accounts for observed impairments in WM in MS as well. 23 The interaction between processing speed and WM deficits in MS may be particularly strong when there is low demand on executive control during WM; when executive demands are high, WM and processing speed can be parsed and deficits specific to WM are more apparent.20–22 WM and processing speed interact with many cognitive abilities, and may therefore be important targets for cognitive rehabilitation interventions in MS. The n-back task provides a potential cognitive intervention method that can target the domains of processing speed and WM in MS.
There is preliminary evidence that WM training may improve aspects of processing speed, WM, fatigue, and reasoning performance in MS.24,25 The few studies that have examined changes in brain function in MS following WM training (using functional magnetic resonance imaging, fMRI) suggest that training may affect functionality of the frontal-parietal network in some individuals with MS.26,27 Although this work was preliminary and used a case-based approach, the results are nonetheless consistent with the emerging view that WM training is associated with changes in the frontal-parietal network. 28 In addition to fMRI measures, event-related potentials (ERPs) can also provide indices of the neural response to cognitive training. ERPs provide information about dynamic cognitive processes that occur in real time (within a millisecond time-scale), and distinct components of the ERP waveform can provide information about specific cognitive processes. 29 For example, the N2 component (negativity at 200–300 msec post-stimulus) indexes conflict monitoring and sequential mismatch identification processes.30,31 The P3 component (positivity at 300–600 msec) indexes stimulus categorization and evaluation. 32 In patients with MS compared with healthy controls (HCs), there is attenuation of the P3 component during tasks of WM33,34 and prolonged N2 latency has also been observed.35,36
Previous analyses conducted by our laboratory had found that n-back training was associated with improved cognitive performance, as well as enhancement of the N2 ERP component in healthy individuals. 37 These N2 effects and improvements on certain tests of WM were found only for participants that underwent WM training, and were not observed for a group of participants that trained on a different cognitive task that did not tax WM. The purpose of the present study was to examine whether young adult patients with MS would show enhancement of the N2 and/or P3 ERP components, and exhibit improvement in cognitive performance, following WM training, as seen in healthy adults. We examined performance outcomes across a range of cognitive modalities, including tests of WM, processing speed, selective attention, cognitive control, and fluid reasoning. These tests were selected, in part, because similar tests have been examined in previous WM training studies in normal individuals,9–16 and we were interested in determining if previous results could be replicated and extended in an MS population. We also examined outcomes following WM training on subjective measures of fatigue, depression, and quality of life.
Methods
Participants
See Figure 1 for an overview of the participants and study measures. For the present analyses, we selected a subset of HC n-back training participants from our larger study 37 for comparison with the MS n-back training group. We selected individuals for the HC group so that there would be comparable sample size and demographics between patients and HCs (final sample, MS n = 12, HC n = 12). Study participants had limited or no history of commercial cognitive training.

Study design and outcome measures. The study had a pretest–training–posttest design. At pretest (left panel), all participants first completed a brief set of questionnaires. This was followed by the administration of four computerized cognitive tests in the EEG environment. Finally, participants completed a battery of psychometric tests outside of the EEG environment. At the end of the pretest session, participants were given instructions about how to access the training program and practiced using it briefly, to ensure familiarity with the task and protocol. Participants then trained for approximately 20 sessions, on their home computers. Posttest measures were almost identical to what was administered at pretest. However, at posttest the NAART was not administered again, and there were some additional survey questions about subjective improvements. Alternate forms for neuropsychological/psychometric tests were used at pre- and posttest, and these were counterbalanced across participants. The final sample included in the present study’s analyses was MS n = 12 and HC n = 12 (see bottom two panels of the figure).
All patients had been diagnosed with MS as per standard diagnostic criteria (2010 McDonald Criteria). 38 Eleven patients had relapsing–remitting MS, and one patient had primary progressive MS. No major relapses were reported within approximately 2 months of beginning the study, or during the study itself. Expanded Disability Status Scale 39 (EDSS) scores were obtained for patients from their clinic evaluation that was closest in time to the study pretest (EDSS Median = 2, range 1–5). Patients did not have any major limitations with respect to hand coordination or vision. The majority of patients and HCs were Caucasian (MS: Caucasian n = 12; HC: Caucasian n = 10, and n = 1 for African-American, and Asian). See Table 1 for MS patient and HC demographics.
Participant characteristics

Notes: SD: Standard Deviation; BDI-II: Beck Depression Inventory II; FSS: Fatigue Severity Scale; For Age, Years of education, Estimated full-scale IQ, BDI-II, and FSS, p-values were obtained from independent samples t-tests; For Handedness, Gender, and Race, p-values represent asymptotic significance (2-sided) from Pearson Chi-Square.
*Levene’s test for equality of variances was significant, p-value is corrected.
**MS group n = 11 for estimated full-scale IQ; one MS participant did not have a valid NAART score
***HC group: n = 1 African-American, n = 1 Asian, n = 10 Caucasian.
Procedure
The outcome measures are noted in Figure 1, in the order that they were administered. Alternate forms were administered at pre- and posttest and counterbalanced across participants. Brief practice items were administered before all tests. The posttest session was scheduled within 1 week after the last training session. Participants were paid $120 for completing the study. All participants provided informed consent prior to undergoing testing. The study was approved by the University at Buffalo Health Sciences Institutional Review Board.
N-back training protocol
Participants completed approximately 20 sessions of n-back training, for 5 days a week, for 25–30 minutes a day, on a home computer using a web browser. Task stimuli included 10 letters of the alphabet presented semi-randomly at the center of the computer screen, one at a time. Ten blocks of letter stimuli were presented at each training session, with 45 + n trials per block (stimulus duration = 400 msec, inter-stimulus interval (ISI) = 2000 msec). For each trial, participants had to identify whether the letter stimulus was the same or different as a letter presented n trials back (“Match” trial; 33.3% of all trials; vs. “Non-Match” trial; 66.6% of all trials). A response was required on all trials. For some of the trials, “lure” stimuli were presented (22.2% of all trials were non-matches with lures). A lure trial occurred when a previously presented letter matched the current letter but was not in the critical n-back position, which places additional demands on interference control during WM (see supplementary Figure S1A). 40 The level of n of the subsequent block was adaptively altered based on the participant’s performance on the previous block, as described elsewhere.9,37 If a participant’s accuracy was high on a given block (> 88.8% accuracy overall, and > 86.5% correct matches), then the subsequent block would be a more difficult n-back level (e.g. from a 2-back to a 3-back level). If accuracy was relatively low on a given block (< 77.7% total correct, or < 53% correct matches), then the subsequent block would be an easier level (e.g. from 2-back to 1-back). If performance did not meet these criteria, then the subsequent block would be the same as the previous one (e.g. from a 2-back to a 2-back). Thus, as participants improved, the difficulty was adjusted so that they would continue to be challenged.
For each session of the task, the n-back levels that were completed across the 10 blocks were averaged to obtain an index of performance for each session. This index was used to measure improvement on the training task, a method that has been used previously.9,10 Session data were stored on a server and checked regularly by the experimenter to monitor compliance. Participants also reported session performance scores directly to the experimenter via email in cases where the data were not recorded online. Missing data points (only 3.125% of data in the 24 participants in this study sample) were replaced with the group mean for that training session. To provide additional assurance regarding compliance, at posttest all participants completed survey questions that would be difficult to answer accurately if they had not completed the training themselves. See Figure 1 for additional details regarding participants completing training. One of the HC participants completed 22 sessions total. In the MS group, two patients completed 21 total sessions; one patient completed only 18 sessions; and two patients completed 19 training sessions. All other study participants completed 20 training sessions.
Behavioral outcome measures
Computerized cognitive measures
For four computerized tests, participants were seated in a comfortable chair approximately 70 cm away from a computer monitor and held a four-button response pad. The parameters of these tests are described in detail in the supplementary material (Figure S1) and elsewhere. 37 Participants completed a Letter 3-back task that served to measure improvement on the training task (see Figure S1A). During this task, letters were presented on the computer screen one at a time. Participants had to determine whether a letter stimulus matched or did not match a letter presented three trials back. If the stimulus presented on the screen matched the letter presented three trials ago, then participants had to press the inner buttons of a response pad with their index fingers; if the presented stimulus did not match the letter presented three trials back, then participants had to press the outer buttons on the response pad with their index fingers. Three trial types were assessed in the present study: Matches (75 trials), Non-Matches (150 trials), and Lures (50 trials) (see supplementary Figure S1A). A Spatial 3-back task was used to assess transfer of gains to spatial WM (see Figure S1B). During the Spatial 3-back task, participants had to determine whether the location of a square was in the same or different position than a square that was presented three trials before. The participant response scheme for this task was the same as for the Letter 3-back. The number of trials and relative stimulus type frequencies (Match, Non-Match, Lures) were identical to the Letter 3-back task.
A Go/Nogo Flanker task was used to assess transfer of training gains to a task of complex attention and inhibitory control (see Figure S1C). For this task, participants had to respond according to the direction of a central target arrow and ignore distracting information from flanker arrow stimuli. When the central target arrow faced up or down, participants had to press the outer and inner buttons of the response pad, respectively (Go trials: Congruent, Incongruent, or Neutral flankers). When the central target was a two-sided arrow, participants had to withhold their response (Nogo trials: directional flanker prime arrows, Neutral flanker primes).
A Visual Search task was used to assess transfer of gains to a task of selective attention and processing speed (see Figure S1D). For this task, participants had to determine the orientation of a target letter “F” embedded in an array of distractor letter stimuli (6 × 6 letter array). If the “F” was right-side-up (normally oriented), then participants were instructed to press the outer buttons of the response pad (“Up F trials”); if the “F” was upside-down, they had to press the inner buttons (“Down F trials”). Three trial types were assessed here: Up F Regular (moderate interference distractors); Up F Interference (high interference distractors); Down F trials (moderate distractors). For the computerized tasks, accuracy (% correct) and reaction time (RT) measures were obtained for each trial type.
Neuropsychological/psychometric measures
Estimates of IQ were obtained with the North American Adult Reading Test (NAART). 41 Total correct responses on the Symbol Digit Modalities Test (SDMT) 42 was examined as a measure of complex processing speed. a Shortened, alternate versions were created for each of four fluid reasoning tests in order to reduce testing time and practice effects. Item difficulty was controlled for between versions. Total correct was the dependent measure for all tests. From the four tests (see Figure 1) a composite fluid reasoning variable was computed as the average percent score, computed separately for pretest and posttest. Fluid reasoning tests were examined specifically because they have been commonly used to measure far transfer in previous n-back WM training studies, in normal individuals.9–15 In particular, a number of studies have sought to replicate the finding that n-back training results in improved performance on the Raven’s Advanced Progressive Matrices (RAPM),14,15,43 and studies will often use a shortened form of the RAPM similar to what was done in the present study.9–11,13 Shortened forms allow for the inclusion of additional tests over the course of the testing session while minimizing testing fatigue, in turn allowing more robust measurement of the cognitive construct. With this approach we were able to obtain four tests of fluid reasoning instead of one, and derive a composite measure. While there is a precedent for this approach with the RAPM, and other studies have also used the same strategy with other fluid reasoning measures, 13 the reliability and validity of the shortened, alternate forms we used for the other tests has not been assessed (WJ-R tests, 44 Letter Series). Still, as noted, item difficulty was controlled for between forms, and the alternate forms were counterbalanced across participants. The quality of life questionnaire was based on the 36-item Short-Form Survey (SF-36), 45 and included calculated transformed scores for each subscale. Fatigue was assessed with the Fatigue Severity Scale (FSS); and depression symptoms were assessed with the Beck Depression Inventory II (BDI-II; See Figure 1).
Electrophysiology
Electroencephalographic (EEG) recordings were obtained at pre- and posttest with a 256-channel dense electrode array HydroCel Geodesic Sensor Net (Electrical Geodesics, Inc., Eugene OR). EEG data were obtained for all computerized tests (Letter 3-back, Spatial 3-back, Go/Nogo Flanker, Visual Search); only ERP data for the Letter 3-back are reported here. The EEG acquisition, off-line processing, artifact rejection, and signal averaging procedures that were used in the present study have been described in detail elsewhere.36,37 ERP waveforms were obtained for Match, Non-Match, and Lure trial categories. Epoch window parameters were: 1050 msec long, 150 msec baseline, 900 msec post-stimulus. Frontal (Fz), central (Cz), and parietal (Pz) electrode clusters were analyzed in the present study for the P3 component, and Fz and Cz clusters were analyzed for the N2 component, as described previously.36,37 The N2 and P3 peak amplitude and latency values were extracted for analysis based on the grand averages. Visualization of the ERPs via the grand averages and the selection of component peaks was limited to the 150 msec pre-stimulus and 750 msec post-stimulus (900 msec total) of the ERP waveform.
Statistical analyses
Baseline group differences for demographic, quality of life, and psychometric measures (SDMT, RAPM, Analysis-Synthesis, Concept Formation, Letter Series, and Fluid Reasoning Composite) were examined with independent samples t-tests. Chi-square analyses were conducted for handedness, sex, and race. Baseline performance on computerized tests (Letter 3-back, Spatial 3-back, Go/Nogo Flanker, and Search task) was assessed with Group (MS, HC) × Trial Type repeated measures ANOVAs. Improvement on the training task protocol was examined with a Training Session (20 sessions) × Group ANOVA. Pre-to-post outcomes on FSS, BDI-II, quality of life, and psychometric measures were assessed with repeated measures ANOVAs, using a Session (pretest, posttest) × Group design. For the computerized tests that had multiple trial types (e.g. Match, Non-Match, Lure), Session × Group × Trial Type repeated measures ANOVAs were conducted. So, for example, the ANOVA that was conducted for the Letter 3-back task was as follows: Session (pretest, posttest) × Group (HC, MS) × Trial Type (Match, Non-Match, Lures). Session × Group × Trial Type × Cluster repeated measures ANOVAs were conducted for ERP measures. For the repeated measures ANOVAs, Greenhouse–Geisser corrections were used when sphericity was violated (noted as “gg” in the text and tables). Based on our primary interest in examining the effects of training across the two groups, the results place particular focus on reporting and interpreting effects that included the Session and/or Group factors. Corrected p-values are reported (noted as “corrected”) for independent samples t-tests when Levene’s Test showed that homogeneity of variance was violated (t statistic calculated with un-pooled variances and a correction to the degrees of freedom). Partial-eta squared (ηp2) values served as estimates of effect size for ANOVAs. Alpha level was set at p ≤ .05 for all analyses.
Results
Demographics and baseline cognitive performance
Group demographic variables, FSS scores, and BDI-II scores are reported in Table 1. At baseline the patients with MS, compared with HCs, were older on average (p = .014, corrected), had higher FSS scores (p = .042), and scored lower on the quality of life role-physical index (MS Mean = 68.75, SD = 37.12; HC Mean = 100.00, SD = 0.00 (p = .014, corrected)). MS and HC groups did not differ significantly on education, IQ, BDI-II total score, handedness, sex, or race demographic variables.
Baseline performance on cognitive tests (group means and standard deviations) can be found in the “pretest” columns of Table 2 (separate columns for MS and HC groups). SDMT performance was not significantly different between groups (see pretest group means and SD in Table 2 for the SDMT). An independent samples t-test revealed that the patients with MS had lower accuracy on the Concept Formation test compared with the HC group (p = .019). Group × Trial Type ANOVAs for the computerized tests yielded significant Group effects for Letter 3-back accuracy (p = .025), Search Array task accuracy (p = .014), and RT on Go trials (p = .019). The Group effects indicate that the MS patients, compared with HCs, had significantly lower accuracy on the Letter 3-back and Search Array tasks, and significantly longer RT on the Go/Nogo Flanker task (see pretest data in Table 2). There were significant Trial Type effects for all of the computerized tests, but Trial Type did not interact with Group for any measure.
Cognitive performance
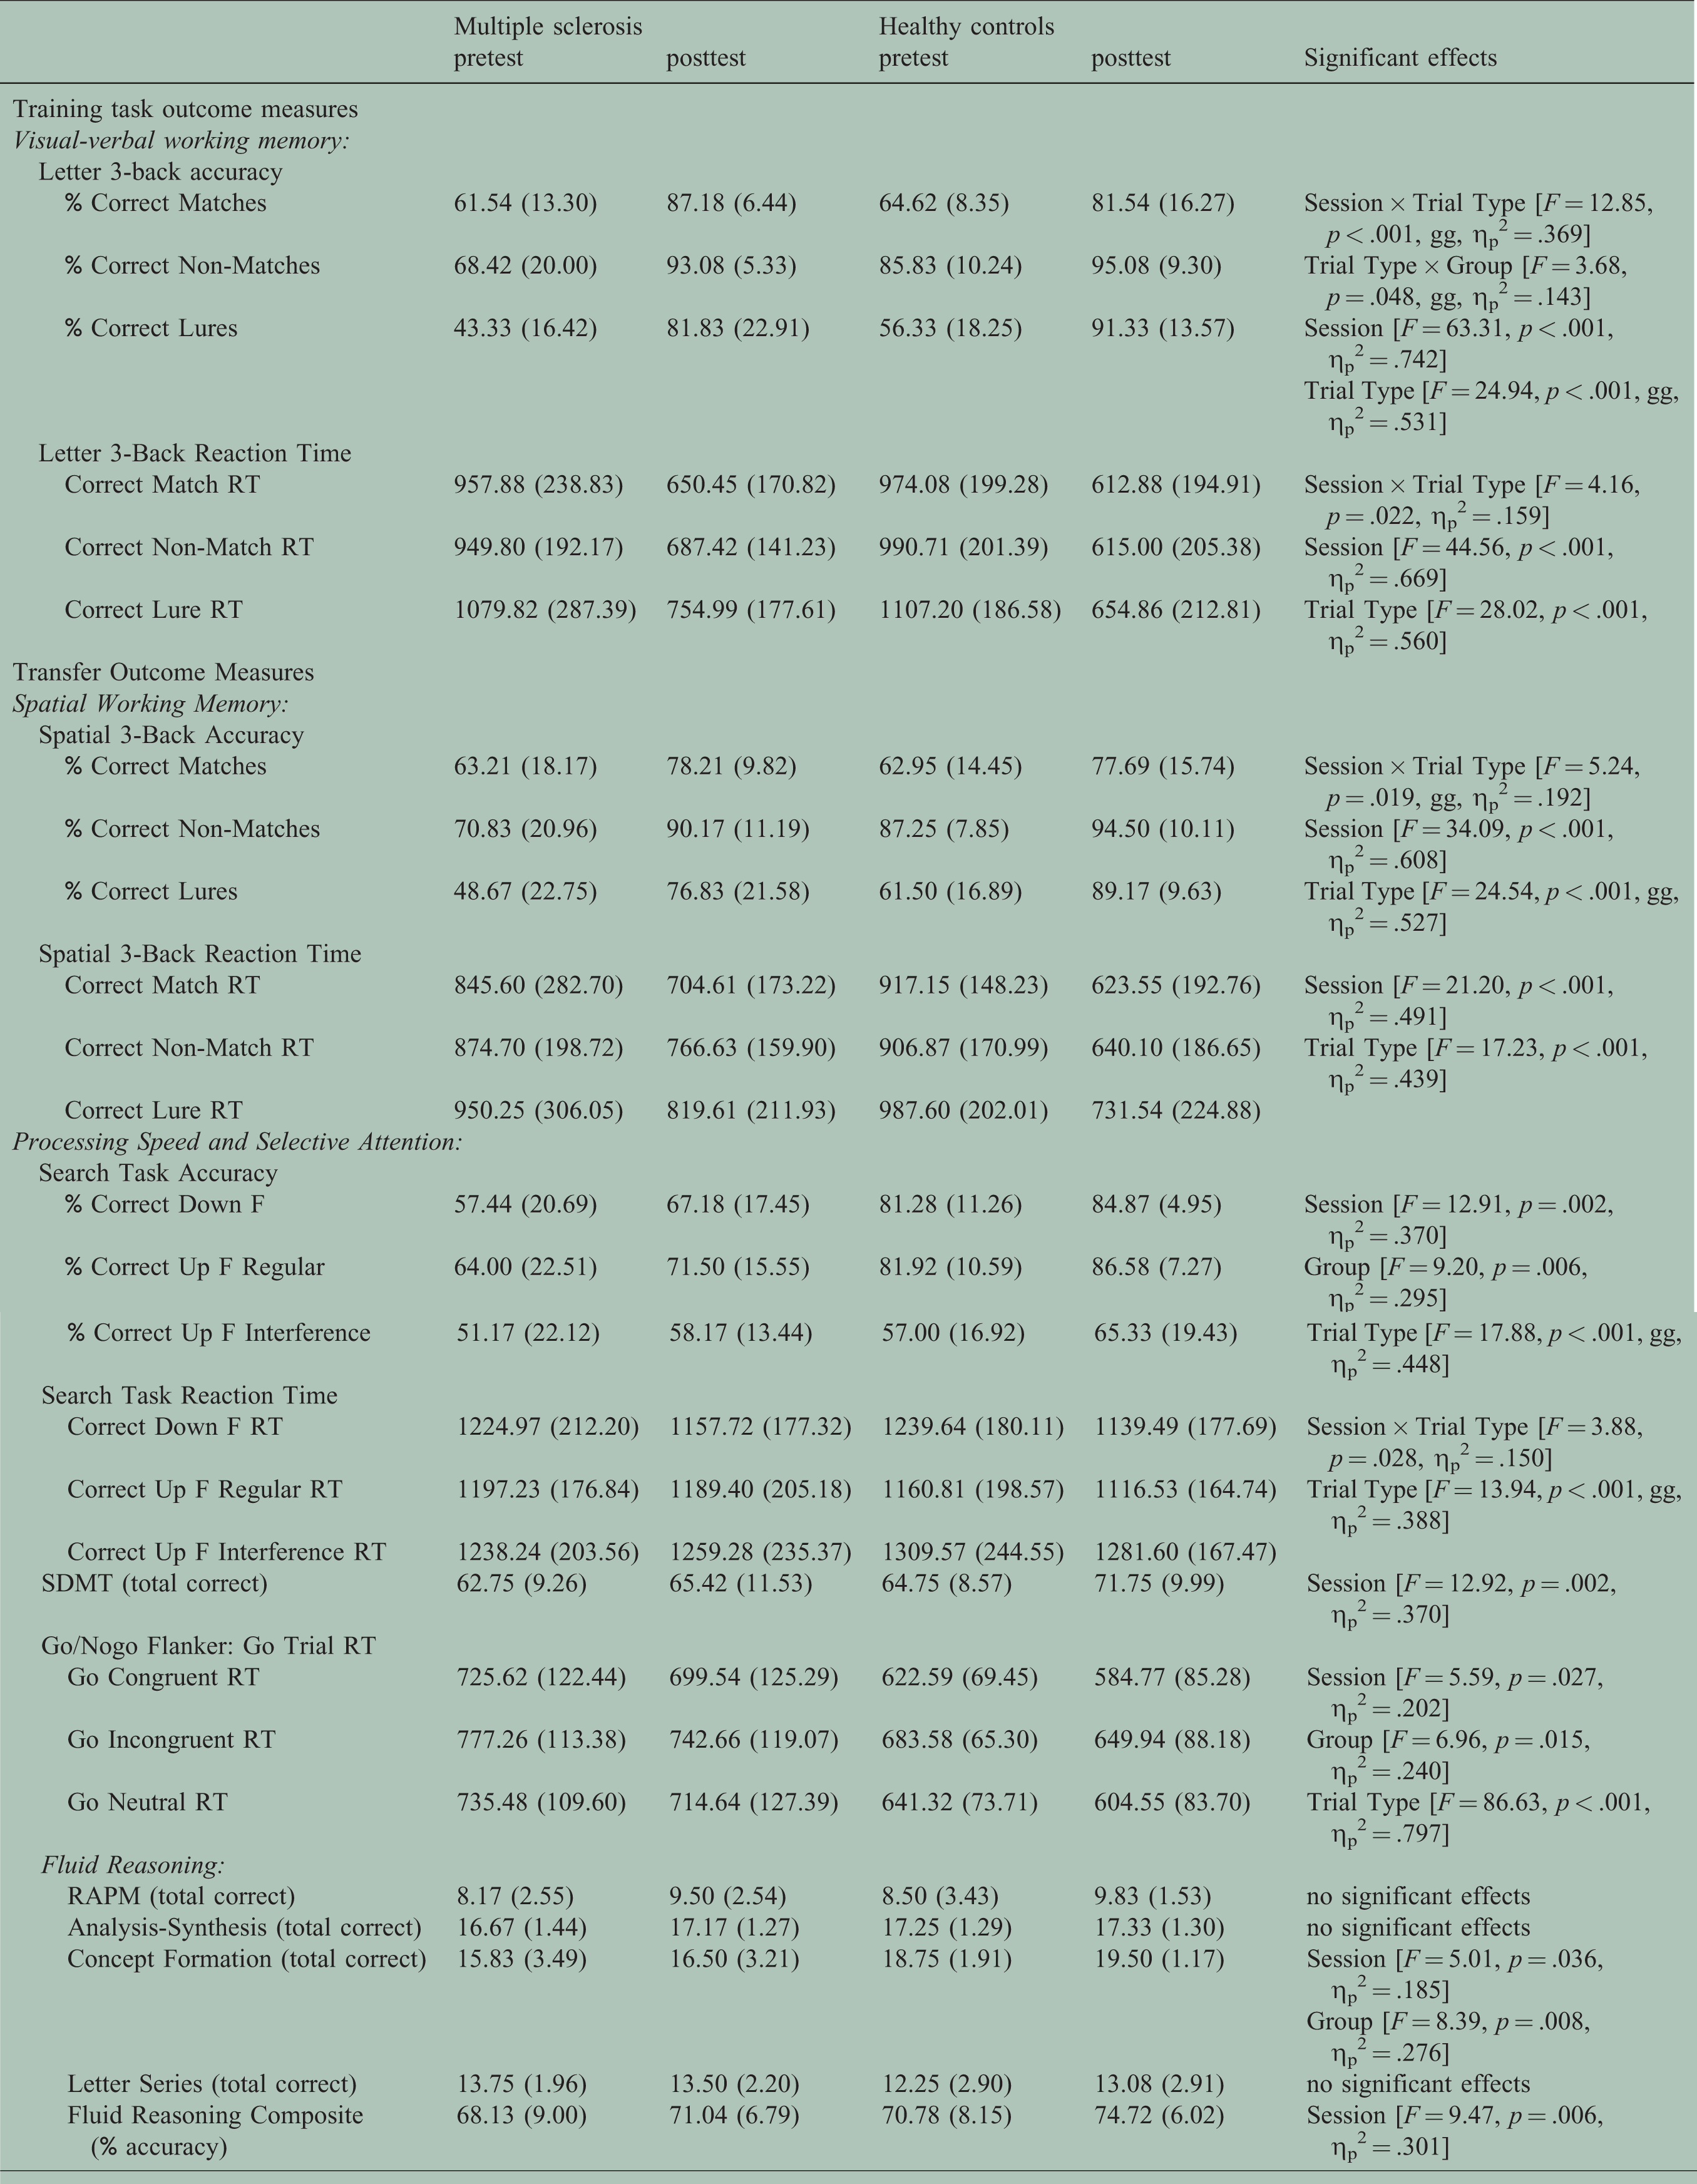
Notes: Data in the pretest/posttest columns show the group mean, with standard deviation in parentheses; RT: Reaction Time, reported in milliseconds; SDMT: Symbol Digit Modalities Test; RAPM: Raven’s Advanced Progressive Matrices; gg: Greenhouse–Geisser correction applied; Session × Trial Type × Group repeated measures ANOVA effects are reported (see rightmost column) for Letter 3-back (separate analyses for accuracy and RT), Spatial 3-back (accuracy and RT), Search Task (accuracy and RT), and Go Trial RT; Session × Group repeated measures ANOVA effects are reported (see rightmost column) for SDMT, RAPM, Analysis-Synthesis, Concept Formation, Letter Series, and Fluid Reasoning Composite.
N-back training performance
There was significant improvement on the training program task over the course of the 20 training sessions, regardless of group, as evidenced by a Training Session effect (see Figure 2). For the Letter 3-back test administered at pre- and posttest, there was a significant Session × Trial Type effect for Letter 3-back accuracy (see Table 2, and Figure 3(a)), which indicated a larger relative improvement from pre- to posttest for Lure trials compared with the other trial types, regardless of group. For Letter 3-back RT, there was a significant Session × Trial Type interaction (see Figure 3(b)), which is accounted for by the fact that there was a larger improvement in RT from pre- to posttest for the Lure trials compared with other trial types, regardless of group.

Training task performance. For each training session, performance was measured as the average n-back level performed across the 10 blocks of that training session. Due to the adaptive nature of the task, if participants performed well, they would be consistently completing blocks with a higher difficulty level (e.g. a higher n). Mapping the average difficulty level achieved at each training session therefore provides a means to examine improvements in performance over the course of training. Note that both groups improved at a similar rate on the training task.
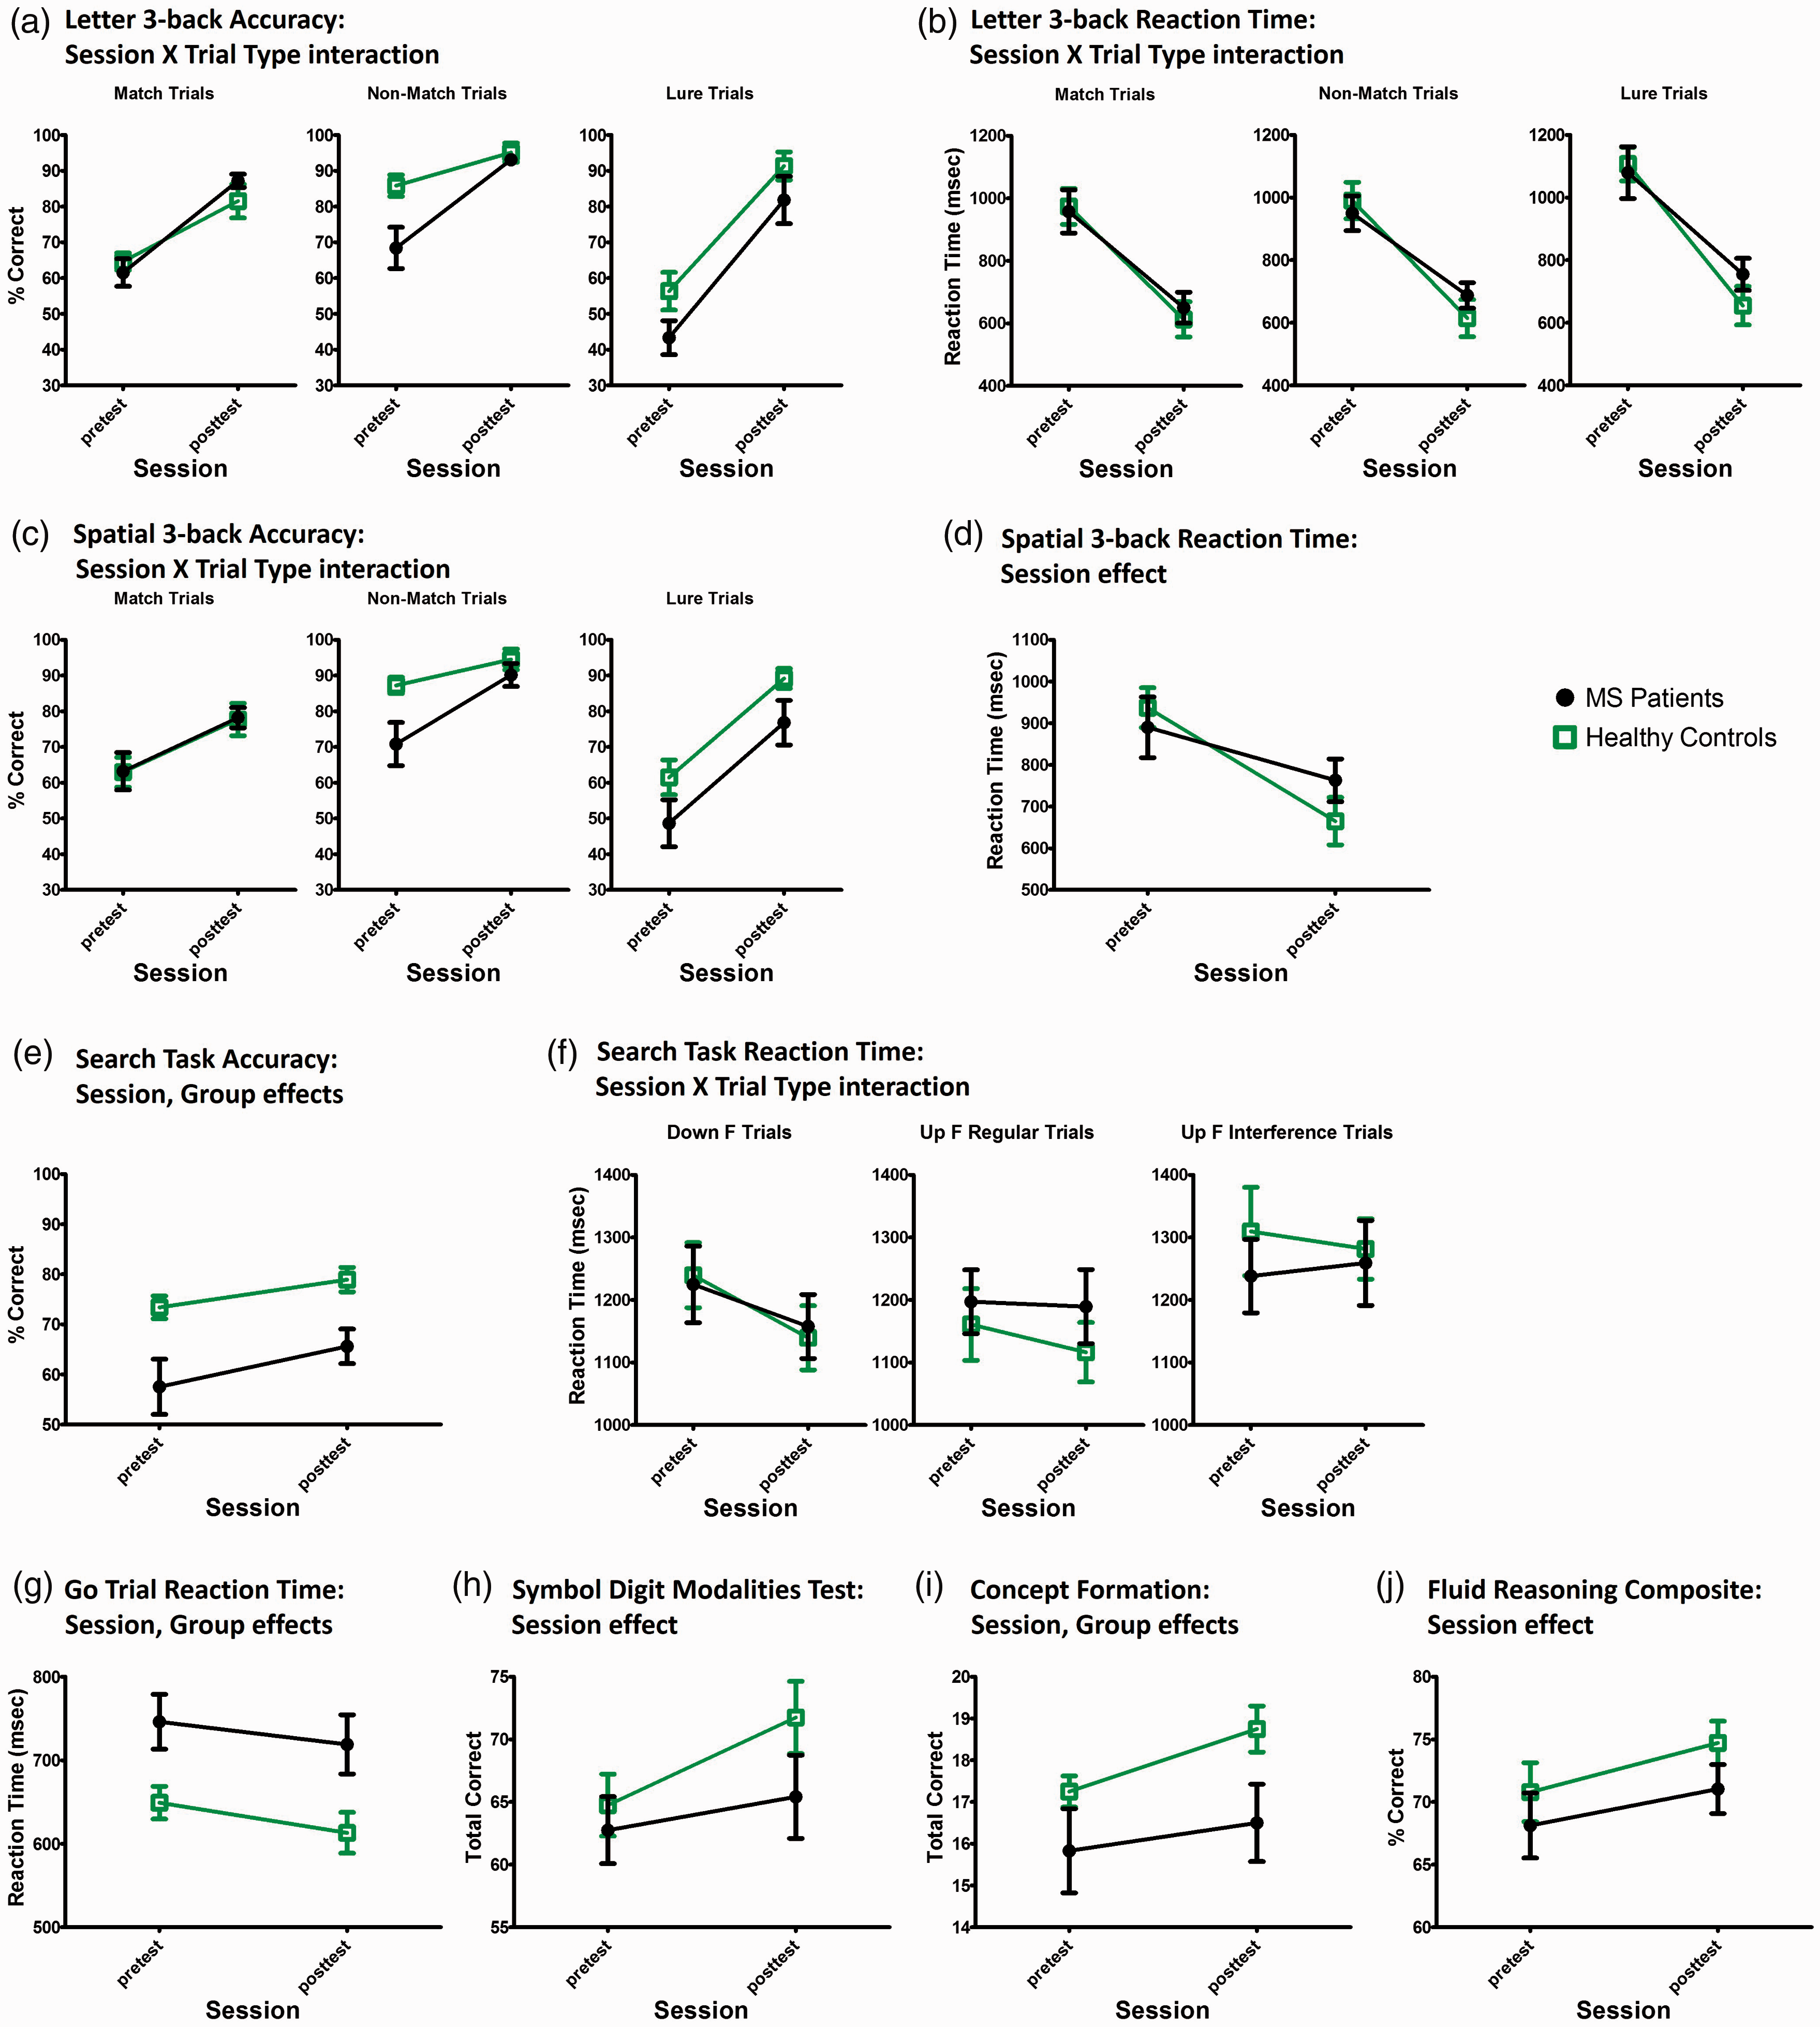
Performance on cognitive outcome measures. The Letter 3-back task served as a measure of improvement on the training task. Accuracy and RT data for this task are shown in (a) and (b) respectively. Transfer of training gains to a task of spatial WM was examined with the Spatial 3-back task. Accuracy and RT data for this task are shown in (c) and (d), respectively. Note that both groups showed similar improvement on the Letter and Spatial 3-back tasks following training. Transfer of training gains to tasks of processing speed and selective attention was assessed with the Visual Search task (e and f), the Go/NoGo Flanker task (g), and the SDMT (h). Transfer of gains to reasoning ability was observed for the Concept Formation test (i) and the Fluid Reasoning Composite variable (j). Data points depict the mean for each group, and error bars represent the standard error of the mean.
Cognitive outcome measures
Significant effects for cognitive performance outcome measures are presented in the rightmost column of Table 2. Group performance data (means and SD) are presented in the pretest and posttest columns of Table 2, for each cognitive test. Significant effects for cognitive performance were then further explored and depicted in Figure 3. There were significant Session effects for the following measures: Spatial 3-back RT (Figure 3(d)), Search task accuracy (Figure 3(e)), Go Trial RT (Figure 3(g)), the SDMT (Figure 3(h)), the Concept Formation test (Figure 3(i)), and the Fluid Reasoning Composite measure (Figure 3(j)). The Session effects indicate improved performance from pre- to posttest for these cognitive measures, regardless of group. There was a Session × Trial Type interaction for Spatial 3b accuracy (Figure 3(c)), which can be explained by a larger relative increase in accuracy from pre- to posttest for the Lure trials compared with other trial types, regardless of group. Note in Figure 3(c) that there is a steeper pre-to-posttest trend line for Lure trial accuracy compared with the other trial types (rightmost panel, for both groups). There was also a Session × Trial Type interaction for Search task RT (Figure 3(f)), which can be explained by a reduction in RT from pre- to posttest for Down F trials only (see the leftmost panel of Figure 3(f), which shows a steeper pre- to posttest trend line for Down F trials), regardless of group. To summarize, there was improved performance on a number of cognitive tests following WM training, regardless of group (evidenced by Session and Session × Trial Type effects), indicating transfer of training gains in both MS and HC groups.
Event-related potential analyses
Grand averaged ERPs for patients with MS and HCs are shown in Figure 4. One subject in the MS group had excessive artifact and therefore did not have sufficient trials for ERP analyses (MS n = 11, HC n = 12). For N2 component amplitude, there was a significant Session × Cluster × Trial Type effect (see Figure 5(a)). Post-hoc analyses showed that compared with pretest, posttest N2 amplitude was significantly enhanced (more negative) for Non-Matches (at Fz (p < .001) and Cz clusters (p = .002)), Lures (at Fz (p < .001) and Cz clusters (p = .019)), and Matches (Cz cluster only (p = .047)). To summarize, the Session × Cluster × Trial Type interaction observed for N2 amplitude can be accounted for by the fact that for Match trials, the pre-to-posttest N2 enhancement was only observed at Cz, whereas for the Non-Matches and Lures, there was enhancement of the N2 at both Fz and Cz clusters. This statistical pattern was observed for both MS and HC groups (no significant interactions with Group factor). The topographic maps in Figure 6 present these N2 amplitude effects and are in line with the statistical analyses. The topographic maps indicate a pronounced enhancement of frontal-central N2 amplitude at post- compared with pretest for the Non-Match and Lure trials, for both groups. The maps also show that for Match trials, the enhancement of the N2 component was more centralized (localized closer to the Cz region electrodes) than for the other trial types, again in line with the effects observed in the statistical analyses.

Grand averaged event-related potential waveforms. Each waveform represents the group mean for a given condition. Waveforms are averaged separately for Match, Non-Match, and Lure trial types. Activity for the Fz, Cz, and Pz electrodes, which were the central electrodes in each corresponding cluster that was used for analyses, are shown. Approximate locations of the N2 and P3 components are marked. Note at posttest the enhancement of the negative deflection at around 200–300 msec (N2 component), particularly in the frontal and central electrodes.

Effects of working memory training on the N2 and P3 components. Data for the significant Session × Cluster × Trial Type interaction for N2 amplitude are shown in (a). Generally, both groups showed an enhancement of the N2 component, particularly at the frontal cluster, for the Non-Match and Lure trial types. Both groups also showed an enhancement of N2 amplitude at the central cluster for Match trials, although this effect was less pronounced. The Session effect for N2 latency is depicted in (b). The Group factor also interacted separately with Cluster and Trial Type, which is not depicted graphically here. Generally, MS patients had longer N2 latency compared with HCs, but both groups still exhibited shorter N2 latency at post- compared with pretest. Interactions for P3 latency are depicted in (c), which shows that both groups had shorter P3 latency at post- compared with pretest for the Match trials in particular. Data points depict the group mean, and error bars represent standard error of the mean.

Topographic maps of N2 component amplitude. The topographic maps were generated from the grand averaged waveforms using all 256 electrodes, with amplitudes between electrodes calculated by interpolation. The time points for the topographic maps were chosen based on the cluster with the largest peak amplitude of the N2 for a given stimulus category. Once the highest amplitude cluster was identified, the amplitude of the main electrode in that cluster was used to determine the time point in the grand average waveform for visualizing the topographic maps. Data shown represent activity above the canthomeatal line. The topographic maps correspond with what was observed in the grand averages and the statistical analyses examining clusters along the midline. The distribution of the N2 component enhancement at posttest was different for Match vs. Non-Match/Lure trials. Both groups exhibited a frontal-central enhancement of the N2 component for Non-Match and Lure trials, as a function of training. For Match trials, there was a more central enhancement of the N2 component.
For N2 latency, there was a significant Session effect (see Figure 5(b)), indicating shorter N2 latency at post- compared with pretest, regardless of group. There were also significant Cluster × Group (p = .029) and Trial Type × Group (p = .029) interactions. The interactions can be accounted for by longer N2 latency for MS patients than HCs, regardless of session, particularly for the Match trials and for the Cz cluster (see Figure 4, middle row panels). Figure 5(b) shows that for the patients with MS, training resulted in shorter N2 latency at posttest compared with pretest, which was similar in latency to what was observed for HCs at pretest.
For P3 amplitude there was a Group effect (p = .021), and a trend towards a Session × Group interaction (p = .057). HCs tended to exhibit a greater enhancement of P3 at post compared with pretest than the MS group (see grand averages, Figure 4), accounting for the interaction trend; but this did not reach statistical significance. For P3 latency, there were significant Session × Trial Type (p = .031) and Trial Type × Group (p = .015) interactions (see Figure 5(c)), and a Cluster effect (p = .009, gg). The Session × Trial Type interaction can be explained by shorter P3 latency at post- compared with pretest for the Match trials, regardless of group. The MS patient group also tended to have longer P3 latencies, particularly for the Match and Non-Match trials, explaining the Trial Type × Group effect
Depression, fatigue, and quality of life measures
There were no significant training-related effects or interactions obtained for total score on the BDI-II and FSS. There was a borderline Group effect for quality of life role-physical score (note n = 11 for MS group; one patient left an item blank [p = .011]), but there were no significant Session effects or interactions for any of the quality of life measures.
Discussion
We examined the effects of WM training in adult patients with MS. Compared with HCs at baseline, patients had significantly poorer performance on tests of visual-verbal WM (Letter 3-back accuracy), processing speed and selective attention (Go/Nogo Flanker RT and Search Task accuracy), and reasoning ability (Concept Formation accuracy). These performance deficits were found despite comparatively normal SDMT performance in the patients with MS compared with HCs. Thus, although the MS patient group did not meet clinical criteria for cognitive impairment (as per SDMT scores), they still exhibited signs of subthreshold cognitive decline in comparison with the HC group, as evidenced by statistically significant baseline differences on non-clinical, experimental cognitive tests. Both groups improved substantially on the n-back WM training protocol and on a Letter 3-back task. The patients with MS (and HCs) also had improved performance, following training, on tasks of spatial WM, processing speed (e.g. SDMT), complex attention, and reasoning ability. The results provide a proof-of-concept that adaptive n-back WM training may be a viable option for improving cognitive function in MS.
In regards to the electrophysiological findings, the patients with MS exhibited an enhancement of frontal-central N2 amplitude following training that was comparable with HCs (see Figure 5(a)), which suggests plasticity of neural resources involved in WM. The N2 ERP component is modulated by the demands of monitoring conflicting stimulus information, 30 and by mismatch between sequential stimuli or between an internal template and an external stimulus31—key aspects of WM. Training also resulted in shortened latency of the N2 component in both MS and HC groups. Although the patients with MS had generally longer N2 latencies than HCs regardless of training session (pre- or posttest), the mean N2 latency for MS patients at posttest was similar to what was observed for HCs at pretest, suggesting a normalization of N2 latency in the patients with MS following training. A similar effect was observed for P3 latency during Match trials of the Letter 3-back task, indicating that speed of processing for stimulus categorization may have also been improved. 32 While previous studies have provided initial evidence of the cortical regions that may be affected by WM training in MS,26,27 the present study extends this work and suggests that the neurocognitive mechanisms underlying the N2, in particular, are susceptible to the effects of n-back WM training in patients with MS.
The present study did not observe any significant changes on subjective measures of fatigue, depressive symptoms, or quality of life indices, following WM training in MS. This could be due in part to the fact that the patients with MS had statistically similar scores compared with HCs on most of these subjective measures already at baseline. Furthermore, these measures may not have been sensitive enough to detect less pronounced, but still functionally meaningful, improvements in mental abilities or everyday activities that may have resulted from training.
There are several methodological shortcomings of the present study, including: (1) The sample size was relatively small. However, the observed effect sizes were generally large, and there was convergence of training-related effects for multiple measures of cognitive function. In addition, electrophysiological measures showed significant changes with training, providing additional neurophysiological corroboration for the pattern of cognitive performance findings. (2) The evaluation of improvements on everyday activities and subjective mental abilities also has limited generalizability from this study. (3) There was a significant difference in age between the MS and HC groups, although both groups primarily consisted of young adults in their 20s–30s (see Table 1). The groups did not differ on other demographic variables such as education level and estimated IQ. (4) Inclusion of an MS control group that received either a different or no intervention would have allowed us to examine potential practice and placebo effects. However, other work completed by our laboratory that compared a perceptual training task with the n-back in healthy individuals found that the N2 effect and improvements on some cognitive measures were unique to n-back training, and not to the perceptual training task that did not train WM. 37 (5) The long-term effects of WM training were not examined. Future longitudinal research is necessary in order to examine the extended benefits of WM training in MS. (6) While the MS patient group exhibited poorer performance on several cognitive tasks (including the Letter 3-back) at baseline, as noted, they were not significantly impaired on the SDMT (the major clinical measure of cognitive impairment in MS used in this study). Further, cognitive impairment was not part of the inclusion criteria for the patients with MS in this study. Therefore, we cannot unequivocally conclude that the WM training protocol used in the present study would lead to improved cognitive function in MS patients with significant clinically defined cognitive impairment.
In summary, the findings of the present study support the view that targeted training of WM can improve cognitive outcomes in MS. The results also suggest that neural activity associated with conflict monitoring and/or mismatch identification processes is enhanced in patients with MS after n-back WM training. The totality of these findings are promising, and warrant replication and extension of this work in a larger study in patients with MS that meet clinical criteria for cognitive impairment.
Footnotes
Acknowledgements
We sincerely thank Melissa Meynadasy, Johan Nakuci, Rosanna Pagán-Alemán, Kayla Sherwood, and Xuedi Wang for their help with data collection, behavioral test scoring, and data entry.
Conflicts of interest
The authors declared no potential conflicts of interest with respect to the research, authorship, and/or publication of this article.
Supplementary material
Supplementary material is available for this article online.
Funding
The author(s) disclosed receipt of the following financial support for the research, authorship, and/or publication of this article: This work was supported by a pilot grant from the National Multiple Sclerosis Society to JLS.
Note
References
Supplementary Material
Please find the following supplemental material available below.
For Open Access articles published under a Creative Commons License, all supplemental material carries the same license as the article it is associated with.
For non-Open Access articles published, all supplemental material carries a non-exclusive license, and permission requests for re-use of supplemental material or any part of supplemental material shall be sent directly to the copyright owner as specified in the copyright notice associated with the article.