
Abstract
Background
Although multinational clinical trials frequently use patient-reported outcomes to measure efficacy, measurement equivalence across cultures and languages, a scientific requirement, is rarely tested. Clinically accessible accounts are rare; exemplars are needed.
Objective
To develop and test a Turkish version of the Multiple Sclerosis Walking Scale (MSWS-12v2) as a clinical exemplar for examining measurement equivalence.
Methods
The MSWS-12v2 Turkish (MSWS-12v2T) was developed using recognised methods for linguistic equivalence. Rasch measurement theory was used to examine measurement performance (multiple tests of targeting, scale performance, and person measurement) and measurement equivalence (differential item functioning). UK data (n = 3310) were used for comparisons and differential item functioning testing.
Results
One hundred and twenty-four people from two Turkish centres completed the MSWS-12v2T. Rasch measurement theory evidence supported MSWS-12v2T as reliable (person separation = 0.96) and valid (thresholds ordered; no concerning item misfit, bias, or person misfit). However, four items demonstrated significantly different performance between UK and Turkish samples. These item differences significantly affected scores (person measurements) at the group-level (p < 0.001). Individual person differences were less pronounced.
Conclusions
Linguistic equivalence does not guarantee measurement equivalence; independent testing is required. Rasch measurement theory enables sophisticated and unique examinations of cross-cultural measurement equivalence and we recommend this be tested routinely in pivotal multiple sclerosis clinical trials.
Keywords
Introduction
Clinical trials in multiple sclerosis (MS) and other diseases are increasingly multinational and use patient-reported outcome measures (PROs) to evaluate efficacy. 1 Obtaining clinically meaningful and accurate conclusions from these trials require that the measurement properties of PROs are stable across cultures and languages.2–4 Here, we address this significant task by developing and testing the 12-item MS Walking Scale (MSWS-12) in a Turkish version to provide a clinically accessible demonstration of process and discussion of requirements and methods.
Typically, the PROs used in multinational studies have been translated into relevant languages using recognised methods that seek to achieve linguistic equivalence,5–8 on the assumption that this equates to measurement equivalence, which is rarely examined. However, while linguistic equivalence is necessary, it is not comprehensive enough to demonstrate measurement equivalence.1–4 PRO measurement performance is a context-dependent empirical question that requires formal comparisons of psychometric properties in study data across variables that include language and versions. 2 Moreover, measurement stability in one context (e.g. English language) does not guarantee measurement stability in another (e.g. Turkish language).
Measurement equivalence can be studied with ‘traditional’ and ‘modern’ psychometric methods. 9 Clinicians are more familiar with the traditional methods of reliability and validity testing, which are based on classical test theory (CTT).a,10,11 Within this paradigm, similarity of PRO item and scale parameters across different samples indicates measurement stability. b However, results generated by traditional psychometric methods are limited because their statistical tests are score-distribution dependent.10,11 Therefore, results are confounded unless the groups compared have similar sample mean scores and standard deviations (SDs). This cannot be dictated within a clinical trial.
Modern psychometric methods, a general term embracing two related but different paradigms called Rasch measurement theory (RMT)12,13 and item response theory (IRT), 10 enable far more rigorous and sophisticated evaluations of measurement equivalence than CTT. First, both paradigms use mathematical models; therefore, formal testing is conducted on the extent to which observed data accord with, or ‘fit,’ the expectations that were articulated mathematically. Second, both paradigms enable examinations of differential item functioning (DIF) – head-to-head comparisons of item performance across groups. 14 That being said, RMT has unique advantages over IRT: item parameter estimates generated by RMT analyses are independent from the distributional properties of the sample from which they are derived.15–19 While results arising from the analysis of PRO data from a sample must be sample-dependent to some extent, RMT analyses allow for the meaningful comparisons of item performance and scale performance stability to be performed across groups with different distributions. This critical concept is fundamentally important.
Here, we report the development, testing, and examination of measurement equivalence of a Turkish version of the MSWS-12v2 (MSWS-12v2T) using the RMT psychometric paradigm, as an exemplar for clinicians.
Methods
Overview
The study had three stages. First, we developed the MSWS-12v2T using standard methods (stage 1: translation and adaptation). Second, we administered the MSWS-12v2T to a sample of Turkish people with MS, and examined item responses using RMT (stage 2: RMT examination of MSWS-12v2T performance). Third, we examined the performance stability of the MSWS-12v2T against the UK MSWS-12v2 using data from the South West Impact of MS study (SWIMS; stage 3: examination of the performance stability of the MSWS-12v2T). 20
All participants included in the study were aged 18 years or older, and gave their prior voluntary verbal informed consent. Ethics approval from the Institutional Review Board (IRB) was not required for the Turkish aspects of this study. SWIMS was approved by the local research ethics committee in 2004. 20 RMT analyses were conducted using RUMM2030 professional.21,22
MSWS-12v2 questionnaire
The MSWS-12v2 is a PRO questionnaire developed to measure the impact of MS on walking. 23 The instrument has 12 questions (items) asking people with MS to rate 12 different aspects of walking-related tasks during the preceding two weeks. The MSWS-12v1 was developed using traditional psychometric methods; all items had five response categories (1=‘not at all’ to 5=‘extremely’). 24 However, RMT examinations of MSWS-12v1 implied that three items had too many response categories. Therefore, the updated MSWS-12v2 questionnaire has three items with three response categories (1=‘not at all’; 2=‘sometimes’; 3=‘a lot’). 23 The response categories for the remaining nine items were unchanged. The MSWS-12v2 questionnaire has been, and is currently being, used in multiple clinical trials. 25 The traditional method of scoring the MSWS-12v2 is to summate item scores to generate a total score between 12–54. Lower scores indicate improved walking disability. 23
Stage 1: translation and adaptation
Two bi-lingual Turkish-English medically trained doctors working for a professional translation agency, independently, and without conferring, translated the MSWS-12v2 into Turkish (forward translation). The content and conceptual equivalence of the two translated Turkish versions were compared. Differences were reconciled by two independent doctors, one of whom was the lead author. Finally, the Turkish version was translated back into English by two blinded translators without previous knowledge of the MSWS-12 (backward translation). The two back-translated versions of the MSWS-12v2 questionnaire were compared with the original UK MSWS-12v2 questionnaire. Differences were reconciled by an independent medical doctor and the lead author. The updated and translated MSWS-12v2T questionnaire was approved by the authors.
Stage 2: RMT examination of MSWS-12v2T performance
During 2012, the MSWS-12v2T was administered to Turkish people with MS attending two outpatient centres located in South Eastern Turkey (Dicle University) and by the Black Sea (Samsun University). Treating neurologists approached consecutive outpatient attendees verbally inviting them to complete the questionnaire on the appointment day. Data collection continued until approximately 125 completions were received. The sample size was arbitrary and deemed adequate for the purpose.
MSWS-12v2T item responses were analysed using RMT. Multiple analyses were conducted in three broad areas: item and scale-to-sample targeting; item and scale performance; person and group measurement. These methods are described fully elsewhere. 9
Stage 3: examination of the performance stability of the MSWS-12v2T
Three different analyses were undertaken to determine the measurement stability of the MSWS-12v2T compared with the original UK version. We used data from SWIMS: a longitudinal cohort study of people from two UK counties (Devon and Cornwall) with neurologist-confirmed MS who complete multiple PROs on a six-monthly basis. 20 The MSWS-12v2 is completed annually.
First, we compared the psychometric properties of the MSWS-12v2T with the psychometric properties of the MSWS-12v2 in the total SWIMS sample. Second, we examined DIF by comparing item performance of the UK and Turkish versions. DIF is detailed elsewhere.9,14,26–28
In brief, the basic premise for the stable performance of any MSWS-12v2 item is that for any level of walking ability, the expected value on the item is the same regardless of whether people are Turkish or English. In the analysis we: combined Turkish and UK MSWS-12v2 data; divided the combined sample into three similar sized subgroups (class intervals) with different levels of walking ability (low, medium, high); and compared the expected item values for Turkish and UK within each class interval. A two-way analysis of variance provided a unified way of quantifying DIF across the groups and across differing levels of walking disability. To enable a balanced analysis, we selected a random sample of UK data the same size as the Turkish sample.
If DIF is detected, an important next step is to determine if it is real (true-positive differences) or artificial (false-positive/compensatory differences).14,28 This is achieved by removing items demonstrating DIF, sequentially and iteratively, and reanalysing the remaining item set after each removal. This process continues until a set of items has no DIF.
Finally, we determined the extent to which DIF identified at the item-level impacts on the overall scale-level estimates derived from all 12 MSWS-12v2 items. To achieve this, we derived two walking ability estimates for each person in the Turkish sample: one estimate that used the item values (calibrations) derived from the Turkish sample analysis; the other estimate using the item calibrations derived (and anchored) from the UK total sample. Differences between these two walking ability estimates were examined graphically (scatterplot) and statistically (paired samples t-test).
Results
Stage 1: development of the MSWS-12v2T questionnaire
Figures in the Supplementary Material show the final version of the English MSWS-12v2 (Supplementary Material, Figure 1), and the translated Turkish MSWS-12v2T (Supplementary Material, Figure 2).
Stage 2: RMT examination of MSWS-12v2T questionnaire performance
Sample characteristics
Sample characteristics.
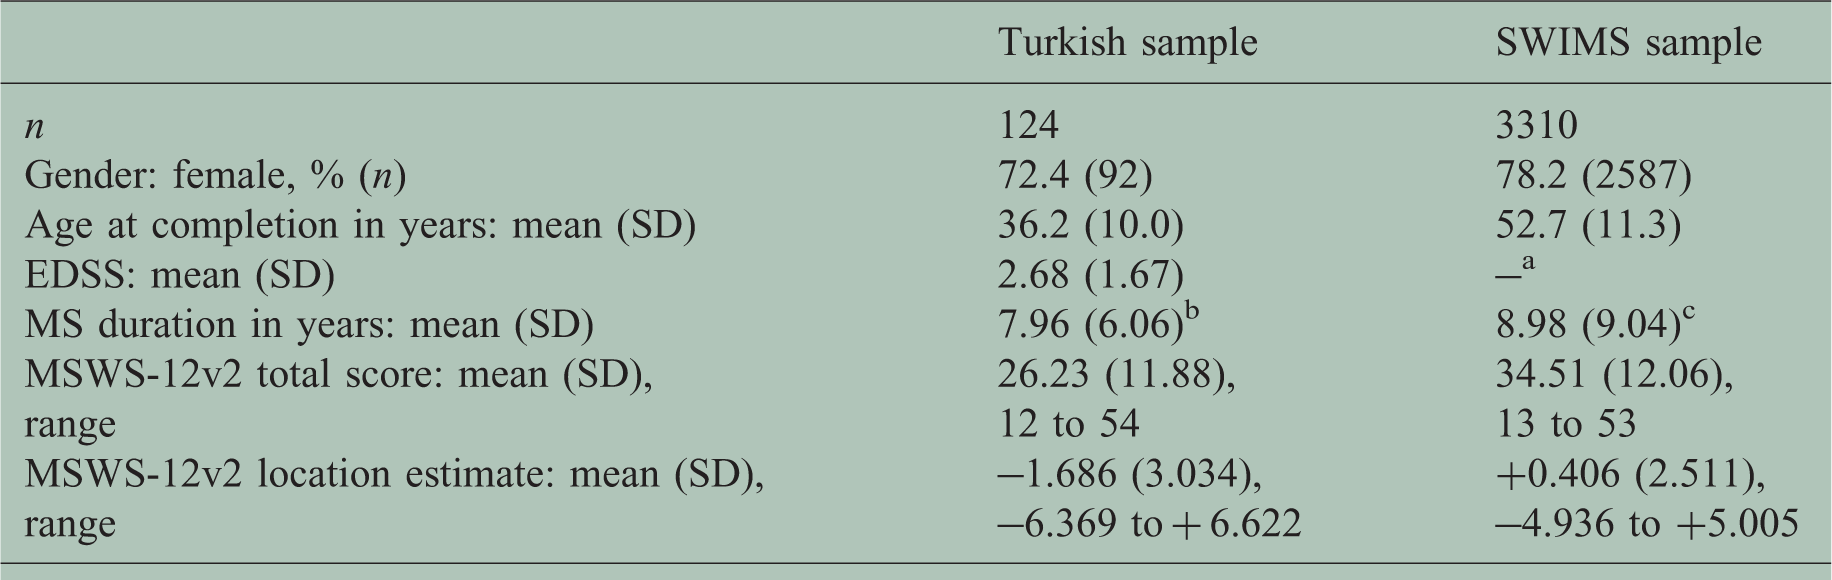
EDSS: Expanded Disability Status Scale; MS: multiple sclerosis; MSWS-12v2: 12-item Multiple Sclerosis Walking Scale version 2; SD: standard deviation; SWIMS: South West Impact of MS study.
aEDSS scores were not collected at the same time as the MSWS-12v2 data; btime since MS diagnosis; cMS duration at time of joining SWIMS study.
MSWS-12v2T questionnaire performance
Rasch measurement theory (RMT) summary for study samples.
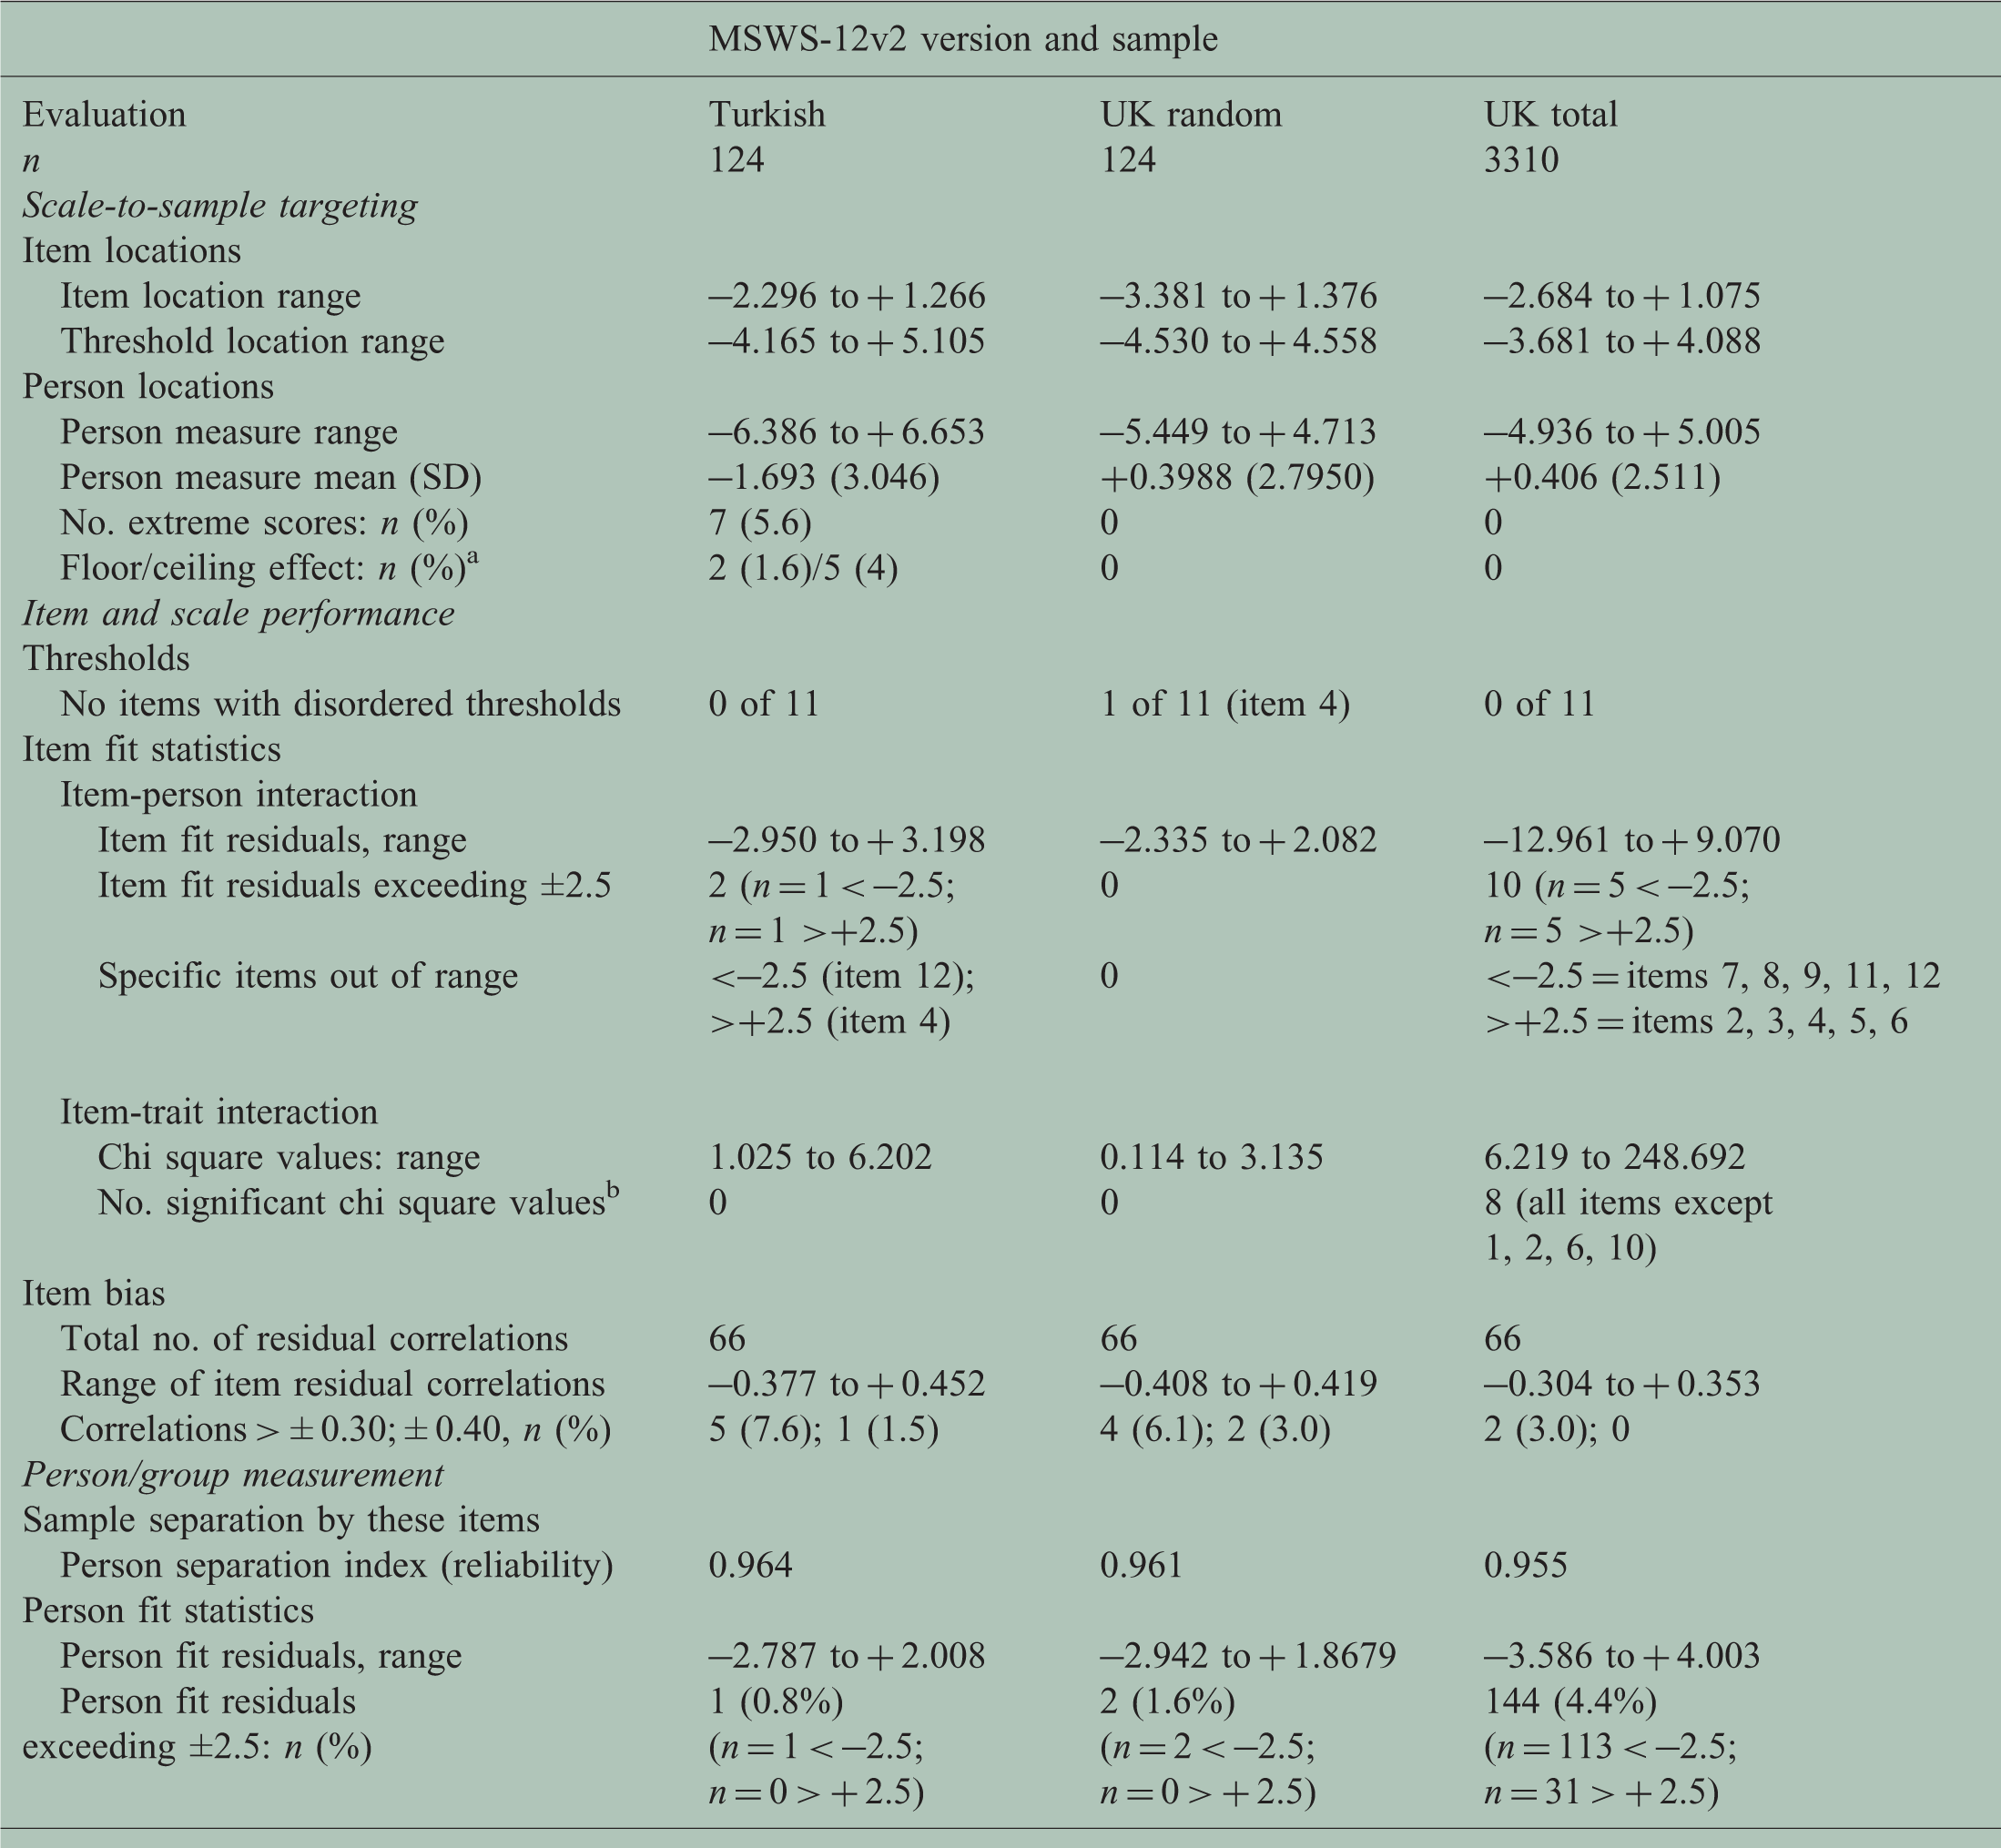
MSWS-12v2: 12-item Multiple Sclerosis Walking Scale version 2; SD: standard deviation.
Where the floor effect equals the maximum possible score (worst disability), and the ceiling effect equals the minimum possible score (least disability).
Bonferroni adjustment (0.000833 for 12 items (0.01/12)).
Scale to sample targeting
Figure 1(a) and (c) shows the person-item threshold distribution plot. Table 2 shows the numerical values. Targeting was adequate to make reasonable judgements of scale performance and person measurement. Specifically, the sample had MSWS-12v2T measurements (upper histogram bars, Figure 1(a): approximate range –7 to + 7 logits) that covered the entire scale range (lower histogram bars, Figure 1(c): item thresholds approximate range –4 to + 5 logits). Figure 1(a) shows that the sample’s disability distribution was skewed to the left (less disabled end) of the scale range.
(a) and (c) Matching of scale to sample using the Person-item threshold distribution plot;a (b) the Turkish 12-item Multiple Sclerosis Walking Scale (MSWS-12v2T) item threshold map showing walking ability measurement range (x-axis) represented by each item’s response categories.b
Item and scale performance
Figure 1(b) shows the response categories for all 12 items worked as intended. Figure 1(c) shows the continuum mapped by the 12 items’ thresholds spans a wide range (=9 logits) with no notable gaps and no notable threshold bunching. Fit statistics showed only two items had fit residuals outside the recommended range of −2.5 to +2.5 (item 12 and 4; fit residuals −2.950 and +3.198). There were no statistically significant chi-square values. Figure 2 shows the item characteristic curves (ICCs) for a better-fitting (Figure 2(a), item 5) and the worst-fitting (Figure 2(b), item 4) items. In both graphs, observed item scores (black dots) adhere closely to expected item values derived from the Rasch measurement model (grey line). This implied adequate item fit, and the items formed a statistically cohesive set.
Item characteristic curves for one of the best- ((a); item 5) and one of the worst- ((b); item 4) fitting items. (a) Turkish 12-item Multiple Sclerosis Walking Scale (MSWS-12v2T) item 5: how much has your multiple sclerosis (MS) limited your ability to climb up and down stairs? (b) MSWS-12v2T item 4: how much has your MS made standing when doing things more difficult?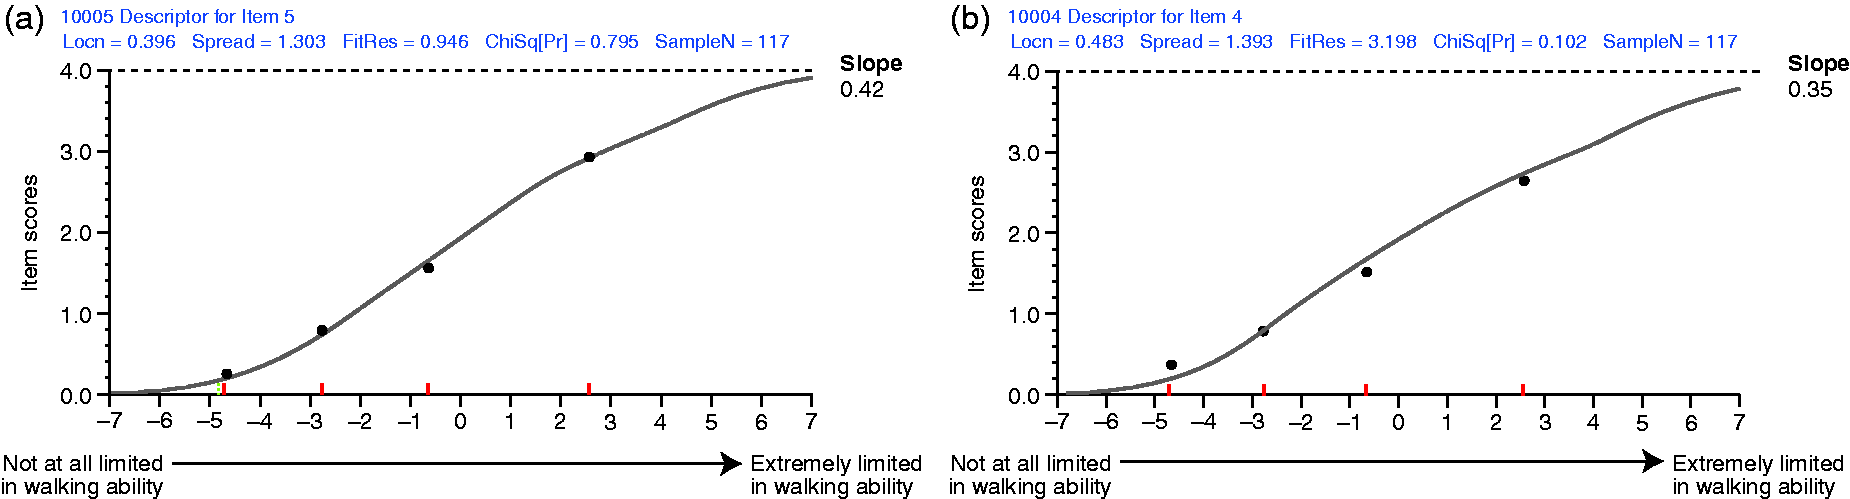
Person and sample measurement
The person separation index (PSI), 9 a reliability statistic, was high (PSI = 0.96). This indicates that the MSWS-12v2T items successfully separated individuals in this sample of Turkish people with MS with high reliability. The fit residual for one person was marginally out-of-range, indicating that 123/124 people gave valid response patterns to the 12 items.
The RMT findings in this sample support the MSWS-12v2T’s performance as reliable and valid, to the extent tested.
Stage 3: examination of the performance stability of the MSWS-12v2T questionnaire
At the time of analysis, the SWIMS MSWS12v2 dataset contained 4731 questionnaires from 1538 people with MS who had participated for 0–7 years. To maximise the within- and between-item comparisons, we used the subset of 3310 records with complete data (score-able responses to all 12 items) and neither floor (total score of 54 = maximum walking disability) nor ceiling (total score of 12 = minimum walking disability) effects. c Table 1 shows the UK and Turkish samples differed notably in size, age, and MSWS-12v2 score/location distributions.
Table 2 shows the RMT results for the Turkish and two UK samples. Results for the random sample (n = 124) that were chosen from the UK sample (n = 3310) are included, to enable a DIF analysis in samples of similar sizes. The three samples show similarities and differences. These results are shown, in part, to illustrate the difficulty of determining the extent of measurement stability from these examinations, and why specific detailed tests are required.
Full results of analysis of differential item functioning by language (UK vs Turkish).

DF: degrees of freedom; sq: square.
Bold values were statistically significant. Bonferroni adjustment for n = 36, (items×comparisons)=0.001389.
To determine if the observed statistically significant DIF was real or artificial we first removed item 4 as it had the largest mean square value (26.48), and re-ran the DIF analysis for the remaining 11 items. Subsequently, five items had significant DIF (items 3, 5, 6, 7 and 10). The DIF for item 11 had resolved, which implied artificial DIF. However, the value for item 7 (that had not been significant previously) was now significant. We then removed item 5 as it had the largest mean square value in the 11-item DIF analysis (27.02) and re-ran the analysis in the remaining 10 items. Three items showed significant DIF (items 6, 7 and 10). Item 6 then had the largest mean square (item 6 = 30.27), was removed, and the analyses re-run in the remaining nine items. One item had significant DIF (item 7: mean square = 25.08); item 7 was removed and the analysis re-run in the remaining eight items. No significant DIF was detected (mean squares range: 0.04–4.70). These findings imply real differences in the performance of four items (4, 5, 6 and 7) between Turkish and UK people. Figure 3 shows the ICCs for the four items with significant DIF, which analysis indicated was real, not artificial (items: 4, 5, 6 and 7). For all four items, the blue Turkish-sample line is above the red UK-sample line. This means that the Turkish people consistently perceived themselves to be more disabled on these four items than UK people.
Four items exhibiting significant differential functioning. (a) Item 4 (made standing when doing things more difficult); (b) Item 5 (limited your ability to climb up and down stairs); (c) Item 6 (limited your balance when standing or walking); (d) Item 7 (limited your ability to walk).
Figure 4 shows the scatterplot for the Turkish sample, where walking ability estimates were derived from the Turkish item calibrations (y-axis) and also from the UK sample item calibrations (x-axis). The graph implies estimates were very similar. We examined the numerical differences using a paired sample t-test; this indicated significant group differences (mean difference = –0.29 logits; SD = 0.39 logits; range –0.58 to + 0.74; t-value = –8.319; p < 0.001). Finally, we determined the proportion of individuals for whom the difference between their two walking-ability estimates differed by more than 1.96 standard errors of the difference. No individuals were identified.
Plot of person measurements derived from Turkish and UK parameter estimates.
Discussion
Our aim was to address an increasingly common measurement problem: the requirement for cross-cultural measurement stability of PRO questionnaires. We used a demonstration to illustrate to clinicians how to approach, identify, investigate and interpret the findings. These stability investigations are not widely known because most reports exist in less clinically accessible specialist measurement literature.14,28 Also, the strengths and weaknesses of different methods for testing cross-cultural stability have not been articulated well enough to clinicians to enable selection of the most appropriate stability assessment method for their needs.
Here, we translated a commonly used MS PRO questionnaire into Turkish, using standard methods and bilingual MS neurologists. As such, we believe this version can be considered linguistically equivalent, although this cannot be formally proven. While the translated version performed well on psychometric evaluations, specific analyses identified significant performance differences between the UK and Turkish MSWS-12v2 questionnaire for four of 12 items. These item-level differences resulted in statistically different scale-level walking estimates for groups, but not for individuals. How this would influence the results of a clinical trial is unclear, as the findings are context-dependent.
How can investigators proceed when they find significant DIF, given these are post-hoc findings in clinical trial data? One option is to measure people using the item calibrations from one language, or from the overall item calibrations derived from all languages. However, this option ignores real cross-cultural differences, generates inaccurate measurements of people, and also misrepresents treatment effects to an unknown degree. The most scientifically accurate method of dealing with DIF is to ‘split’ the items to account for the true identified differences between cultures.14,28 We leave this demonstration for another occasion. Ultimately, the extent to which different approaches affect individual person measurements and study results can only be determined by undertaking different analyses and comparing the findings. It is important to reiterate that these are within-study empirical findings that may not be generalisable.
Here, we used RMT as the psychometric paradigm and show that it enables sophisticated evaluations of measurement stability not achievable using CTT, the psychometric paradigm most widely used in healthcare settings. CTT provides a perspective only on the performance of the translation, rather than a detailed head-to-head comparison of the item-level performance. We did not use IRT for specific reasons; the most important being that two- and three-parameter IRT models do not enable parameter separation, and therefore the results are sample-distribution dependent. 29
Examinations of DIF are not esoteric analyses limited to testing cross-cultural measurement stability. They have wide applicability when the evaluation of measurement stability is required. For example, DIF examinations provide sophisticated and highly appropriate examination of test-retest reliability, 9 unlike CTT assessments, which confound scale and person (in)stability. 9 Similarly, examinations of stability across genders, treatment arms, off/on treatments and different age or disability groups may all be important assessments.
We appreciate that sophisticated psychometric methods are difficult to grasp. However, we suggest that these psychometric methods are warranted in state-of-the-art clinical trials that determine treatments for people and expend significant public funds. We recommend wider application of modern psychometric methods, like RMT, and routine testing of measurement equivalence in pivotal clinical trial PRO data. Regulatory and scientific requirements justify our perspective.
Our study has limitations. The Turkish sample is small and we studied only one scale across two languages. However, we do not think these limitations detract from the article’s main purpose: to provide clinicians with the beginnings of an accessible demonstration on how to address, investigate, interpret and manage measurement equivalence.
An important point raised by a reviewer was: how many people, and who, are required for an adequate evaluation of cross cultural stability? There is no simple answer to the sample size question. There is no truly meaningful way of computing that number as multiple factors are at play and the interpretations are not binary. Naturally, larger samples enable potentially more confident interpretations and more detailed evaluations. However, small sample analyses provide information that assists thinking, largely because the Rasch model’s parameter separability property discussed before (p.2, Introduction) enables more stable results than other sample distribution dependent psychometric paradigms. Regardless of analytic sample size, we emphasise a careful and thoughtful clinical consideration of the findings within the frame of reference of the concept of interest and context of use. The question of ‘who’ should be studied is simpler – ideally, people broadly representative of those in whom the intervention under investigation will be used.
In the article we have discussed real and artificial DIF, but not uniform and non-uniform DIF: a reason being that no items demonstrated non-uniform DIF. A reviewer asked that we address this. Figure 3 shows the four items with DIF. For all items, the two coloured lines are parallel, with one line consistently (systematically; homogeneously) above the other, indicating ‘uniform’ DIF across the continuum. Generally, this is easy to understand conceptually, and to investigate, explain and manage. When the coloured lines cross, or join at one or more points on the continuum, the DIF is described as non-uniform implying the DIF differs in magnitude, and perhaps direction, across the continuum. Non-uniform DIF is much more difficult to explain – both conceptually and empirically – and requires a very careful exploration of the data to provide a coherent explanation and set up any experiments required to clarify the finding or determine if it is erroneous.
Footnotes
Acknowledgements
HD and JH conceived the project. HD, YT and MT organised the forward and backward translations, their review, and collected data. JH analysed the data and drafted the article. All authors reviewed drafts. Juliet Bell, from Excel Scientific Solutions, Horsham, UK, and Monica Dodge from Excel Scientific Solutions, Southport, CT, USA, edited and styled the manuscript per journal requirements.
Conflicts of interest
The author(s) declared the following potential conflicts of interest with respect to the research, authorship, and/or publication of this article: Biogen reviewed and provided feedback on the paper to the authors. The authors had full editorial control of the article, and provided their final approval of all content. H Dib was an employee of Gen Ilac at the time of the study, was an employee of Biogen while this manuscript was developed and is currently an employee of F. Hoffmann-La Roche, but does not hold shares in any pharmaceutical company and reports no conflict of interest. Y Tamam has received consulting/advisor fees/honoraria from: Bayer, Gen Ῑlaҫ, Teva, Merck Serono, Novartis, Sanofi-Genzyme and reports no conflicts of interest. M Terzi has received consulting/advisor fees/honoraria/support for clinical service or research from: Gen Ῑlaҫ, F. Hoffmann-La Roche, Merck Serono, Novartis, Sanofi-Genzyme, and reports no conflicts of interest. J Hobart has received consulting/advisor fees/honoraria/support for clinical service or research from: Acorda, Biogen, Global Blood Therapeutics, F. Hoffmann-La Roche, LORA group, Merck Serono, Novartis, Sanofi-Genzyme, Tigercat Pharma, and Vantia, and reports no conflicts of interest. Research materials can be requested from the authors.
Funding
The author(s) disclosed receipt of the following financial support for the research, authorship, and/or publication of this article: Biogen provided funding for medical writing support in the development of this article. This research received no specific grant from any funding agency in the public, commercial, or not-for-profit sectors.
Notes
References
Supplementary Material
Please find the following supplemental material available below.
For Open Access articles published under a Creative Commons License, all supplemental material carries the same license as the article it is associated with.
For non-Open Access articles published, all supplemental material carries a non-exclusive license, and permission requests for re-use of supplemental material or any part of supplemental material shall be sent directly to the copyright owner as specified in the copyright notice associated with the article.