
Abstract
Background
An abnormal increase of contrast-enhancing lesion (CEL) counts on frequent MRIs is interpreted as a signal of potential worsening in multiple sclerosis (MS) clinical trials. We demonstrate the utility of the MR personalized activity index (MR-pax) to identify such increases.
Methods
We analyzed a previous Phase II study in relapsing patients (n = 167) with MRIs at screening, baseline and months 1–6. We performed five consecutive reviews at 90-day intervals. At each review, we evaluate the MR-pax for each patient and also identify those who meet the rule-of-five (an ad-hoc guideline currently in use). To evaluate its clinical relevance, we assess the relation between having a small MR-pax (≤0.05; indicating an unexpected CEL increase) and relapse status in the 12 weeks post-review.
Results
Of the 399 patient reviews, 35 cases met the rule-of-five; 35 had an MR-pax ≤ 0.05; 18 met both criteria. The proportions experiencing clinical relapse are 63% among those meeting the rule-of-five, 61% among those with MR-pax ≤0.05, and 83% for those meeting both criteria, more than double the rate of those meeting neither criterion (40%).
Conclusion
A guideline combining this new personalized index and the existing threshold-based criterion is able to better identify patients with a higher risk of experiencing relapses.
Introduction
Safety monitoring in clinical trials, both on the group and individual level, is of paramount importance. As safety outcomes can often be heterogeneous across participants of multiple sclerosis (MS) studies, personalized monitoring tools are desirable. In MS studies, especially Phase II trials with frequent magnetic resonance imaging (MRI) scanning, sudden increases of contrast-enhancing lesions (CELs) have been used by data safety monitoring boards (DSMBs) as a signal of potential disease worsening. Current DSMB guidelines to identify patients with increased CEL activity are ad-hoc in nature. One such criterion is the presence of ≥5 CELs above the baseline level on a follow-up scan (rule-of-five). 1 Previous studies showed that meeting the rule-of-five is associated with an elevated risk of a clinical relapse within a month,1,2 confirming the merit of using CEL information to monitor patient safety in MS studies.
However, the rule-of-five approach relies on a pre-determined threshold that does not account for the variability across individual patients and study cohorts, and does not use all available CEL information.2–4 To overcome these limitations, we developed a probability-based index. 5 At each DSMB review, for every patient, this new procedure evaluates as an index the likelihood of observing CEL counts as large as those observed on the patient’s recent scans given the patient’s CEL data from previously reviewed scans. A small value of this personalized activity index (MR-pax) suggests that the observed count is unexpectedly large relative to the activity observed on previous scans, thus signaling a possible change of the underlying disease activity level. In this paper, we demonstrate the utility of this new procedure and compare this probability-based approach to the threshold-based rule-of-five.
Patients and methods
Patients
The patients are from the Phase II study of lenercept, a recombinant tumour necrosis factor receptor p55 immunoglobulin fusion protein, in MS, 6 previously examined by Riddell et al. 2 The cohort includes 167 patients between the ages of 19–51 years and with Expanded Disability Status Scale scores <6. The patients were diagnosed with clinically definite relapsing–remitting (83%) or secondary progressive MS (17%). All patients had at least two relapses in the preceding two years. Patients were randomly assigned to one of four treatment arms: 100 mg (n = 40), 50 mg (n = 40), 10 mg (n = 44) dose of lenercept, or placebo (n = 43).
MRI visits were scheduled at screening, at baseline and then on a four-week basis until week 24. Clinical assessments took place approximately at the same time as the MRI visits up to week 24 and on a 12-week basis thereafter until week 48. Patients were enrolled in the study over a period of about nine months. The study was terminated after 24 weeks of double-blind treatment because of a significant increase in the relapse rate among the 50 mg and 100 mg groups. 6
The study was approved by the UBC Clinical Research Ethical Board. All patients gave written informed consent for the original study.
Evaluation of MR-pax
In a typical Phase II MS clinical trial setting, patients are enrolled in a staggered manner and are followed by MRI on a monthly basis, while the DSMB reviews the cumulative CEL data at scheduled intervals. We treated the study as if it was ongoing and monitored by the DSMB with the following schedule: The first review took place 120 days after the first patient’s screening scan and subsequent reviews took place every 90 days until all scans were completed. At each review, scans will be referred to as either ‘previous’ or ‘new’. A
The index relies on a mixed-effects negative binomial regression model to describe CEL counts on both the previous and new scans. Details on how the model was developed can be found in Zhao et al.
5
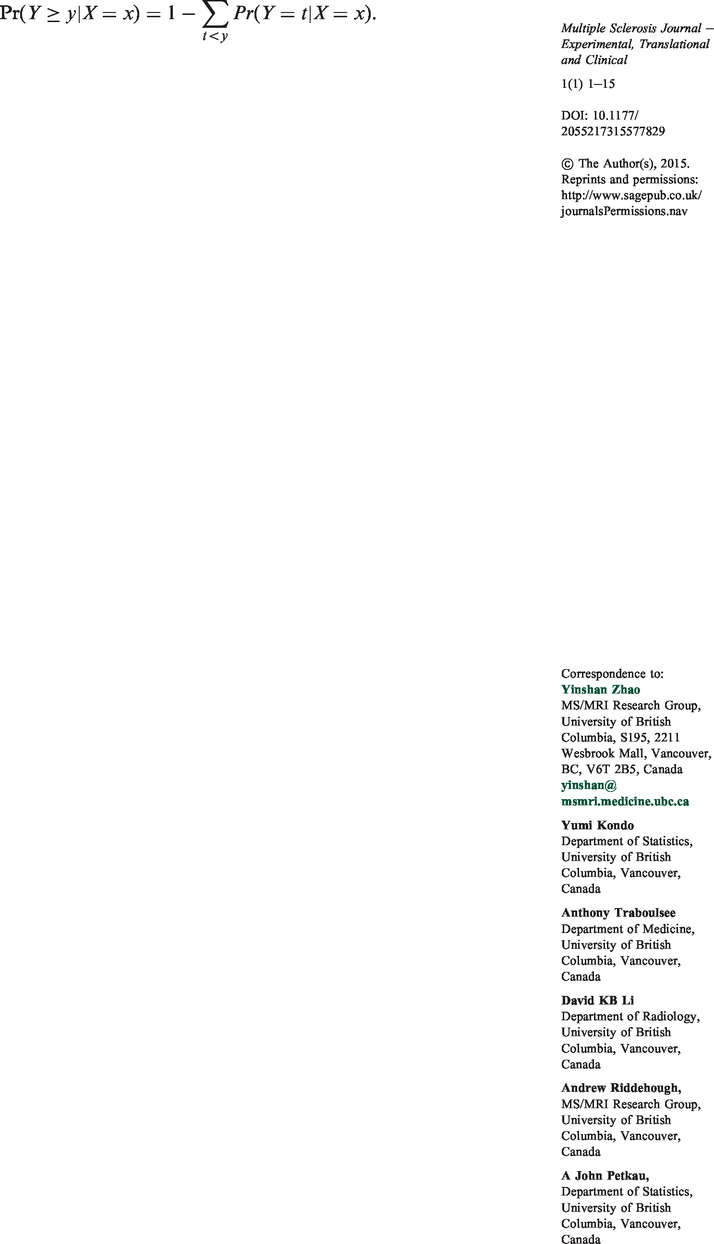
In this model, we assume that the patient-specific random effects (a random intercept), representing the activity levels of individual patients, are independent. In the current analysis, we assume that these random effects follow a gamma distribution and given the activity level of a patient, the monthly CEL counts of the same patient are independent and follow a negative binomial distribution. The model enables us to predict the distribution of a patient’s total CEL count on the new scans given his or her CEL counts on previous scans. The incorporation of patient-specific random effects implies this distribution will differ from patient to patient. By comparing the observed total CEL count (y) on the patient’s new scans to this predicted distribution, we obtain the following conditional probability as our index, MR-pax: the chance to develop y or more CELs on the new scans given the CEL counts on the previous scans (x), i.e.:
Interpretation of MR-pax with illustrative cases.

aThe MR-pax value, ranging from 0 to 1, represents the fraction of placebo patients with the same level of CEL activity on the previous scans who are expected to have at least that many CELs on the new scans. The ranges specified in this column are suggested potential ranges to correspond to the interpretation of the MR-pax values given in the last column.
bThe MR-pax values of the example patients are computed based on the model fitted to the data of the Phase II study of lenercept at the final review.
cA previous scan is either a scan performed before the treatment initiation (screening or baseline) or a follow-up scan that has been reviewed previously by the DSMB. The values x1/x2/x3 represent the CEL counts on a patient’s previous scans, i.e. three previous scans with x1, x2, and x3 CELs, respectively.
dA new scan is a follow-up scan that has not been reviewed previously. The values y1/y2 represent the CEL counts on a patient’s new scans, i.e. two new-scans with y1 and y2 CELs, respectively.
MR-pax: magnetic resonance personalized activity index; CEL: contrast-enhancing lesion; DSMB: data safety monitoring board.
The model is fitted by maximum likelihood to the available data at each review. As the overall activity level within each treatment group in a Phase II trial often changes over time, scanning time is included as a categorical covariate corresponding to three periods (fixed effects): pre-study (baseline and screening), months 1–3 and months 4–6. The three treated groups are considered as a single group. The pre-study mean level was assumed to be the same for all patients, whereas the mean levels during the second and third periods are allowed to differ for the treated and placebo patients. However, for monitoring purposes, all patients were treated as placebo patients when evaluating the indices, i.e. the evaluation was carried out only based on the estimated mean level of the placebo group. MR-pax can then be interpreted as the likelihood to observe such an increase under no active treatment. The implementation of this procedure is carried out using a freely available package lmeNB 7 that we developed under R, an open source environment for statistical computing and graphics. 8
Relationship to clinical relapse
To demonstrate the clinical relevance of the CEL increases identified by our procedure, we investigated the relation between relapse status and having an extreme MR-pax value. A patient is
To compare with the rule-of-five, the relapse rates are also computed for the following four categories of patient reviews: (1) not meeting the rule-of-five and MR-pax >cut-off, (2) not meeting the rule-of-five but MR-pax ≤cut-off, (3) meeting the rule-of-five but MR-pax >cut-off, and (4) meeting both criteria. A logistic regression with patient-specific random intercepts is used to compare the relapse risk of these four categories at selected cut-offs for MR-pax. As our initial analysis indicates that the overall relapse rate decreased after week 24, whether the post-review period was beyond week 24 was also included as a covariate. This analysis was performed using the R package lme4. 9
Results
The patient characteristics have been reported previously.2,6 With the assumed review schedule, there were five reviews and a total of 399 person reviews. Except for one patient who was lost to follow-up after one review, all patients had two or three reviews. Figure 1 provides the timeline of patient recruitment, MRI scanning and reviews.
Timeline of patient recruitment, MRI scanning and DSMB reviews. (Each row represents a patient. Lines are disconnected at missing scans.). MRI: magnetic resonance imaging; DSMB: data safety monitoring boards.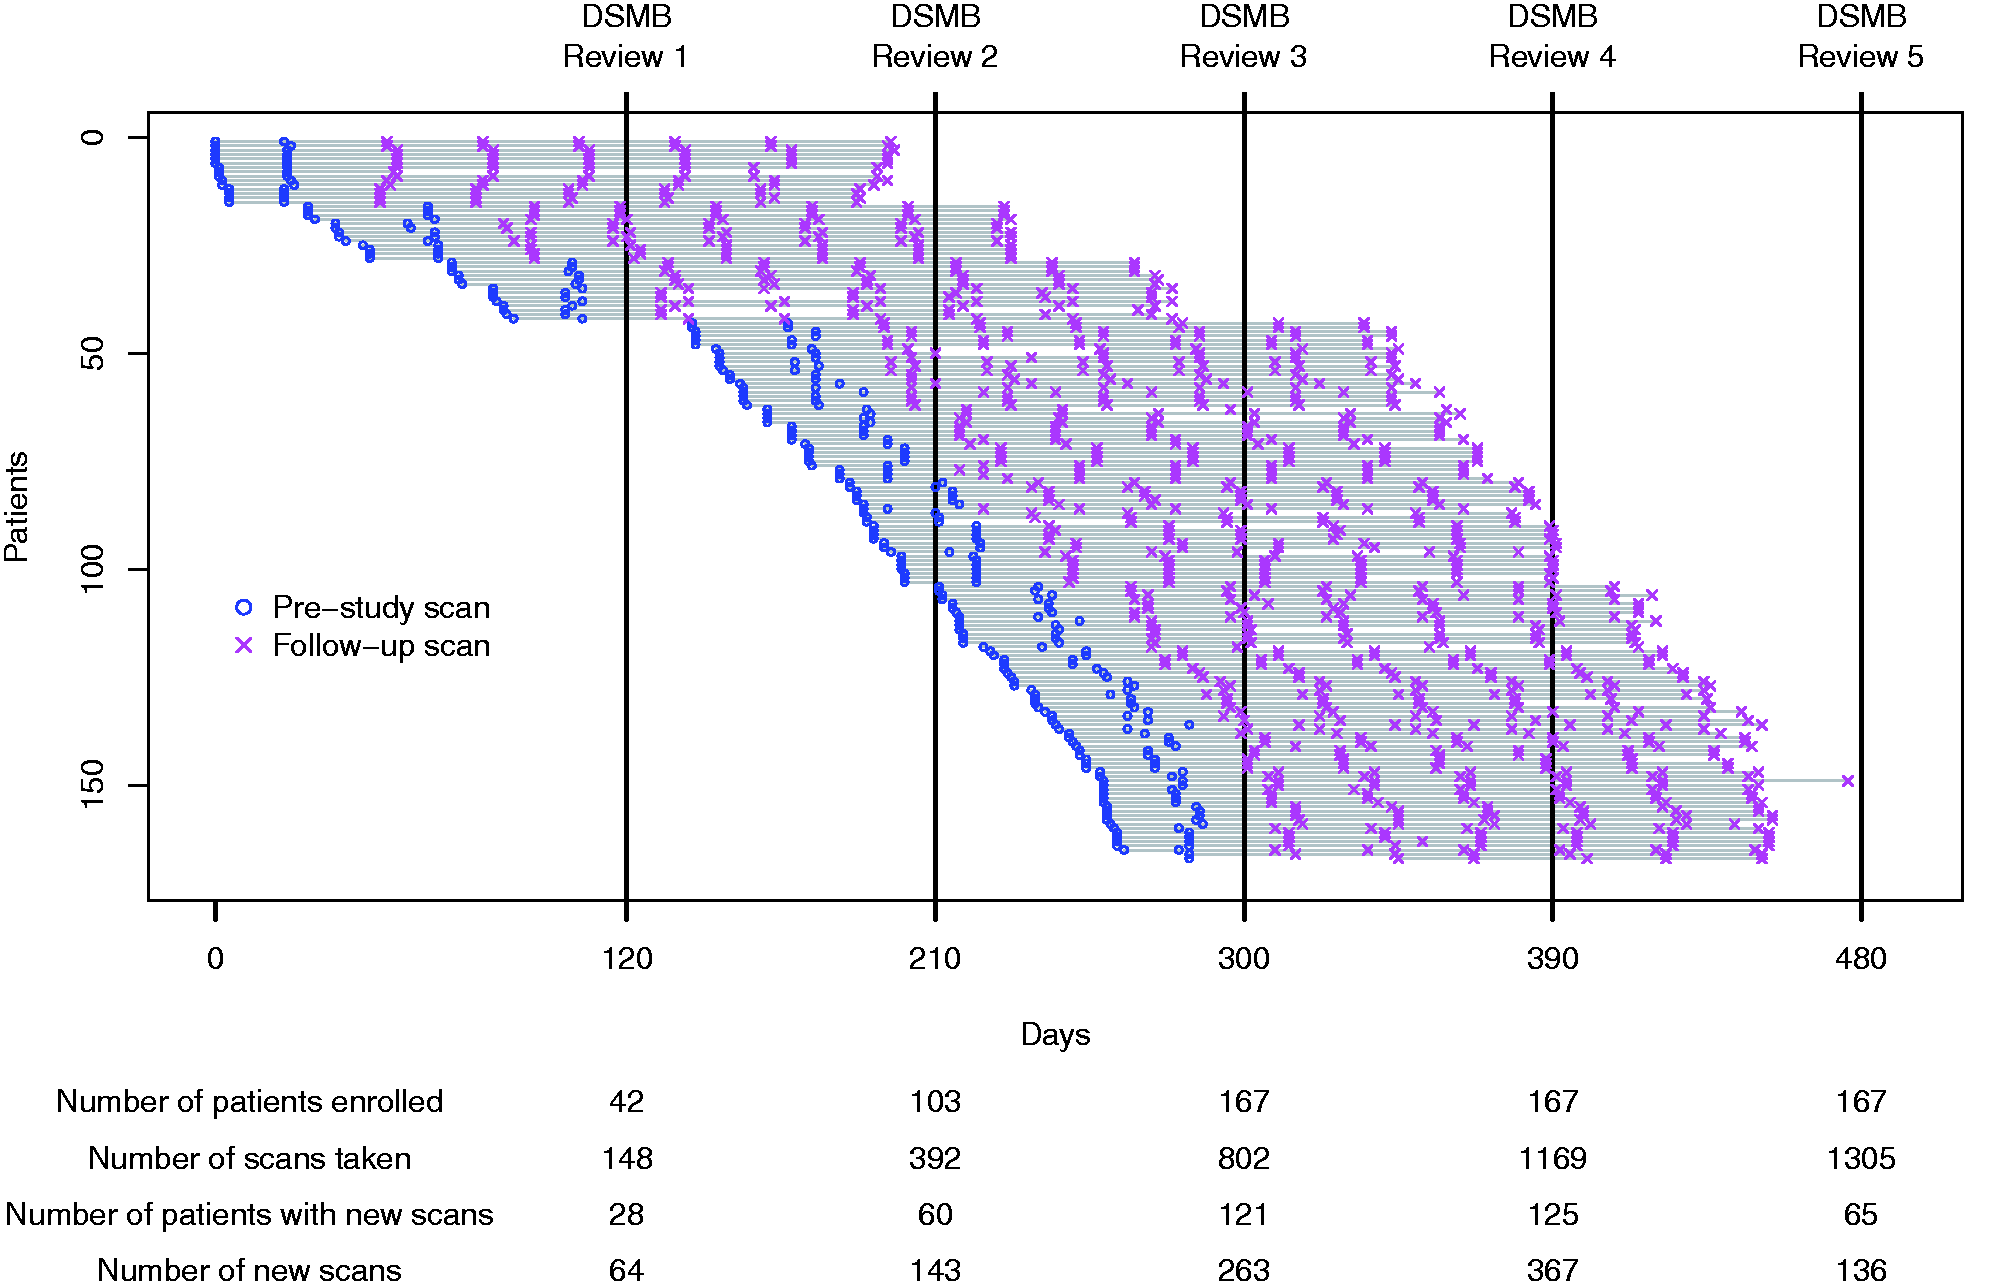
The estimated mean levels for the placebo group at each review are presented in Figure e-3. As an example, Figure e-4 shows the output provided by lmeNB at Review 2, which includes a ranking of the patients according to their MR-pax values. Figure 2 shows the MR-pax values that are <0.25 and their corresponding ranks at each review. The treated patients were predominant among the cases with extreme MR-pax values at all reviews. For example, at Review 2, new scans from 60 patients were reviewed (15, 14, 17 and 14 from the 100 mg, 50 mg, 10 mg and placebo groups, respectively). Six patients, all treated, had an MR-pax ≤0.05 (less than a 1-in-20 chance of observing a total CEL count as extreme or more extreme for a placebo patient with the same CEL counts on the previous scans). The most extreme case from the placebo group was ranked only 12th (MR-pax = 0.17). Seven treated patients and no placebo patients met the rule-of-five at this review; four of the seven patients who met the rule-of-five had an MR-pax ≤0.05 while the MR-pax values of the other three were 0.07, 0.14 and 0.30 and ranked 7th, 8th and 19th, respectively.
Cases having an MR-pax <0.25 at each DSMB review. MR-pax: magnetic resonance personalized activity index; DSMB: data safety monitoring board.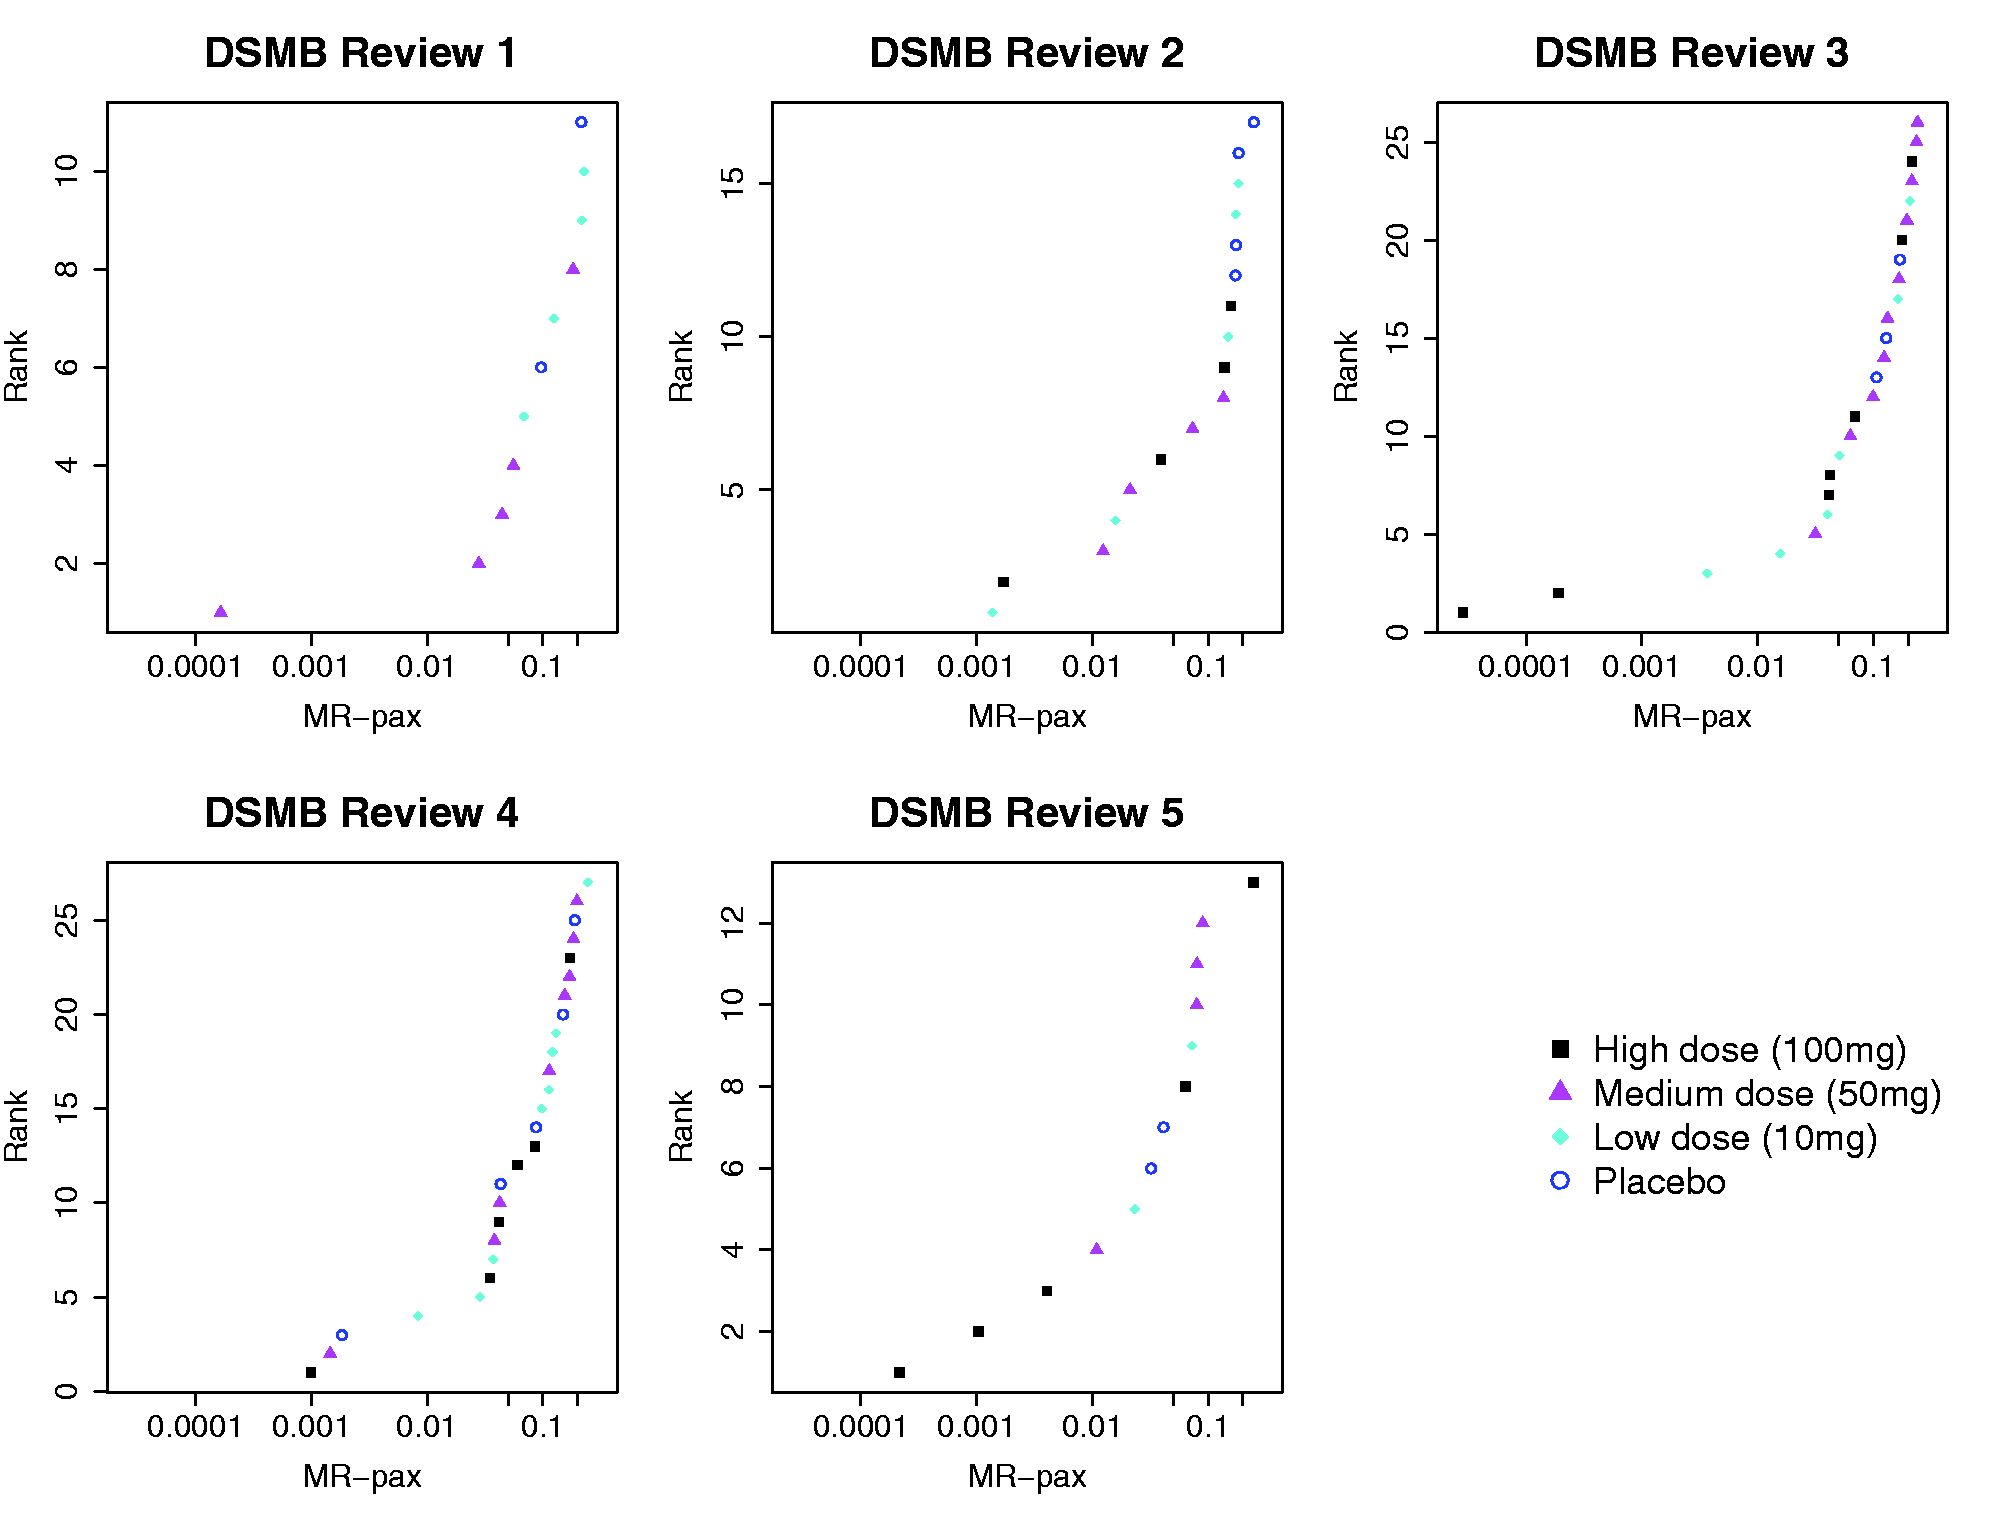
Figure 3 shows the histograms of the MR-pax values, pooled across all reviews, by treatment group. The values of the placebo group are more evenly distributed between 0 to <1, whereas greater proportions of small MR-pax values are observed in the treated groups, especially in the 100 mg group, indicating more cases with unusual CEL increases.
Distribution of the MR-pax values by treatment groups (all DSMB reviews combined; each patient may contribute more than one patient review. The black bar represents the proportion of patient reviews with MR-pax < 0.05.). MR-pax: magnetic resonance personalized activity index; DSMB: data safety monitoring board.
Contrast-enhancing lesion counts (CELs) and MR-pax values for six selected patients at their successive reviews. (The times of an individual patient’s reviews are determined by their study entry time as illustrated in Figure 1.).

aScreening and baseline scans. bReviews that also met the rule-of-five. MR-pax: magnetic resonance personalized activity index; NA: missing scan.
The relapse status cannot be determined for three patient reviews because of lack of clinical follow-up. For the remaining patient reviews, the overall rate of not being relapse free in the 12-week period following the last new scan was 165/396 (42%). The rate for those who met the rule-of-five is 22/35 (63%). Figure 4 shows the post-review relapse rate for patients with an MR-pax value below different cut-offs (black solid line) ranging from 0.001 to 0.25. The relapse rate of those who met the MR-pax criterion was always much higher than the overall rate regardless of the cut-off value; it peaked at 73% around the cut-off of 0.02 and steadily declined for cut-off values larger than 0.15. The figure also shows the relapse rates for the subgroup of patients who met both the MR-pax criterion and the rule-of-five (grey solid line), which were in general higher than those who met the rule-of-five and peaked at 84% around the cut-off of 0.06.
The post-review relapse rate for those who met the MR-pax criterion and the subgroup who also met the rule-of-five. 
Relapse rate in the following 12-week period by whether or not meeting the MR-pax criterion and the rule-of-five.

aBase on logistic regression with patient-specific random intercepts. MR-pax: magnetic resonance personalized activity index.
In the fit of a mixed-effects logistic regression allowing an interaction between meeting the rule-of-five and having an MR-pax ≤0.05, the interaction term approached significance (p = 0.08). Compared to the group which met neither criterion, the OR of relapse for the group meeting both criteria is 9.58 (95% confidence interval (CI): 2.25–55.4); the ORs for those who met only one criterion are close to one.
Discussion
MRI lesion activity in MS patients is known to be widely variable both between patients and studies, presenting a considerable challenge to determine whether the observed increases in individual patients are outside the normal range. Existing guidelines, such as the rule-of-five, are easy to implement, but may not fully meet this challenge as they do not recognize the heterogeneity across patients. We developed a probability-based approach to evaluate the degree of abnormality of each patient according to his or her own data from previous scans. 5 Our procedure relies on a mixed-effects negative binomial model that allows a different mean level for each patient and allows the within-patient variability to vary according to the patient’s mean level. The model is fitted to data collected from the study under review and updated with the new available data at each review. Therefore, MR-pax is patient and cohort specific.
The MR-pax procedure is not restricted by a study’s duration, scanning frequency, or size. Nor does it require that all patients have the same number of scans; patients can be at different points in follow-up or have some missing scans. These features ensure its usefulness in real-time safety monitoring.
We developed a package to implement this procedure 7 that is freely available at http://CRAN.R-project.org/package = lmeNB. In addition to the model considered in this paper, the package offers a range of modelling choices that are considered by Zhao et al. 5 In practice, a data center can implement our procedure using this package. The resulting patient list sorted by their MR-pax values (as shown in Figure e-4) can be provided to the DSMB, greatly simplifying the DSMB’s task of identifying the extreme cases and reviewing their CEL activities.
In MS clinical trials, DSMBs are normally blinded to the treatment assignment. To maintain blinding, Zhao et al. 5 previously proposed to analyze all patients as one group. Although this approach has the convenience of easy implementation, in practice it could lead to bias in the presence of a treatment effect. In this paper, we fitted the model allowing the group mean to differ between the treatment arms during the follow-up, but MR-pax was evaluated based on the placebo mean regardless of the treatment assignments. MR-pax can then be interpreted as the likelihood to observe such an increase if the patient had not received the treatment. This modification avoids the potential bias, yet does not unblind the DSMB as long as the evaluation of MR-pax is performed by an independent (unblinded) statistician. See Appendix e-3 for a comparison of these two approaches.
To eliminate the potential influence of the treatment, the DSMB may wish to include only pre-treatment scans as previous scans. Such strategies are easy to implement using our R package as it allows the user to customize the ‘previous’ and ‘new’ scans.
Threshold-based procedures, such as the rule-of-five, recognize cases with a substantial increase from the baseline level. However, a fixed threshold can be too high for patients who had no or few baseline lesions, and not high enough for those with a large baseline count. A guideline combining MR-pax and the rule-of-five can better identify patients with large increases and such patients tend to have the highest risk of experiencing post-review relapses. We also observed that patients with a moderately extreme MR-pax value (0.05–0.10) often did not meet the rule-of-five, but were also prone to have post-review relapses. Our results support the finding that a period of high CEL activities is associated with clinical worsening as suggested by previous studies.10,11 On the other hand, disease worsening might not always be manifested in clinical relapses. Unusual increases identified by MR-pax may be a precursor of other forms of worsening. Further validation of this procedure with larger cohorts will be useful.
MR-pax provides DSMBs with a rational basis to rank patients with different follow-up duration and activity levels. A DSMB may choose an MR-pax or rank threshold according to their level of safety concern. However, an extreme MR-pax is not meant to be an unequivocal indicator of clinical worsening; rather, it signals which patients might need more careful monitoring. As worsening may occur independent of CEL activity, it would be desirable to extend our method to monitor both clinical and MRI measures simultaneously.
MR-pax was developed to assess changes in individual patients, but it also has potential utility in group-based monitoring. In the original analysis of the cumulative number of newly active MRI lesions, 6 a higher median count was observed in the 50 mg and 100 mg groups compared to the placebo; however, the differences were not statistically significant. Our MR-pax procedure identified more cases as extreme in all three treated arms compared to the placebo; this supports the clinical observation of unexpected toxicity with lenercept. It is possible that the treatment did not have the same adverse effect on all patients. In such circumstances, a group-based summary such as the median is not sensitive in reflecting such differences. Our procedure can be a sensitive tool to detect adverse treatment effects on CELs, especially when limited to a subset of patients.
To reliably estimate MR-pax, we rely on a statistical model that can accurately describe the pattern of longitudinal CEL counts. At the early reviews when only a small number of patients are available, it is difficult to reliably fit the model and this limits the effectiveness of our procedure. We are currently extending our approach within the Bayesian framework and will implement this extension under R. This will enable the DSMB to incorporate prior information based on data from previous trials and based on their own expert knowledge, and thus enhance the performance of our MR-pax procedure, particularly in the early stages of a trial.
In this paper, we illustrated how a monitoring tool can be tailored to individual patients and its potential in safety monitoring on an individual level. The idea can be extended to other longitudinally collected safety outcomes, and, therefore, has broader utility in clinical trial monitoring.
Funding
This work was supported by the Multiple Sclerosis Society of Canada, the Natural Sciences and Engineering Research Council of Canada, and the Milan & Maureen Ilich Foundation.
Conflict of interest
None declared.
Footnotes
Acknowledgements
The authors thank Dr Roger Tam for reviewing the manuscript.