
Abstract
Objective
To refine prognostic stratification for intermediate-risk acute myeloid leukemia (IR-AML) by leveraging machine learning to integrate clinical and genomic features and relate them to survival outcomes.
Methods
We conducted a two-cohort study comprising a single-center development cohort from Beijing Tsinghua Changgung Hospital (n = 56) and an independent external cohort from The Cancer Genome Atlas (TCGA; n = 79). Demographics and mutational profiles were analyzed alongside survival outcomes. We developed three tree-based models—random forests, gradient-boosted decision trees (GBDT), and XGBoost—on the Tsinghua Changgung cohort, using stratified five-fold cross-validation for internal validation.
Results
In internal cross-validation, tree-based learners showed strong discrimination (best GBDT AUROC 0.98, 95% confidence interval (CI) 0.91–1.00). On the external TCGA cohort, GBDT achieved AUROC 0.73 (95% CI 0.62–0.83). Model-agnostic explanations (Shapley additive explanations) consistently highlighted white blood cell count, age, transplantation, and TET2 among top contributors.
Conclusion
An interpretable machine learning framework built from accessible clinical and genomic variables provided quantitative risk discrimination for IR-AML across development and external test cohorts, supporting individualized risk assessment and informing refinement of prognostic stratification.
Keywords
Introduction
Acute myeloid leukemia (AML) is a highly heterogeneous malignant hematological disorder, driven by various molecular mechanisms, including genetics and epigenetics alterations. These mechanisms regulate the aberrant expression and function of oncogenes and tumor suppressor genes, leading to the malignant clonal proliferation of hematopoietic stem cells.1,2 Despite recent advancements in chemotherapy, targeted therapies, and hematopoietic stem cell transplantation, nearly half of AML patients continue to experience treatment failure due to disease recurrence or toxicity, resulting in significant mortality. Additionally, the high cost of treatment imposes a substantial economic burden on patients, their families, and society.
AML exhibits considerable clinical heterogeneity and inter-patient variability. Traditionally, prognostic classification has relied on cytogenetic profiles, stratifying patients into low, intermediate, and high-risk groups to guide therapeutic decisions. However, clinical experience has shown that cytogenetics alone is insufficient for predicting prognosis, particularly for intermediate-risk AML (IR-AML), which accounts for approximately 60% of cases and is marked by significant heterogeneity. 3 This subgroup poses a unique clinical challenge, as the lack of clear prognostic stratification complicates treatment decisions. Thus, there is an urgent need for more precise stratification methods to identify high-risk patients early and inform personalized treatment strategies.4,5
With the development of science and technology, machine learning has emerged as a powerful tool in clinical medicine due to its capacity to analyze large datasets and uncover complex relationships between variables.6–8 In the context of leukemia, researchers have applied machine learning to refine diagnostic and prognostic subgroups, thereby advancing personalized treatment approaches.9,10 For instance, Yu et al. 11 utilized supervised tree classification models and logistic regression to assist in the diagnosis of AML-myelodysplasia related changes (MRC) , based on the mutational spectrum of 177 AML patients, establishing a clinically applicable risk scoring equation. Similarly, Eckardt et al. 12 employed nine machine learning models to predict complete remission and 2-year overall survival (OS), integrating clinical, laboratory, cytogenetic, and molecular data from 1383 AML patients receiving intensive induction therapy. Moreover, Park et al. 13 conducted unsupervised clustering of 279 elderly patients based on chromosomal abnormalities and gene mutations, identifying nine distinct clusters. Didi et al.14,15 developed an artificial intelligence-based prediction model using 52 diagnostic variables, which identified the most decisive factors for OS across different treatment regimens.
While these studies demonstrate the potential of machine learning in AML diagnosis and treatment, several limitations remain. Notably, the stratification of AML with intermediate-risk karyotypes has not been sufficiently addressed, and challenges such as small-sample sizes, uneven data distribution, and significant missing data often arise when the problem is further refined. Additionally, many current clinical prediction models lack interpretability, making it difficult to explain predictions and analyze the importance of specific features.
In this study, we aim to address the variability in clinical outcomes for patients with IR-AML using supervised machine learning methods, including random forests (RF), gradient-boosted decision trees (GBDT), and eXtreme Gradient Boosting (XGBoost). We combined data from Tsinghua Changgung Hospital with publicly available data from The Cancer Genome Atlas (TCGA) database to form a multicenter dataset. By incorporating basic clinical information such as age, gender, and gene mutation profiles, we sought to predict OS and use SHapley Additive exPlanations (SHAP) values to elucidate feature importance and enhance model interpretability. Ultimately, our goal is to refine prognostic stratification and improve clinical decision-making for this challenging subgroup.
Materials and methods
The methodology employed in this study for the preparation and preprocessing of data, the construction of related models, and their subsequent evaluation is illustrated in Figure 1.

Flowchart of the prognostic hierarchical model.
Data and preprocessing
This study is a retrospective study. The patient data used in this study consisted of 96 samples from patients with IR-AML, collected from September 2008 to September 2014 at Beijing Tsinghua Changgung Hospital. It was authorized by the Ethics Committee of Beijing Tsinghua Changgung Hospital with the approval document number (23326-0-01) and was processed according to the principles of the Declaration of Helsinki. An additional 200 samples were obtained from the AML dataset of the TCGA database (from 2001 to 2010) for further screening. All patients who participated in the study provided informed consent. This study was reported in accordance with the STROBE guideline.
Based on the European LeukemiaNet (ELN) -2022 16 and National Comprehensive Cancer Network (NCCN) genetic risk stratifications, we selected IR-AML as follows: we first excluded cases classified as favorable (t(8;21), inv(16)/t(16;16), NPM1-mutated with FLT3-ITD negativity, and CEBPA bZIP in-frame) and adverse (TP53 mutation, complex karyotype, −5/del(5q), −7/del(7q), inv(3)/t(3;3) [GATA2::MECOM], t(6;9) [DEK::NUP214], t(v;11q23.3) with KMT2A rearrangement, t(9;22) [BCR::ABL1], and myelodysplasia-related gene mutations). The remaining cases were defined as intermediate-risk karyotype AML; within these, FLT3-ITD-positive cases without adverse genetic features and NPM1-mutated cases with FLT3-ITD were assigned to the intermediate-risk group.
For the Tsinghua Changgung dataset, we excluded patients who were lost to follow-up, excluded samples with a follow-up time of less than 2 years and a status of survivor at the last follow-up, and excluded samples with missing basic clinical information and gene mutation information. This process yielded data for 56 cases. For the TCGA dataset, samples were excluded if they exhibited high-risk or low-risk karyotypes, were of unknown karyotype, lacked clinical and mutation information, had a follow-up time of less than 2 years and a status of survivor at the last follow-up, or exhibited M3 in the French–American–British (FAB) typing. Ultimately, data were obtained for 79 cases.
For patients’ OS, after combining with other literature17–22 and the experience of clinicians, 2 years were used as the dividing line to classify patients’ survival into two categories. We selected mutation types based on established mechanistic plausibility and reported prognostic/therapeutic relevance in AML,23–26 including NRAS, KRAS, FLT3, IDH1, IDH2, DNMT3A, NPM1, CEBPA, and TET2. After the above data processing, we numericalized all the information in the tables, including clinical features and genetic mutations.
We applied linear interpolation to handle missingness in continuous variables: within each patient's time series we used piecewise linear interpolation for interior gaps and last/next observation carry-forward at boundaries. Categorical/binary variables were not interpolated and were handled by mode category.
Machine learning models and model interpretation
In this study, three tree-based classifiers—RF, GBDT, and XGBoost—were developed on the Tsinghua Changgung Hospital cohort (development cohort). Internal validation used stratified five-fold cross-validation: in each fold, four-fifths of the data were used for training and one-fifth for validation. All preprocessing and hyperparameter tuning (random/grid search) were confined to the training portion of each fold to prevent information leakage. Internal performance was summarized as mean ± SD across folds for accuracy, precision, recall, F1 score, and Area Under the Receiver Operating Characteristic Curve (AUROC) . External validation was then conducted on the independent TCGA cohort with model settings fixed from internal development (no threshold tuning on the external test set).
RF integrates multiple decision trees through a Bagging strategy, while GBDT is an iterative algorithm that constructs a series of decision trees to minimize prediction error incrementally. XGBoost, an optimized version of GBDT, includes enhancements like loss function optimization and model regularization. Given the tabular nature of the data, these tree-based methods were selected27–29 and implemented using Python and the scikit-learn package.
To enhance model interpretability, the SHAP method was utilized to visualize feature importance. After calculating the SHAP values, a summary plot was generated to depict feature density, highlighting the contribution and distribution of each feature's impact on model predictions.
Results
Patient cohort
Kaplan–Meier survival analysis was performed using data of TCGA database and Tsinghua Changgung Hospital. As shown in Figure 2, cases with death events occurring within 2 years were assigned a value of 1.

Kaplan–Meier survival curves for the two cohorts.
Table 1 presents the basic characteristics of both datasets. In the TCGA dataset, the median age was 59, with 48 samples having a total survival time of 2 years or less. In contrast, the median age in the Tsinghua Changgung Hospital dataset was 42, with 24 patients also experiencing an OS of 2 years or less. Notably, the TCGA dataset had a higher proportion of patients who underwent transplantation, and differences in gene mutation incidence were observed between the two datasets.
Patient characteristics.

TCGA: The Cancer Genome Atlas.
Model performance
Supervised tree-based machine learning models, including RF, GBDT, and XGBoost, were employed to classify and predict IR-AML patients, using a 2-year OS threshold. The study aimed to assess whether basic patient information—such as age, gender, transplantation status, white blood cell (WBC) count, and nine gene mutations—could effectively predict prognosis. The model was trained on the Tsinghua Changgung Hospital dataset (Table 2). The external validation results using the TCGA cohort is presented in Table 3. The results indicate that the model yielded satisfactory predictive performance. Notably, the best outcomes were achieved using the GBDT classifier.
Results of the models using Tsinghua Changgung Hospital cohort.

CI: confidence interval; GBDT: gradient-boosted decision trees.
External validation results of the model using TCGA cohort.
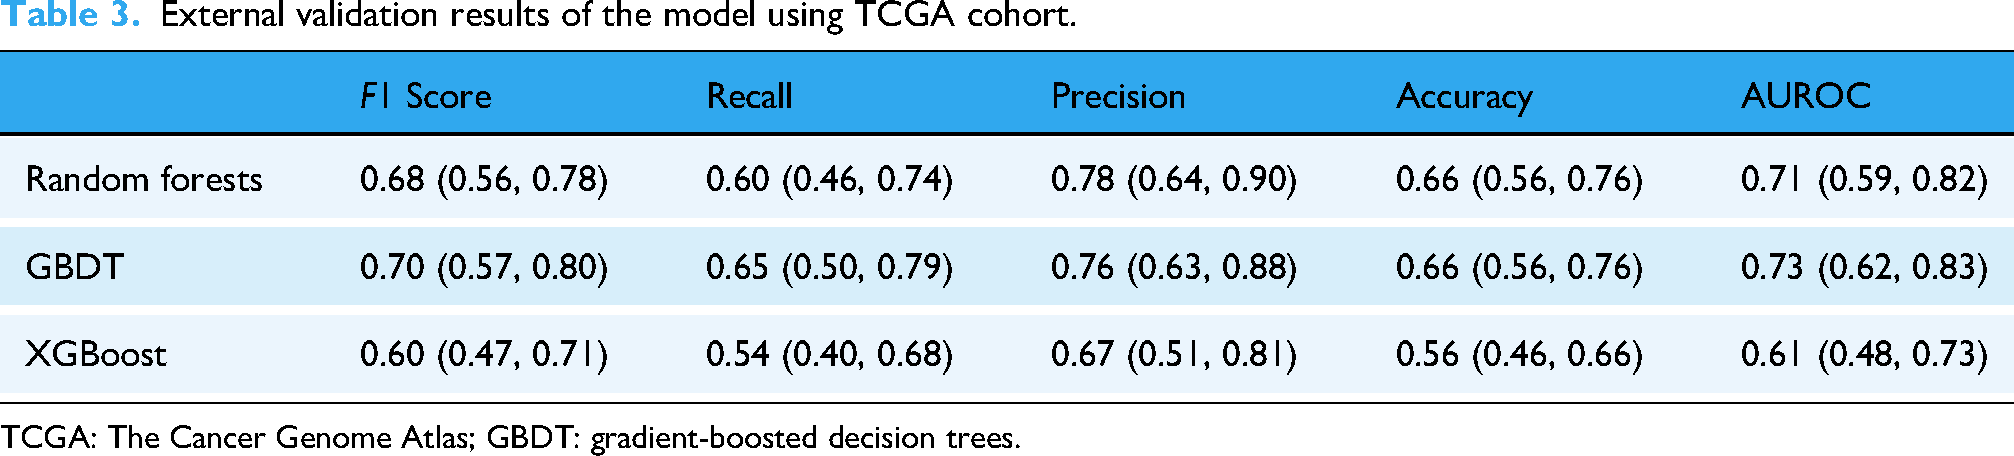
TCGA: The Cancer Genome Atlas; GBDT: gradient-boosted decision trees.
Receiver Operating Characteristic (ROC) analysis revealed AUROC values ranging from 0.61 to 0.98. Figure 3(a) illustrates the ROC curve for the Tsinghua Changgung external validation dataset, where RF exhibited superior AUROC values. Figure 3(b) presents the ROC curve for the TCGA external validation dataset, indicating that RF and GBDT achieved a great performance. Considering the results in Table 3, the AUROC value for RF is 0.71, while for GBDT, it is 0.73.
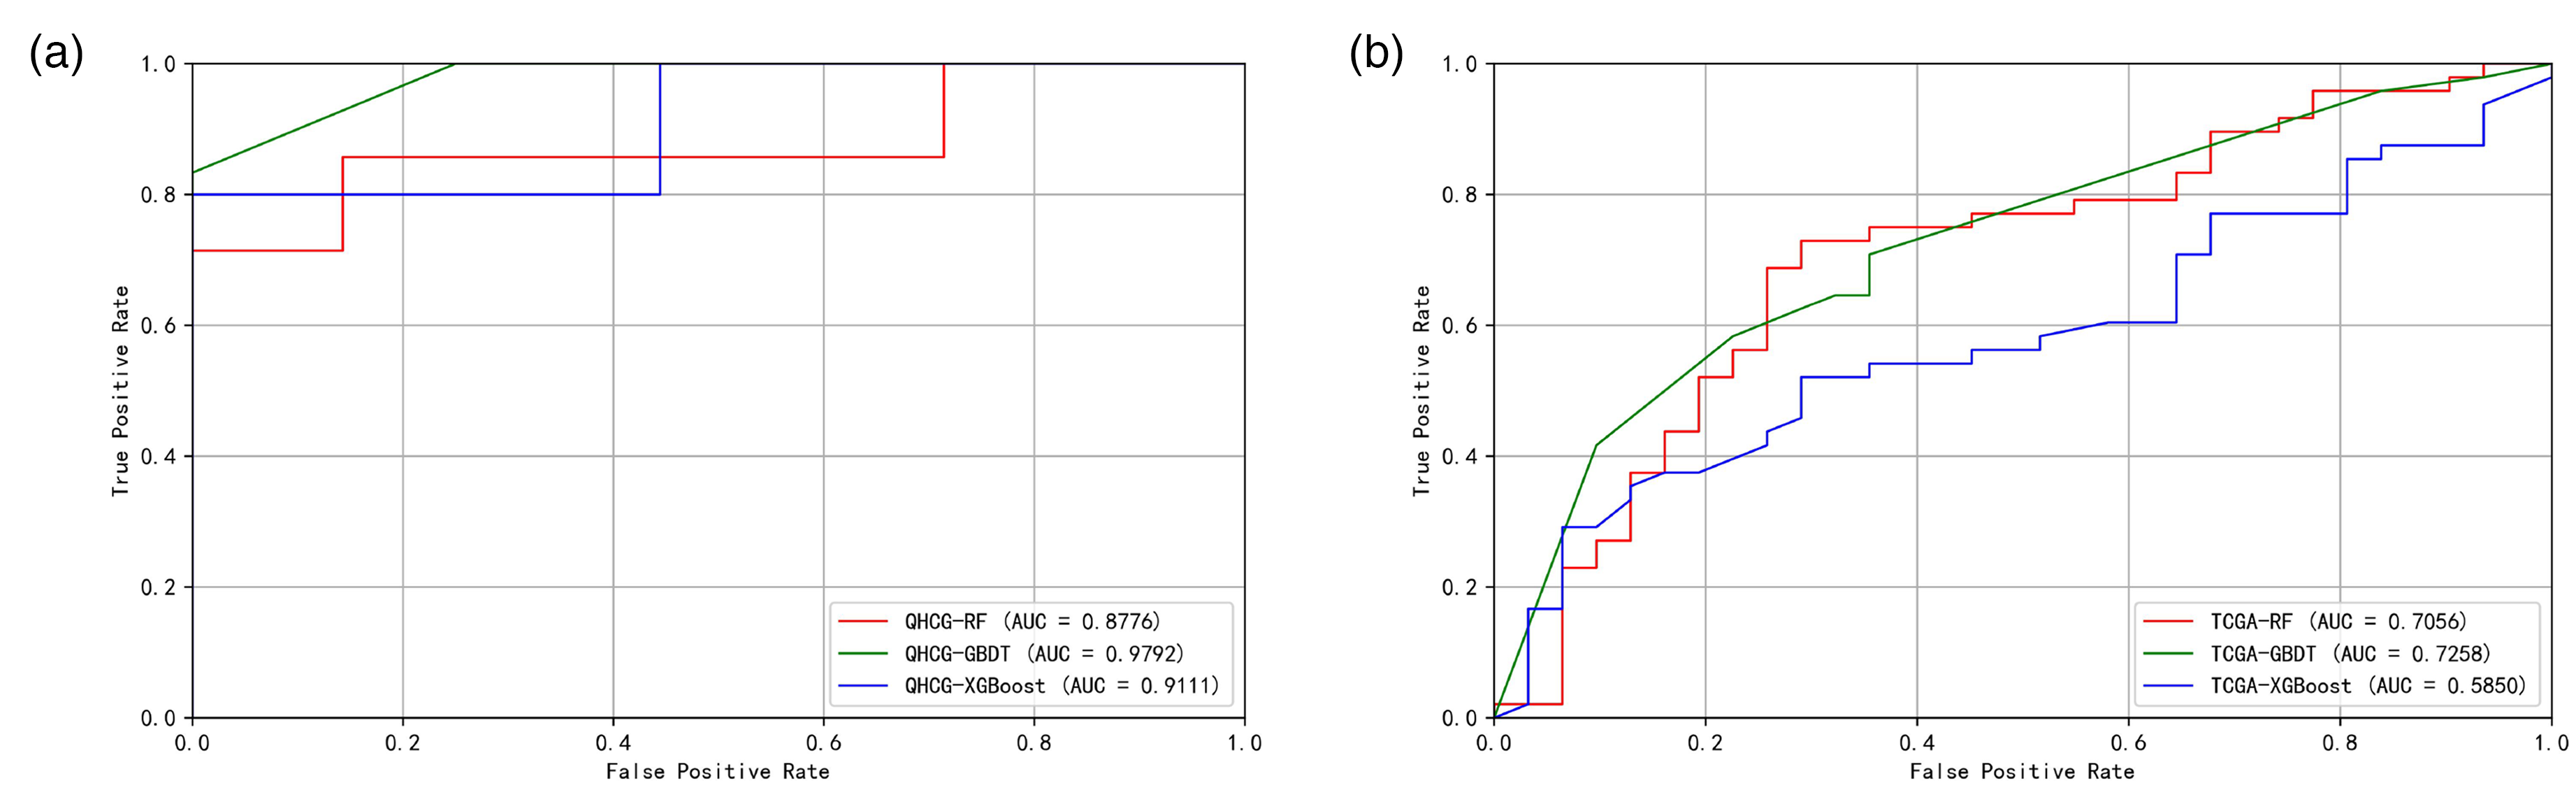
ROC performance in development and external validation: (a) ROC curves from stratified five-fold cross-validation in the development cohort and (b) ROC curves on the independent TCGA cohort. TCGA: The Cancer Genome Atlas.
Considering multiple performance metrics, including AUROC and accuracy, as well as the model's generalizability, the GBDT model demonstrated the best overall performance.
Model interpretation
SHAP analysis yielded the following insights. For cases with a survival time of 2 years or less, we assigned a class label of 1. A SHAP value greater than 0 indicates a positive contribution to this classification, pushing the predicted value closer to 1. Figure 4(a) shows the feature density scatter plot of the GBDT model tested using the external validation dataset of Tsinghua Changgung. Among them, WBC count, age, TET2 mutation, and transplantation situation had great influence on the prediction results. Positive transplant status corresponds to negative SHAP values, while advanced age and TET2 positivity correspond to positive SHAP values. High WBC feature values consistently have positive SHAP values, whereas low WBC feature values mostly have negative SHAP values, with a few exceptions showing positive SHAP values.

Scatter plot of feature density of GBDT model based on (a) Tsinghua Changgung dataset and (b) TCGA external validation dataset. GBDT: gradient-boosted decision trees; TCGA: The Cancer Genome Atlas.
Figure 4(b) displays the feature density scatter plot for the GBDT model tested using the external validation dataset of TCGA. Key features influencing the prediction results included WBC count, age, transplantation status, and TET2 mutation. The sign and distribution of its SHAP values are generally similar to those shown in Figure 4(a).
In summary, age, WBC count, transplantation status, and the mutations TET2 significantly affected the prediction outcomes. KRAS and IDH1 mutations also have a certain impact on the prediction results. In both test sets, some individuals in the TCGA cohort with higher WBC values exhibited negative SHAP values; overall, the results between the two validation datasets are quite similar.
Discussion
In this study, we utilized the age, gender, WBC count, transplantation status, and gene mutation information of AML patients with intermediate-risk karyotypes to develop models using machine learning techniques such as RF, GBDT, and XGBoost. Patients were categorized based on 2-year OS outcomes. To validate our findings, we established a multicenter dataset, allowing for an interpretable analysis of the results. This research further delineates the prognostic survival time of AML patients with intermediate-risk karyotypes, facilitating a prognostic re-stratification of AML. Prior AML prognostic models span a spectrum from genomics-intensive “knowledge-bank” frameworks with excellent discrimination but substantial data/model complexity, 30 limiting routine clinical deployment, to low-cost approaches leveraging routine laboratory/complete blood count (CBC) features that maximize accessibility but are less granular for survival risk in IR-AML. 31 Our approach aims for a pragmatic middle ground—using a limited gene panel plus basic clinical features with interpretable tree-based learners—to enhance feasibility while retaining clinically relevant signal.
We combined data from public databases with hospital records to enhance our dataset's size and created multicenter datasets to verify the model's generalizability. To address missing data, we employed linear interpolation for continuous variables and mode imputation for categorical/binary variables. Linear interpolation is well-suited for continuous clinical variables such as white blood cell count, as it leverages local temporal information to estimate missing values, minimizing bias in time-series data. For boundary missingness, last/next observation carry-forward was used, a standard approach in clinical studies given the stability of physiological parameters over short periods. Mode imputation was applied to categorical variables such as gene mutations to preserve their distributional properties, aligning with the known mutation frequencies in AML. These methods are widely adopted in medical research due to their simplicity and robustness, particularly in small-sample datasets.8,32 The strong performance of our models in both internal (AUROC 0.98 for GBDT) and external validation (AUROC 0.73 for GBDT) suggests that our imputation strategy did not introduce significant bias, supporting its appropriateness for this study.
By employing machine learning methods distinct from traditional statistical techniques commonly used in this field, we achieved more robust modeling results. Our study results indicate that all models performed well on the two datasets from different sources, with the GBDT model achieving the best performance, showing strong AUROC and F1 scores. This multicenter validation indicates that the model possesses good generalizability. Additionally, some mutation frequencies in the Tsinghua Changgung Hospital dataset differed slightly from those in the TCGA database, which may be attributed to inherent differences between the datasets.
Upon comparing the performance of the three machine learning methods across all datasets, we found that the GBDT model outperformed the others across all evaluation indicators. Our investigation revealed that in a binary classification task with small scale and pronounced class imbalance, GBDT often achieves higher AUROC and F1 than XGBoost and RF because its training dynamics better align with the bias-variance trade-off under these constraints. RF rely on bootstrap sampling and feature subsampling; with very few minority-class cases, many trees see little or none of the minority class, yielding high-variance leaf frequency estimates and unstable probability outputs. XGBoost further employs row/column subsampling and histogram-based split approximations; in such small, imbalanced datasets, the first- and second-order statistics that guide split selection are noisy, and regularization settings that curb overfitting can suppress splits informative for the minority class, while relaxing them tends to inflate variance. By contrast, GBDT fits shallow trees with a small learning rate and exact splits using all available data at each iteration, functioning as a strongly shrunk stage-wise additive model that lowers variance and ensures minority instances contribute in every boosting step. This typically produces smoother, better-calibrated probabilities and more stable global rankings, which directly translate into higher AUC and more reliable threshold selection for F1. SHAP feature importance analysis revealed that WBC count was the most significant factor influencing prognosis predictions. Specifically, higher WBC values are more likely to indicate poor prognosis, but low WBC values do not always correspond to longer survival; a small portion are still associated with shorter survival times. Additionally, older age was associated with worse prognosis and shorter OS. Patients who underwent transplantation generally have a better prognosis, while those without transplantation tend to have poorer outcomes. Positive mutations in TET2, KRAS, and IDH1 are associated with worse prognosis, whereas a positive NRAS mutation is linked to better prognosis. The relative impact of TET2 mutation versus transplantation on the prediction results shows slight differences between the two datasets.
In the independent TCGA cohort, discrimination remained acceptable for GBDT (AUROC 0.73), whereas XGBoost underperformed (AUROC 0.61), underscoring susceptibility to cohort shift and small-sample variability. Between-cohort differences in age distribution, transplantation rates, and mutation spectra likely contributed to this gap (Table 1).
Our study has certain limitations. First, the limited sample size reflects the low incidence of IR-AML and the requirement for ELN-2022/NCCN-aligned testing; moreover, TCGA is the only public dataset meeting all inclusion criteria. We mitigated bias via stratified five-fold cross-validation, strict leakage control, and external validation, and we explicitly discuss the impact on generalizability. We included transplantation status as a predictor despite being a postbaseline, time-dependent exposure. This choice may induce immortal-time bias and overstate the apparent benefit of transplantation; thus, our findings are prognostic rather than causal. Future analyses will use time-aligned (landmark) or time-varying approaches to mitigate this bias. Another limitation is the mutation frequency differences between hospital cohort and TCGA, which may cause covariate shift, mild calibration drift, and site-specific feature importance. In future work, we will pursue site-specific posthoc recalibration and threshold tuning on the target cohort, and multicenter harmonization adaptation to improve transportability.
Additionally, the follow-up process spanned several years, increasing the likelihood of missing values and censored data. The applicability of deep learning algorithms was also constrained by the sample size. Furthermore, we observed variations in the incidence of the same gene mutations between the two datasets, which may have impacted model training and prediction outcomes. In future research, it would be beneficial to incorporate data from more hospitals and public databases to enhance both sample size and quality. Therapeutic heterogeneity may have influenced model performance and should be carefully addressed in future studies. Additionally, a more nuanced classification of patient prognosis could be explored, such as stratifying into four categories based on 3-month, 1-year, and 2-year survival thresholds, along with investigating the application and comparison of deep learning methods. Our study used a 2-year OS cutoff as the primary endpoint. Although this time point is frequently adopted in AML research as a clinically meaningful surrogate for long-term outcomes, it remains a simplification that may not fully capture the heterogeneity of survival dynamics.
Conclusion
In conclusion, our study demonstrates that prognostic re-stratification of AML can be effectively achieved by utilizing information on age, gender, transplantation status, WBC count at diagnosis, and genetic mutations to better delineate 2-year OS in patients with IR-AML. Specifically, age, transplantation status, WBC count at diagnosis, and mutations in TET2 were closely associated with patient prognosis. These findings hold significant implications for the selection and adjustment of treatment regimens based on AML prognosis in current clinical practice and may serve as a valuable reference for developing a new prognostic risk stratification system for AML in the future.
Footnotes
Author note
A large language model (GPT4.5) was used solely for language editing; all content was reviewed by the authors, and the tool was not used for data analysis, results, or conclusions.
Ethics approval and consent to participate
This study was approved by the Ethics Committee of Beijing Tsinghua Changgung Hospital with the approval document number (23326-0-01) and was processed according to the principles of the Declaration of Helsinki.
Author contributions
BW and ZL drafted the manuscript and performed the machine learning models.
RN and YY conducted data curation.
CZ contributed to analytical methodology development.
HL conceived and designed the study, supervised the research, and revised the manuscript.
All authors have read and approved the final submitted manuscript.
Funding
The authors disclosed receipt of the following financial support for the research, authorship, and/or publication of this article: This work was supported by Beijing Natural Science Foundation (No. 7242264), the R&D Program of Beijing Municipal Education Commission (No. KM202310025020).
Declaration of conflicting interests
The authors declared no potential conflicts of interest with respect to the research, authorship, and/or publication of this article.
Data availability
The datasets analyzed during the current study are available from the corresponding author on reasonable request.