
Abstract
Objective
Advances in the collection of high-quality, continuous electrocardiography (ECG) data via wearable technology have the potential to transform heart rate (HR) measurement in daily life. This study aimed to characterize the impact of methodological criteria and behavioral context on estimates of resting heart rate (RHR) to guide recommendations for a standardized approach to measure daily life RHR.
Methods
Ten adults (9 female, 61 ± 12 years) wore a chest-mounted ECG device and wrist and ankle movement sensors continuously for 7–10 days. Following signal quality screening and beat-to-beat calculations, HR was analyzed using rolling averages of 15-, 30-, and 60-s windows within periods of device-detected sedentary behavior and sleep. ECG data during sedentary and sleep were compared for differences in: (1) RHR, (2) between-day consistency of daily RHR, and (3) HR median and range.
Results
During sedentary and sleep, respectively, there was no difference in RHR (56 ± 7 vs. 54 ± 7 bpm, p = 0.055) or in between-day consistency of RHR (coefficient of variation: 6 ± 3% vs. 5 ± 3%, p = 0.12; maximum between-day range of RHR=14 bpm). However, the median HR (71 ± 6 vs. 62 ± 7 bpm, p = 0.001) and HR range (35 ± 6 vs. 23 ± 7 bpm, p < 0.01) were significantly greater during sedentary versus sleep.
Conclusions
Behavioral context and method of analysis impact ECG-based HR measures at rest. This study recommends a novel wearable-based method for measuring daily life RHR that maximizes use of available data and confronts variability that exists with extended monitoring. Use of a standard method for measuring daily life RHR may advance the use of HR to inform clinical and/or personal health decisions.
Keywords
Introduction
Measures of cardiovascular function, including heart rate (HR), are critically important for evaluating sleep, stress, and heart health across a range of populations, as well as to guide physical activity prescription and monitoring.1–3 With the exception of the use of Holter systems for those with cardiac health concerns, monitoring of HR for the purposes of clinical decision-making is often restricted to supervised in-clinic measurements, including brief manual palpation or use of an automated blood pressure (BP) cuff to derive an average of multiple readings over short intervals (e.g., 30 s). 4 However, advances in accessible wearable technology (“wearables”), which can provide high-quality HR and movement data for extended periods of time, has the emerging potential to transform the ability to use HR to inform clinical and/or personal health decisions. While continuous HR monitoring over multiple days or weeks presents a unique opportunity to understand heart function, the large volume of data introduces complexities with respect to the method of analysis and how to interpret data spanning days or weeks.
As an important starting point, acquiring HR data over many days permits a reconsideration of the method of determining resting heart rate (RHR). RHR is associated with risk of poor cardiovascular-related outcomes and all-cause mortality across populations, independent of conventional cardiovascular risk factors.1,5–8 RHR has been thought to reflect an individual's resting metabolic rate 9 and is a necessary measurement to serve as a baseline for characterizing the magnitude of HR responses to various stimuli, such as physical activity. Despite well accepted guidelines for the measurement of other cardiovascular indices such as resting BP, 10 there is a lack of standardization and considerable variability among the criteria and approach used to measure RHR.1,3,11,12 Notably, many studies provide inadequate specificity about controlling or accounting for factors that are likely to influence HR, such as preceding (or on-going) behavioral state, co-existing medical conditions, participant posture, window length of recording, and tool or analysis approach used.3,13–15 In addition to a lack of transparency about the specific approach to measurement, 16 point-in-time, clinically derived RHR “snapshots” may not be ecologically valid, as they are subject to clinic-induced constraints or confounders (e.g., lack of time, white coat effect), and are characterized by low reproducibility. 17 The lack of a global standard and limitations associated with in-clinic RHR measurements makes it difficult to compare across studies, populations, or time points, and is problematic given the ongoing use of RHR as a tool for health risk stratification18,19 and/or reference point for prescribing activity intensity across research and clinical settings.20–22
Leveraging wearables to conduct continuous HR monitoring and profile HR in the context of free-living resting conditions (i.e., sleep and sedentary behavior) 23 is important for many reasons, including the opportunity to assess the circadian rhythmicity of HR. HR has been reported to drop during slow wave stages of sleep compared to awake values,6,24 and HR non-dipping (i.e., the absence of a reduction in HR during sleep) has been associated with increased risk of all-cause mortality. 25 HR measurements during sleep may also be less susceptible to the influence of external factors, such as movement or stress, compared to wakeful resting measures. 26 Providing behavioral context for interpreting HR has been possible through concurrent use of inertial measurement units (IMUs). For example, data from a limb-worn IMU has been used to differentiate sleep from wakeful states, 27 thus enabling further insight into HR change across day-night cycles. In addition to changes in HR during sleep, HR increases with increasing activity intensity 2 and remains elevated during recovery as a function of the activity intensity and duration. 28 IMUs worn on the wrist, hip, or thigh have commonly been used to stratify awake periods into activity intensity categories,29–33 including identification of sedentary behavior, which could be used as a window for assessing RHR. For example, one study assessed RHR in a free-living setting and identified sedentary periods based on wrist sensor-derived activity estimates that were < 1.5 metabolic equivalent tasks (METs). 12 Importantly, the ability to use wearables to appropriately capture behavioral context and movement characteristics, such as activity intensity, is dependent on numerous factors including number of sensors and wear location. Reliance on single wrist-sensor approaches may be inadequate for isolating sedentary behavior given evidence to suggest that wrist-derived estimates of activity intensity frequently misclassify periods of free-living walking as sedentary behavior in older adults and clinical cohorts. 34 The changes in HR during sleep and physical activity highlight the importance of specifying and standardizing whether RHR is measured during sleep or waking states, and if measured when awake, the value of limiting its measurement to robustly defined periods of sedentary behavior.
Studies that have used wearables to examine RHR in daily life have largely adopted single-device approaches using Holter-based electrocardiography (ECG) monitoring or photoplethysmography (PPG) technology.35–37 Although ECG is considered the gold standard for HR monitoring, traditional Holter monitors use multiple leads in a setup that may be burdensome to the wearer.38,39 Conversely, most PPG sensors that continuously measure pulsatile blood flow as a proxy measure of HR are embedded in wrist-worn sensors,40,41 which are accessible and low profile but suffer from compromised accuracy relative to outcomes derived from ECG during periods of physical activity due to a susceptibility to motion artifacts.35,42–44 Additionally, most previous work to assess daily life RHR has relied on commercial devices containing proprietary algorithms that lack transparent analyses and/or provided inadequate detail about how and when estimates of RHR were derived (e.g., Quer et al. 45 ), resulting in the adoption of varied criteria and methodologies. For example, Logan et al. 11 determined a free-living RHR estimate by calculating the mean HR from the lowest 60-s HR interval and all 60-s HR values within three beats per minute (bpm), based only on daytime measurement (i.e., no nighttime recordings), without restricting analyses to sedentary periods. In contrast, Johansen et al. 6 and Matsuura et al. 14 both anchored their RHR estimates to “assumed” sleeping periods based on overnight windows, but differed in the duration with which HR was averaged (i.e., 15 min vs. 10 h) and did not provide any information about the sampling frequency. Including details about the conditions and criteria used to calculate daily life RHR, such as the measurement window length, if measures are restricted to a specific resting condition, and the frequency of HR sampling, enables understanding about whether the RHR estimate is likely to reflect a minimum HR value or a summary value of average HR during an inactive state.
A multisensor approach using devices that provide access to raw sensor data may (1) overcome some of the data quality limitations of other wearable technologies, (2) decrease the likelihood of misclassifying resting behaviors (e.g., sedentary behavior), and (3) enable the development of novel, standardized, and transparent methods for profiling how HR varies during daily resting conditions and estimating minimum HR during rest. Specifically, wearing multiple limb-worn IMUs alongside a chest-worn ECG device permits robust, continuous, daily life HR data over extended wear periods to be connected to reliable movement data that can provide essential behavioral context for interpreting HR. 46 This wear paradigm has also been shown to be feasible and well-tolerated in a cohort of older adults and persons living with complex health conditions over the course of a week-long, continuous wear period. 47 However, there has been little work using this approach to examine free-living RHR. Thus, the overall goal of this study is to guide specific recommendations for a standardized RHR measurement approach from multisensor data collected during daily life, with focus on both the “how,” which refers to the statistical criterion and window length used to define RHR, and the “when,” in terms of the resting condition (i.e., sleep vs. sedentary) and duration (i.e., day vs. week). Firstly, this study aimed to characterize the impact of statistical criterion and measurement window length on RHR estimates. Secondly, this study aimed to determine if type of resting condition, specifically sedentary behavior versus sleep, impacted overall RHR estimates and the consistency of daily RHR estimates. It was hypothesized that overall RHR estimates would be greater during sedentary behavior compared to sleep and that the between-day consistency of daily RHR values would be lower during sedentary behavior compared to sleep. Thirdly, this study aimed to characterize the distribution of HR values during sedentary behavior and sleep in order to profile how the distribution of HR varies between free-living resting conditions. It was hypothesized that the range in HR and median HR values would be larger during sedentary behavior versus sleep. By identifying some of the factors that impact RHR estimates and profiling how HR varies during resting conditions in daily life, this study may help to expand conventional thinking and guide specific recommendations for measuring daily life RHR in future studies using wearables. The work will also highlight the importance of ensuring daily life HR is referenced to a given behavioral context.
Methods
Participants
Participants were enrolled in the Health in Aging, Neurodegenerative Diseases and Dementias in Ontario (HANDDS-ONT) study, which was a fully remote, prospective, observational study conducted as part of the Ontario Neurodegenerative Disease Research Initiative (ONDRI) from August 2021 to April 2023. 48 Individuals were included in the present study if they were part of the HANDDS-ONT control cohort, who also did not self-report any cardiovascular, endocrine, or metabolic disease. These additional inclusion criteria were applied to restrict initial HR analyses to a carefully selected convenience sample of relatively “healthy” adults, who were free from comorbidities and/or diseases that are known to impact the cardiovascular and/or autonomic nervous system. Additionally, estimates of RHR for each participant were generated from an average of approximately 500,000 data epochs, providing a robust and highly stable basis for calculating individual-level metrics. The HANDDS-ONT study was approved by Clinical Trials Ontario (Project ID: 3589) with Sunnybrook Research Institute in Toronto, Ontario as the Board of Record (REB approval: 2021-1517), and, due to the fully remote nature of the study, all participants provided verbal informed consent prior to study initiation. The REB-approved protocol for obtaining consent involved a virtual visit in which the research coordinator reviewed the informed consent document with the potential participant prior to obtaining consent, which was documented as a verbal attestation.
Procedures
Participants received a kit in the mail that contained three wearable devices, instruction cards, and paper logs. Participants then attended a virtual baseline visit with a research coordinator, where they were oriented to the study package and assisted with wearable device instrumentation, before completing a detailed health history. All devices were data logging and required minimal interaction (i.e., no charging or manual participant data entry required). Participants were instructed to wear devices on the chest, and on the dominant (or least impaired) wrist and ankle (Figure 1), for up to 10 days continuously, except for bathing or swimming. Participants were encouraged to go about their usual activities while wearing the devices. A research coordinator conducted a virtual check-in visit on the third or fourth day of sensor wear, and then a discharge visit at the end of the collection period to assist with sensor removal and return of the study package. Once the study team received back the study kit in the mail, data was offloaded from the devices, before being processed and analyzed.
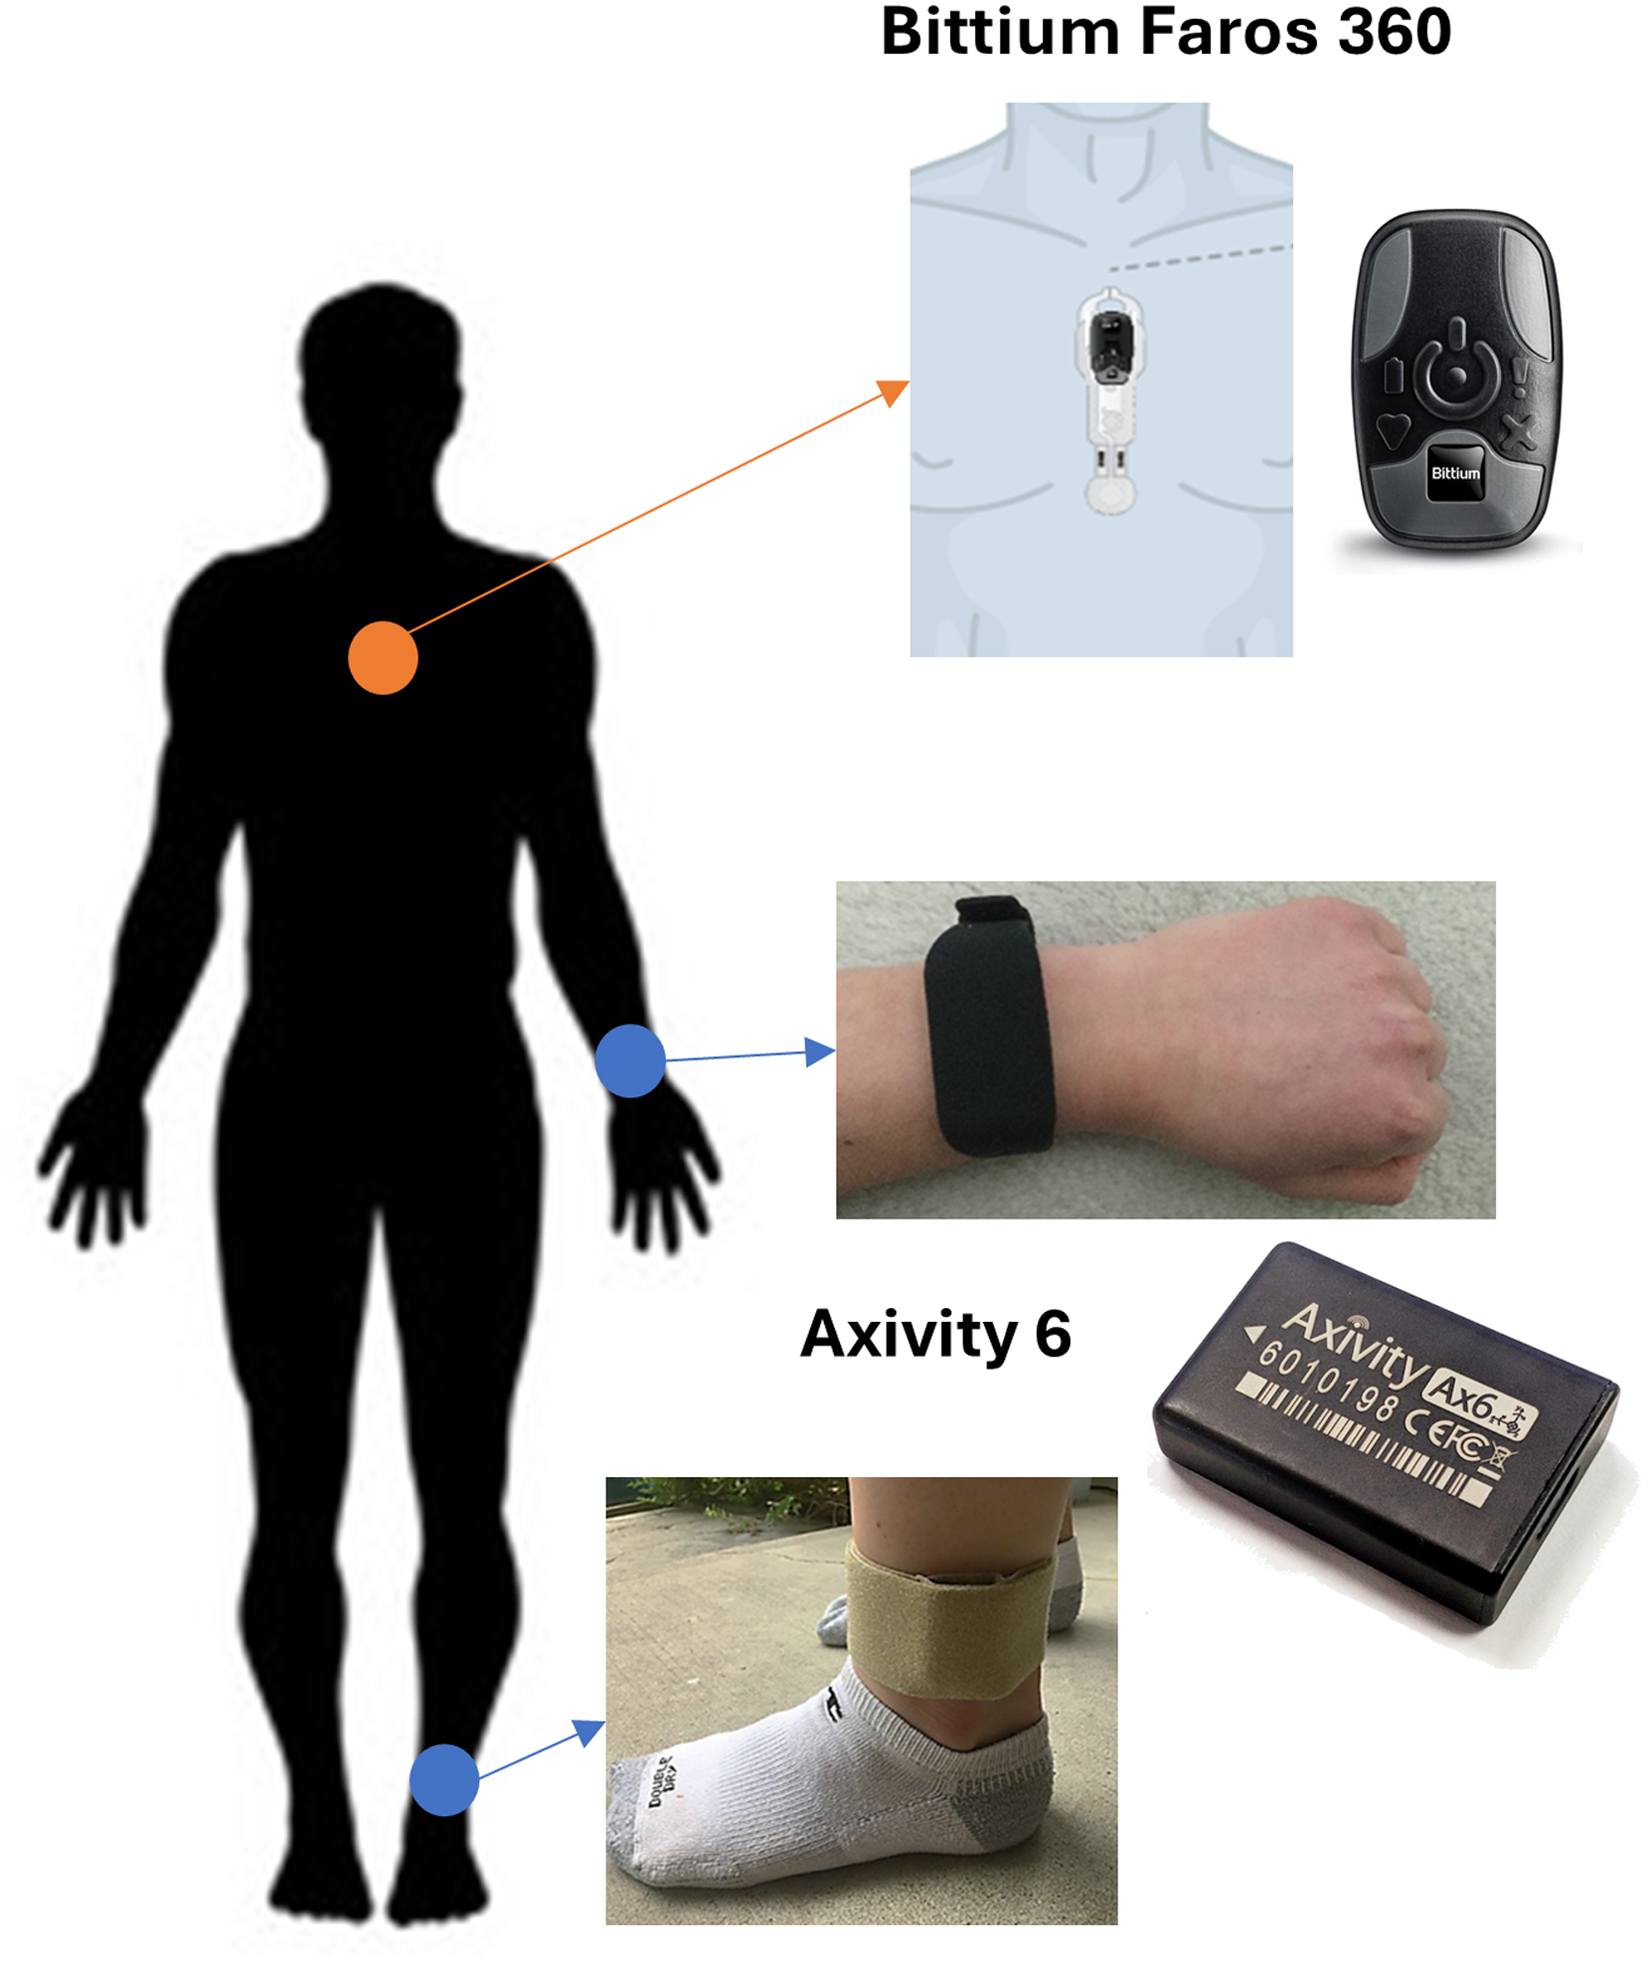
Participant set up with devices. Schematic representation of wearable device type and location on body segments, including Bittium Faros 360 device on chest and Axivity 6 devices on wrist and ankle.
Data collection
Demographic and clinical measures
During the virtual baseline visit, participants self-reported demographic information and health history, including current and past medical conditions and medications. All demographic and clinical information was collected and stored using REDCap49,50 electronic case report forms and hosted on Brain-CODE. 51
Wearables data collection
Limb-worn IMUs were Axivity 6 devices (AX6, Axivity Ltd) and contained a tri-axial accelerometer and gyroscope, as well as a temperature and light sensor. Accelerometer and gyroscope data were collected at a sampling frequency of 50 Hz. AX6 devices were worn on the wrist using a rubber watch strap and just proximal to either the medial or lateral malleolus, as selected by the participant, using a customized medical-grade wrap (Fabrifoam, PA). The chest device was a Bittium Faros 360 ECG unit (Bittium, Finland), which also contained a tri-axial accelerometer, and has been used as a reference standard for HR in free-living conditions.35,52 Bittium Faros devices were affixed to the chest using a 2-lead OmegaSnap electrode adhesive, which was waterproof and did not require removal for bathing or swimming. ECG data were sampled at a frequency of 250 Hz, while the accelerometer sampled at a frequency of 25 Hz. All devices provided access to raw unprocessed data and underwent a simultaneous manual synchronization procedure at the start, during the check-in visit, and at the end of the collection period. This involved placing the devices in their shipping container and flipping the container periodically for approximately ten seconds. The task produced a standard waveform across all devices, which could be used to temporally align signals during data processing. Once collection finished and devices were returned to the study team, sensor data was offloaded to a secure network drive and processed using a customized analytics pipeline ( 46 ; https://github.com/nimbal/nimbalwear) and additional custom analytics implemented in Python (Version 3.12), as described below.
Data processing and analysis
IMU data
Once offloaded, IMU data was converted to a standardized European Data Format (EDF), before resampled to a constant sample rate and temporally synchronized across devices, including the concurrently collected accelerometer sensor on the chest-worn ECG device. During stationary periods, accelerometer calibration was evaluated using gravity as a constant, known acceleration value, and corrected as necessary. 53 The customized analytics pipeline 46 was then run to remove periods of device nonwear 54 and to detect the following behaviors: stepping from the ankle,55,56 sleep from the wrist,27,57 and activity intensity estimates from the wrist using age-based cut-points that differentiate between sedentary, light, and moderate-vigorous intensity.58,59 Specifically, cut-points were applied to participant data as follows: those < 60 years 59 and those ≥ 60 years. 58 To classify sedentary behavior, periods of time when intensity was coded as sedentary by the wrist were isolated and then any periods with overlapping ankle-derived stepping were removed.
ECG data
Raw ECG data underwent signal quality screening to restrict analyses to data with a high signal-to-noise ratio that permitted beat-to-beat HR analysis. 60 R-peaks were detected from the ECG data using the NeuroKit peak detection algorithm (NeuroKit2) and beat-to-beat HR was calculated. 61 The continuous beat-to-beat HR data was resampled using a 1 Hz interpolation, and a low pass filter (0.1 Hz) was applied. The interpolated heartbeat data was used and was also averaged using rolling averages of 15-, 30-, and 60-s window lengths.
HR analyses for objective 1: Establishing statistical criterion and window length for measuring RHR
Full calendar days were included if the chest device was worn for at least 20 h and if the wrist device was worn for at least 10 h during waking hours, consistent with studies of physical activity.34,62 A minimum of seven usable days (could be non-consecutive) were required for a participants’ data to be included in the analysis. To determine a statistical criterion for defining free-living RHR, independent of behavioral context, interpolated beat-to-beat HR values during included days across the entire collection were plotted in a histogram for each participant. The statistical criterion derived from the distributions to identify an RHR estimate initially included minimum, first, fifth, and tenth percentile HR values. A threshold was set at 30 bpm based on physiologically possible HR values,63,64 and the per-participant minimum and first percentile HR values were compared to this threshold to identify the proportion of HR values that were ≤ 30 bpm (i.e., non-physiological values). This approach was taken to exclude statistical criteria that resulted in unrealistic HR values. Next, first, fifth, and tenth percentile HR values were compared. The statistical criterion that identified the lowest possible physiologically probable HR values across participants was carried forward into subsequent analyses when defining RHR. To determine the impact of conventional measurement window lengths on RHR estimates, rolling average HR values of 15, 30, and 60 s were calculated during included days across the entire collection, and RHR was calculated for each window length based on the statistical criterion identified above.
HR analyses for objective 2: Examining differences in RHR between resting conditions
To examine the impact of resting condition on RHR, RHR was calculated for both sedentary and sleep periods. First, only sedentary periods of a minimum five-minute duration were included to identify windows where participants were likely to be at rest and based on work to suggest HR stabilization post-activity after a minimum of four minutes duration. 12 Next, all sedentary periods (≥ 5 min) and sleep periods with usable HR data during included days were identified. The criteria established in Objective 1 were then applied to identify an “overall sedentary RHR” and “overall sleep RHR” estimate per participant. Next, sedentary periods were grouped based on each day of collection, from midnight to midnight. Sleep periods were grouped based on examining days from noon to noon, and noon-to-noon segments were included if the wrist device was worn for at least 11 h during the corresponding overnight period from 8:00 pm to 8:00 am. This allowed for estimation of a “daily sedentary RHR” and a “daily sleep RHR” per day for each participant, by pooling all of the HR values across sedentary periods within a day and across sleep periods within a day, before applying the criteria for RHR established in Objective 1 to these pooled HR values. Once estimates of daily sedentary RHR and daily sleep RHR were calculated for each participant, within-participant variability in daily RHR estimates was assessed via calculation of a between-day standard deviation, range, and coefficient of variation (CV) for each participant, as well as the lowest daily RHR (minimum) and highest daily RHR (maximum) estimate.
HR analyses for objective 3: Characterizing the distribution of HR values during resting conditions
To characterize the distribution and profile the variation in HR during resting conditions, HR range values (defined as 99th minus 1st percentile values) and median HR values were calculated from the same distributions of data generated in Objective 2 (as described above), where HR data was pooled across the collection per participant during (1) all included sedentary periods and (2) all sleep periods. These outcomes are referred to as “overall sedentary HR range,” “overall sedentary median,” “overall sleep HR range,” and “overall sleep median”.
Statistical analyses
Demographic and clinical data were summarized using descriptive statistics. Shapiro-Wilk tests were run to test for normality of each dataset included in the statistical analyses.
In terms of objective 1, to confront the impact of window length on RHR estimates, a one-way repeated measures analysis of variance (ANOVA) was conducted to assess the difference between RHR estimates derived from 15, 30, and 60-s rolling average HR window lengths. If significant, pairwise comparisons (linear contrasts) were conducted with Bonferroni-corrected p values based on number of planned comparisons. Additionally, absolute (bpm) differences in RHR estimates derived from each of the rolling average HR window lengths were assessed to determine clinical meaningfulness of any differences. In terms of objective 2, a one-way paired samples t-test was used to test for differences between per-participant overall sedentary RHR and overall sleep RHR values. To determine if differences in between-day consistency existed depending on resting condition, a one-way paired samples t-test was used to compare the within-participant CV of daily sedentary RHR and daily sleep RHR. Descriptive statistics were run on between-day standard deviation, range, mean, minimum and maximum of daily RHR values for each participant. Intraclass correlation coefficients (ICC) with 95% confidence intervals were also calculated (ICC (2, 1), absolute agreement) 65 to assess the day-to-day variation in the RHR estimate for sedentary behavior and sleep. In terms of objective 3, two one-way paired samples t-tests were used to test for differences between (1) overall sedentary and overall sleep HR range values and (2) overall sedentary and overall sleep median HR values.
All statistical analyses were conducted in Pingouin (Python, Version 3.12) 66 and statistical significance was set at α < 0.05. Data are presented as mean ± SD (range) unless otherwise noted.
Results
Participant characteristics
A total of 10 adults met the study-specific inclusion criteria. The mean age was 61 ± 12 years and 90% of participants were female. Two participants self-reported taking prescribed medication for anxiety and depression (one on selective serotonin reuptake inhibitor (SSRI) daily and another on daily SSRI and bupropion and benzodiazepine as needed), whereas the remaining eight participants reported taking no medication. Table 1 summarizes demographic and behavioral characteristics of the participants. In terms of compliance, daily wear times averaged 98.7 ± 0.47% (97.9–99.4) for the chest device, 98.2 ± 0.96% (97.0–99.3) for the wrist device, and 99.2 ± 0.27% (98.8–99.6) for the ankle device (Table 1). The amount of time wearing the devices did not differ across days for any of the devices (all p values > 0.05). Usable HR data, defined as HR data that passed the signal quality screening (i.e., adequate signal-to-noise to reliably extract HR), was available during 87.9 ± 9.8% of the time spent wearing the chest device. Of this time, 90.1 ± 9.8% of the time spent sedentary and 97.4 ± 1.8% of the time spent sleeping contained usable HR data.
Participant characteristics.

Data are presented as grand mean ± standard deviation unless otherwise noted.
Remaining 20% of participants responded as “Don’t know.”
Objective 1—Establishing criteria and window length for measuring RHR
The frequency distributions of interpolated beat-to-beat HR values measured across the entire collection period, independent of behavioral context, are displayed for each participant in Figure 2. Minimum HR values were ≤ 30 bpm for 40% of participants (n = 4), whereas first percentile HR values were ≤ 30 bpm for all participants (Figure 2). Across participants, the first, fifth, and tenth percentile HR values were 52 ± 6 (43-63), 56 ± 6 (46-66), and 58 ± 6 (47–68) bpm, respectively (Figure 2). The difference between first and fifth percentile values and first and tenth percentile values were 3 ± 1 (2–5) bpm and 5 ± 1 (3–8) bpm, respectively. Given the desire to select a physiologically possible value that is not overly conservative, the first percentile value was adopted as the criterion for estimating the RHR for all subsequent analyses.
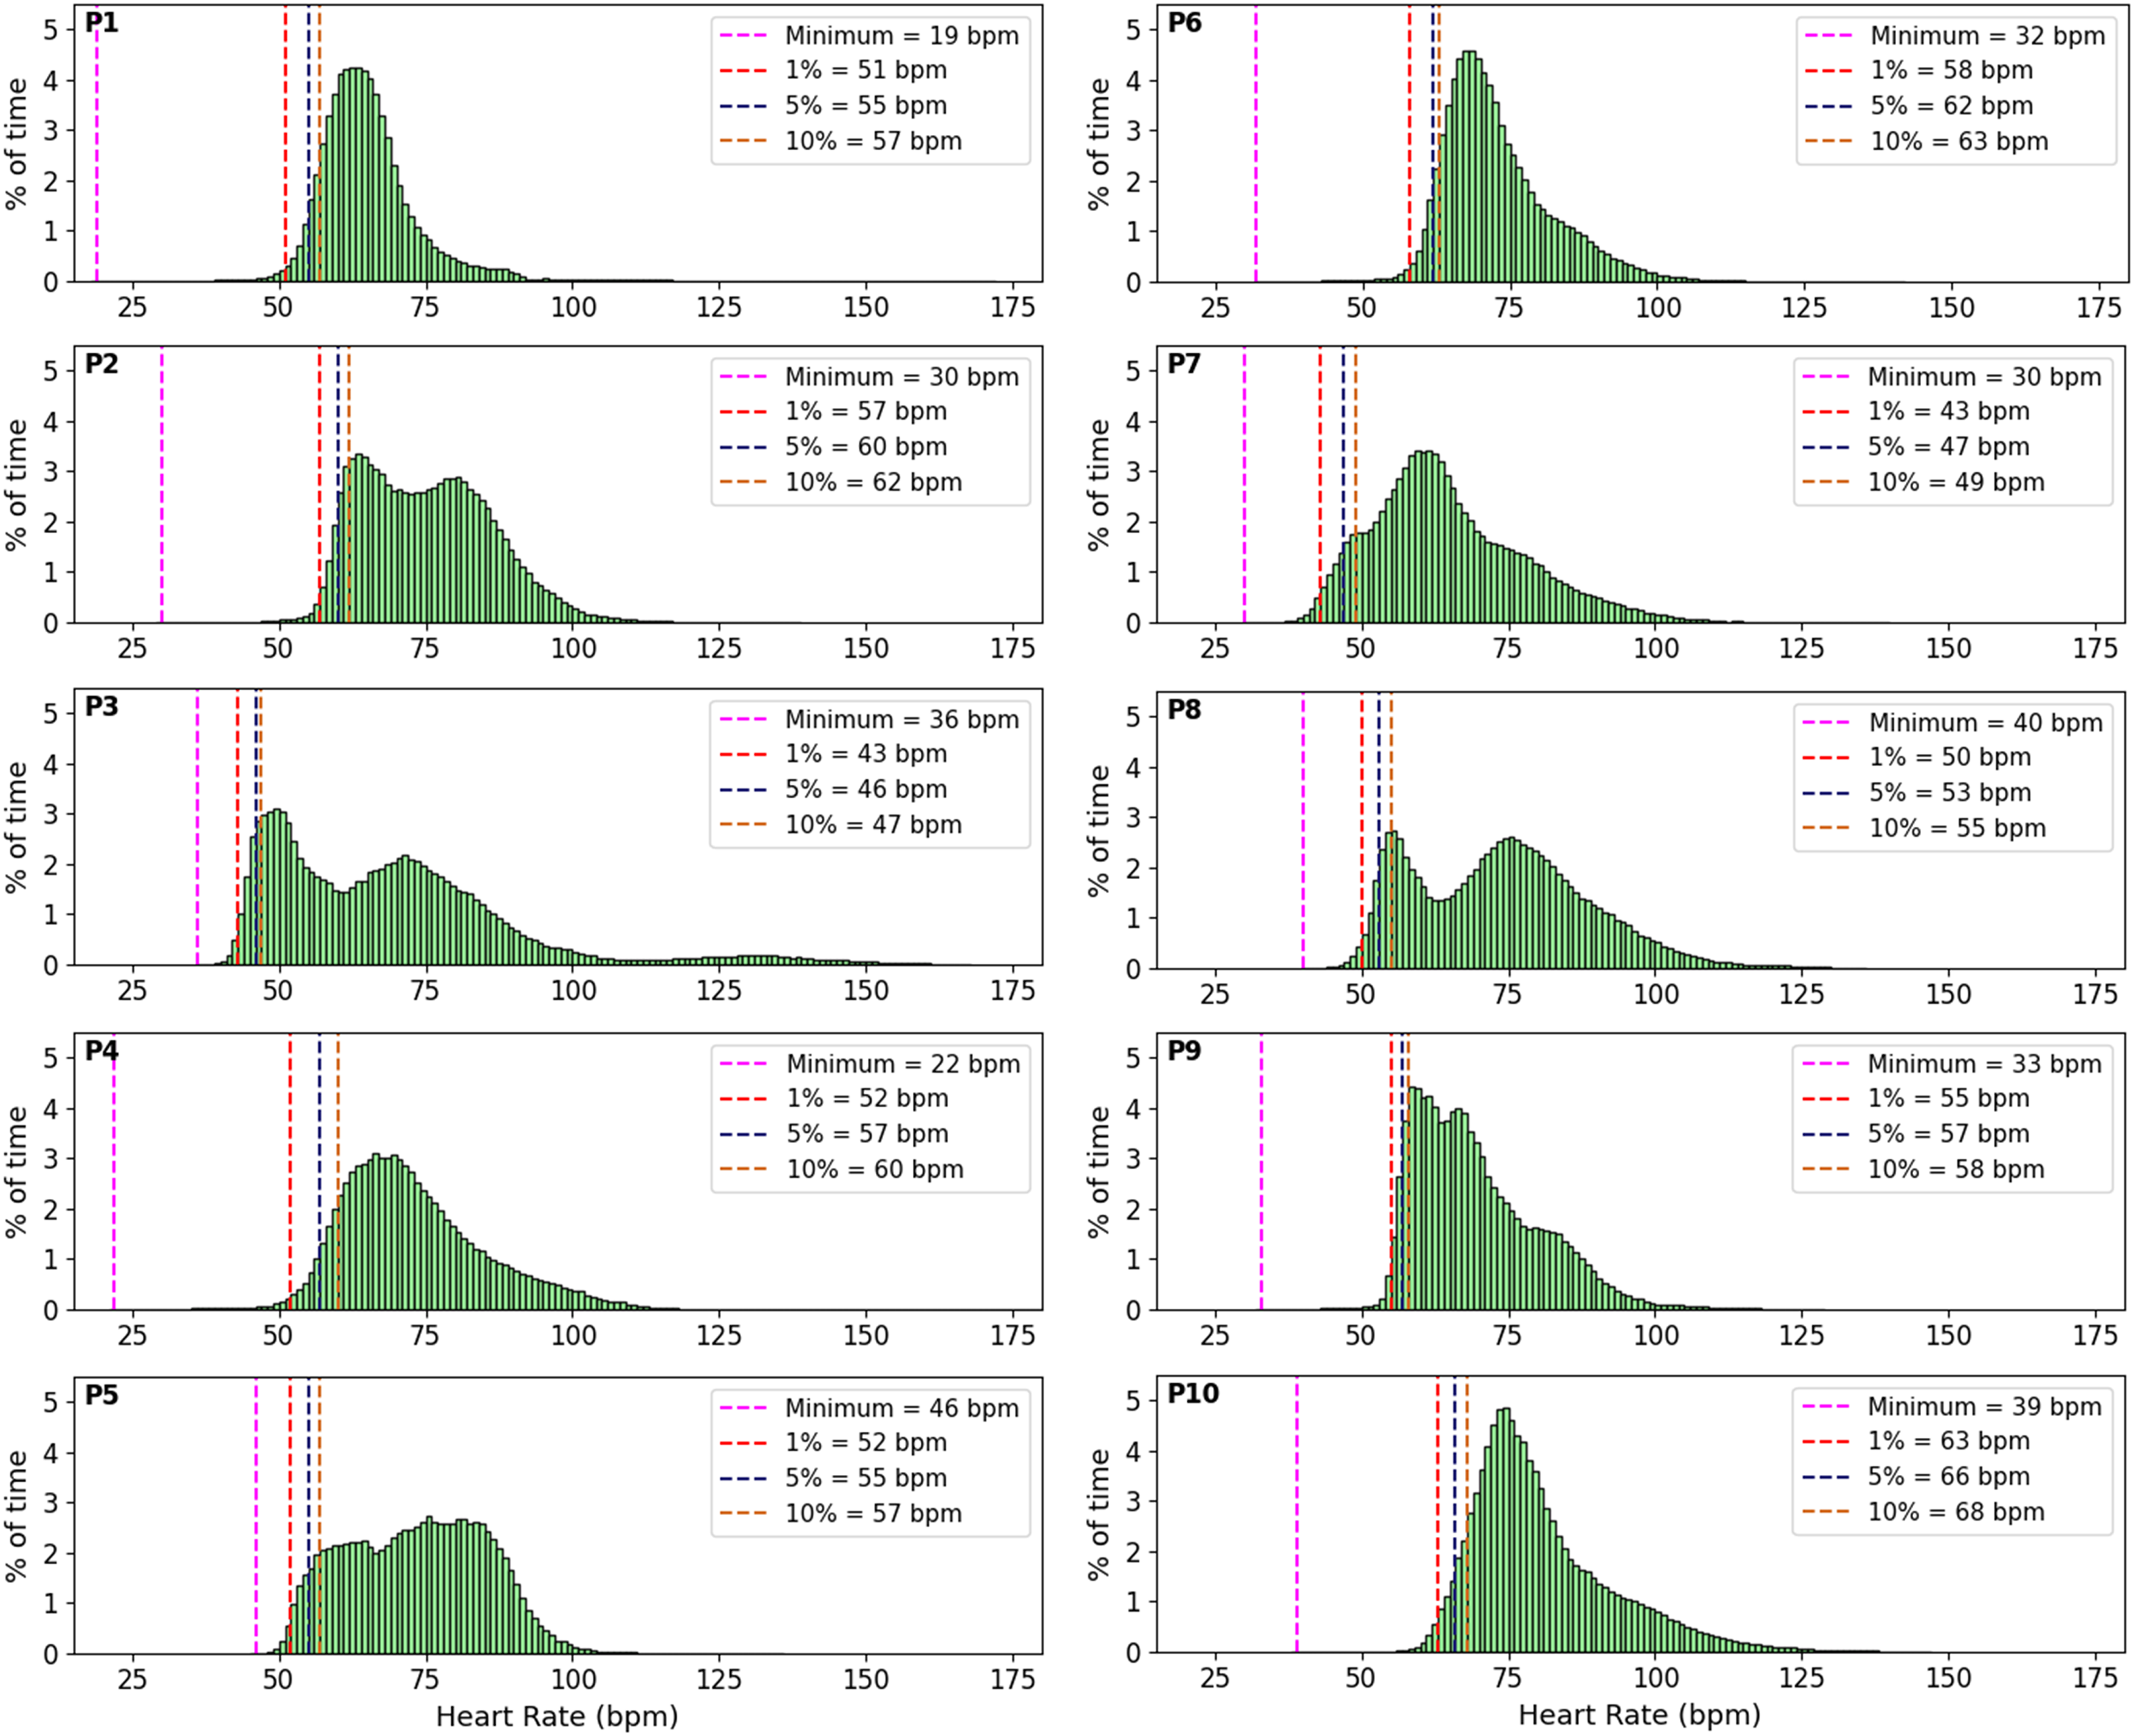
Distribution of beat-to-beat HR values across the entire collection period for each participant (n = 10). Each plot is annotated with four lines that represent the minimum (purple), first (red), fifth (blue), and tenth (orange) percentile HR values for each participant. Given that 40% of participants had minimum HR values ≤ 30 bpm, first percentile HR values were adopted as the criterion for estimating RHR in subsequent analyses. HR: heart rate; RHR: resting heart rate.
The frequency distributions of 15-,30-, and 60-s rolling average HR values measured across the entire collection period are displayed for two sample participants in Figure 3. The one-way repeated measures ANOVA that was conducted to assess the difference between RHR estimates (i.e., first percentile values) derived from 15, 30, and 60-s rolling average HR window lengths was statistically significant (F (2, 18) = 6.8, e = 0.92, p = 0.007, n2 = 0.002). Contrast tests revealed that the RHR estimate derived from the distribution of 60-s rolling average HR values (54.2 ± 6.3 bpm, mean ± SD) was significantly higher than the RHR estimates derived from the 15- and 30-s rolling average HR window length distributions (53.5 ± 6.3 and 53.7 ± 6.4 bpm, respectively, p < 0.05 after Bonferroni correction applied). However, the lack of clinically meaningful difference when comparing the absolute RHR values derived from 15, 30, and 60-s window lengths (i.e., < 1 bpm difference) suggests that choosing any of the rolling average HR window lengths is likely to result in comparable RHR estimates. Given that a 30-s measurement duration is feasible and commonly used when measuring RHR clinically, all subsequent analyses adopted a 30-s rolling average window length for assessing RHR and characterizing the HR distribution.

Comparison of RHR estimates derived from 15-, 30-, and 60-s rolling average HR window lengths across the entire collection for two sample participants. Each column (A, B) represents an individual participant, each row represents a window length (15-, 30-, and 60-s), and the red dotted line on each plot denotes the RHR estimate. HR: heart rate; RHR: resting heart rate.
Objective 2—Examining differences in RHR estimates based on resting condition
The distribution of 30-s rolling HR values within all included sedentary periods and sleep periods across the full collection are displayed for a representative participant in Figure 4A. When assessed across participants, the RHR estimate during sedentary (overall sedentary RHR) was not significantly different than the RHR estimate during sleep (overall sleep RHR) (56 ± 7 vs. 54 ± 7 bpm, respectively) (t = 1.78, df = 9, p = 0.055, d = 0.36) (Figure 4B).

Comparison of RHR estimates between sedentary behavior and sleep when HR data is pooled across the collection period per resting condition. Panel A displays the distribution of 30-s rolling HR values during sedentary (top, gray) and sleep (bottom, blue) periods across the collection, with a red line denoting overall sedentary RHR (top) and overall sleep RHR (bottom) for a representative participant. Panel B is a box and whisker plot showing the distribution of individual RHR estimates for sleep and sedentary conditions. The horizontal line within the box corresponds to the median value. RHR during sleep was not significantly different than during sedentary (p = 0.055). Connector lines are used in panel B to denote individual participants across resting conditions (n = 10). HR: heart rate; RHR: resting heart rate.
The distribution of 30-s rolling HR values during all sedentary periods and all sleep periods within each day of collection are displayed, and daily sedentary RHR and daily sleep RHR are denoted, for two sample participants in Figure 5.

Comparison of daily RHR estimates during sedentary behavior and sleep for two sample participants. Panel A shows data from one participant and panel B shows data from a different participant. Within each panel, the left column displays the distribution of 30-s rolling HR values during all sedentary behavior per day (gray) and the right column displays the distribution of 30-s rolling HR values during all sleep per day (blue). The red dotted lines denote daily RHR estimates for sedentary behavior (daily sedentary RHR) and sleep (daily sleep RHR). HR: heart rate; RHR: resting heart rate.
In terms of consistency of daily RHR estimates, there was no significant difference in the between-day CV of daily RHR when comparing sedentary and sleep (6 ± 3% vs. 5 ± 3%, respectively) (t = 1.28, df = 8, p = 0.12, d = 0.24). However, across participants, the between-day range of daily RHR spanned from 4 to 14 bpm for sedentary behavior and from 3 to 14 bpm for sleep (Table 2). The ICC was 0.75 (95% CI: 0.53–0.92) for sedentary behavior and 0.82 (95% CI: 0.63–0.95) for sleep (both p < 0.01). Table 2 includes additional descriptive statistics that summarize the between-day consistency in daily RHR per participant during sedentary and sleep.
Between-day variability of daily RHR estimates during sedentary behavior and sleep.

RHR: resting heart rate; BPM: beats per minute; SD: standard deviation.
Note: A single participant (#6) was removed from analysis of between-day variability of RHR estimates because only 4 nights of sleep met criteria for inclusion in day-to-day sleep analysis.
Objective 3—Characterizing the distribution of HR during resting conditions
For each participant, median and HR range values (1st to 99th percentile) derived from 30-s rolling HR data pooled across the entire collection per resting condition are shown in Figure 6.
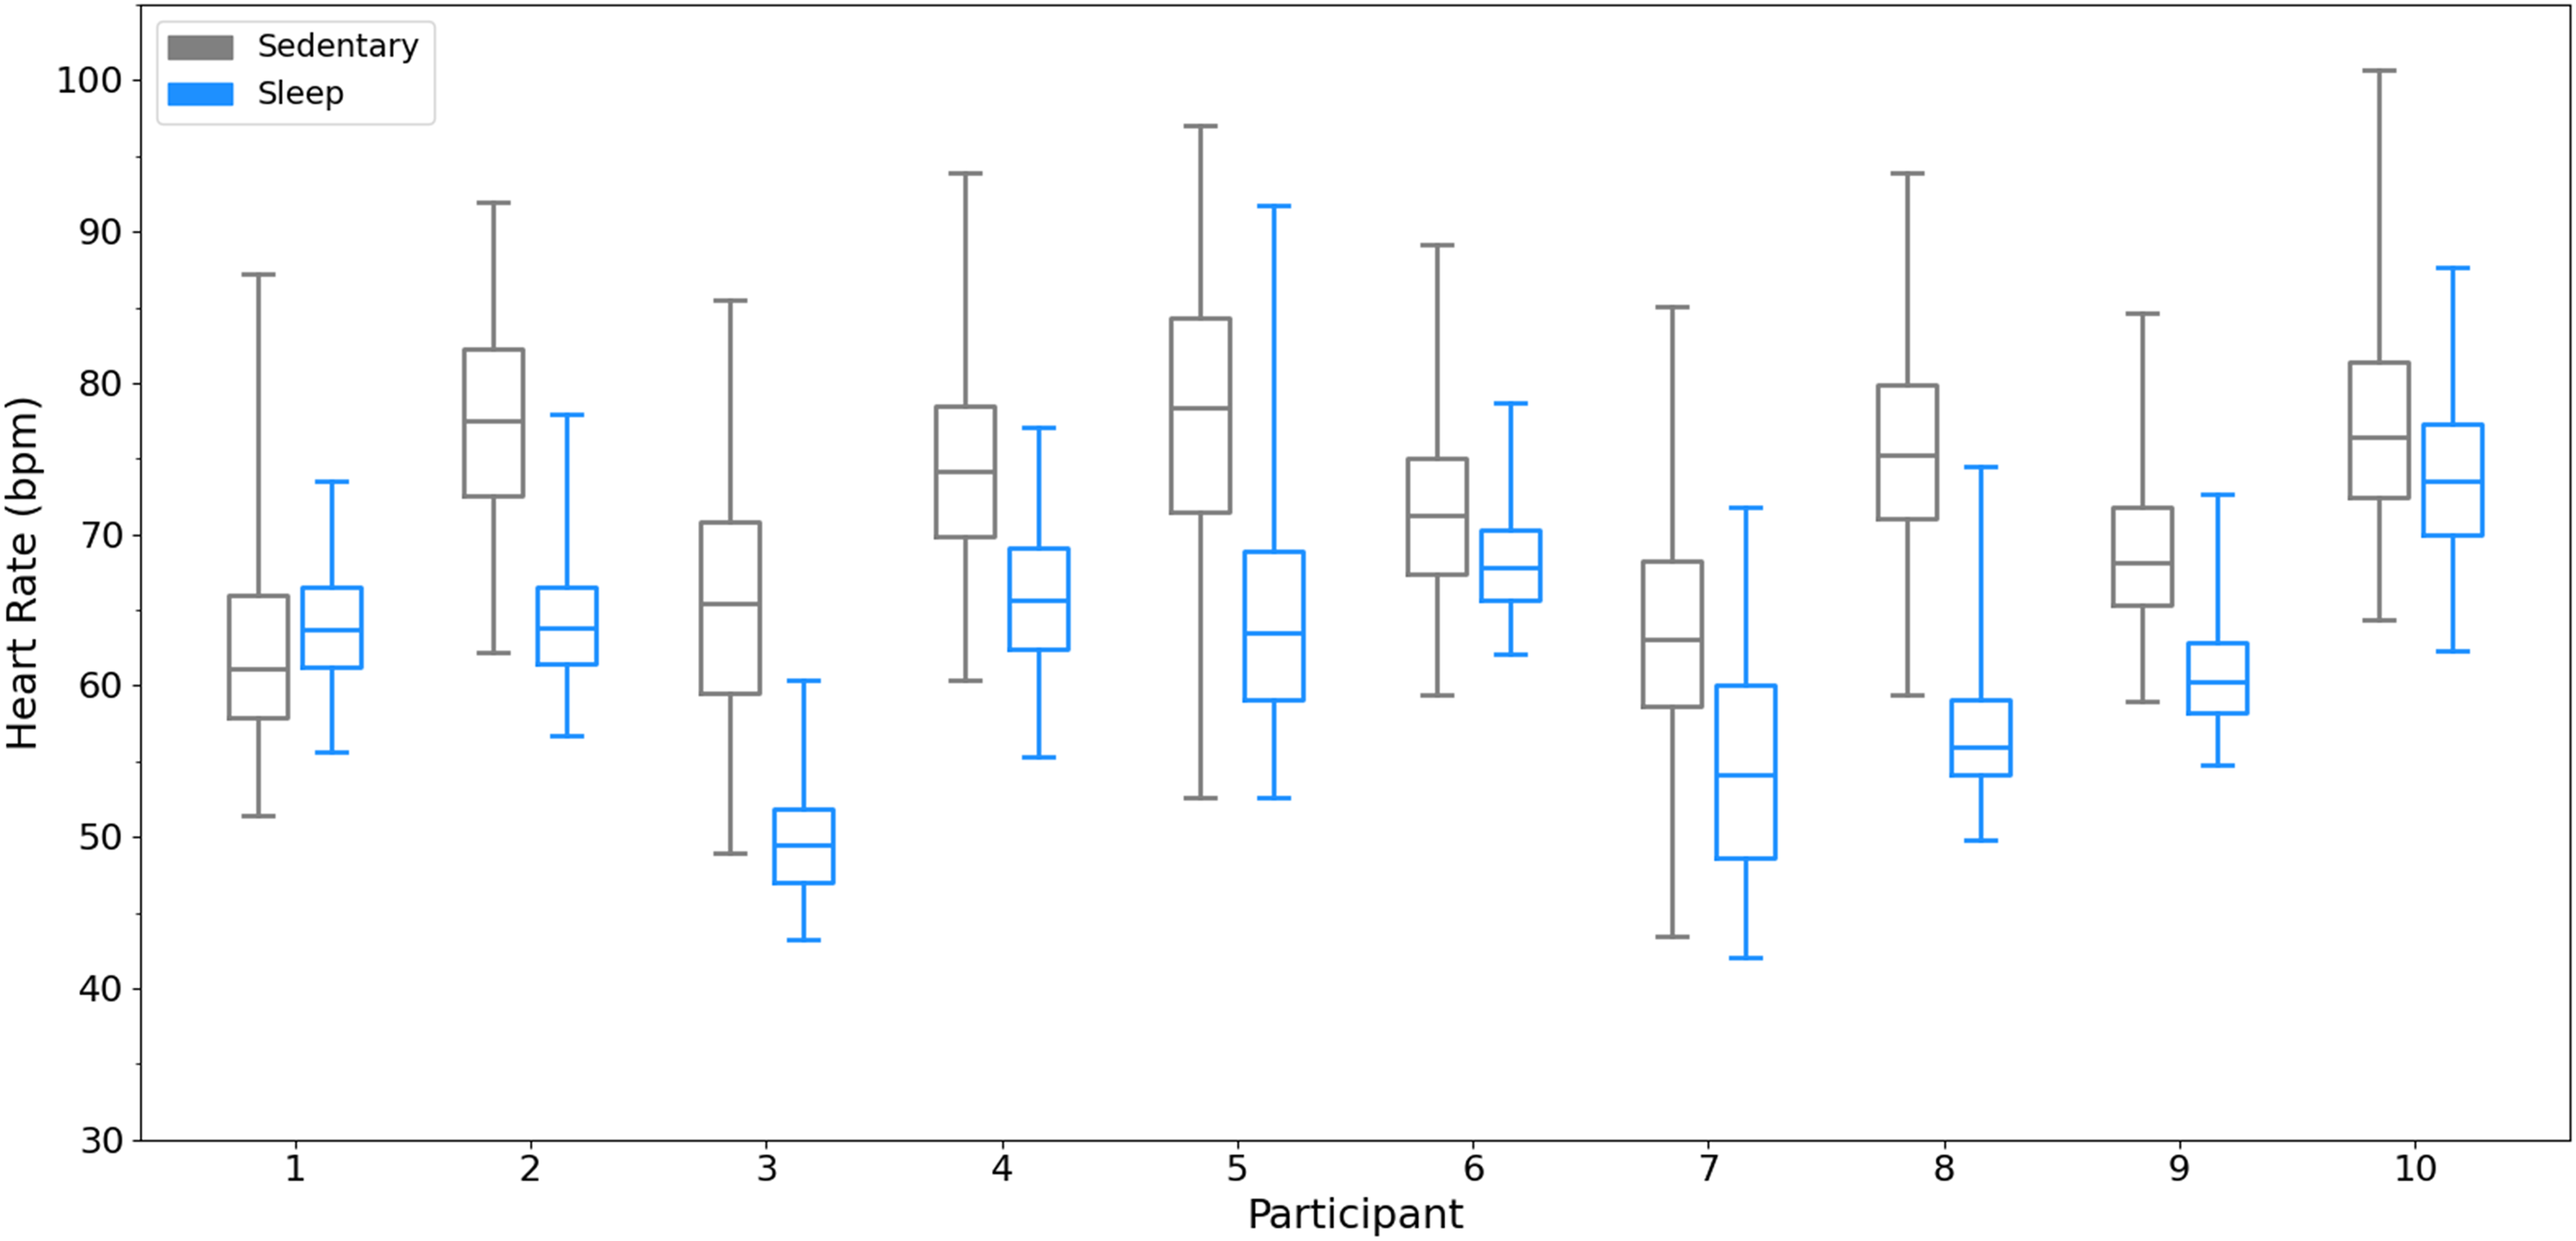
Overall HR median and range values per participant during sedentary (gray) and sleep (blue) when HR data is pooled across the collection period per resting condition. Box and whisker plots include whiskers that correspond to the first and 99th percentile (with the difference reflecting the HR range), and a horizontal line within the box that corresponds to the median. HR: heart rate.
The median HR value during sedentary behavior (overall sedentary median HR) was significantly greater than the median HR value during sleep (overall sleep median HR) (71 ± 6 vs. 62 ± 7 bpm, respectively) (t = 4.24, df = 9, p = 0.001, d = 1.37) (Figure 7A). The range in HR values during sedentary behavior (overall sedentary HR range) were significantly greater compared to the range in HR values during sleep (overall sleep HR range) (35 ± 6 vs. 23 ± 7 bpm, respectively) (t = 8.54, df = 9, p < 0.001, d = 1.88) (Figure 7B).

Comparison of HR median (A) and range values (B) between sedentary behavior (gray) and sleep (blue) when HR data is pooled across the collection period per resting condition. Each panel is a box and whisker plot, and the horizontal line within the box corresponds to the median value. Panel A shows that overall sedentary median HR was significantly greater than overall sleep median HR (p = 0.001). Panel B shows that overall sedentary HR range was significantly greater than overall sleep HR range (p < 0.001). Connector lines are used to denote individual participants (n = 10).
Discussion
This study demonstrates a novel approach to measurement of daily life resting HR (RHR) using wearable technology. The approach relies on all available data, rather than a single moment in time, to provide what arguably is a more robust indicator of RHR. Importantly, this approach is dependent on the ability to reference to specific behavioral contexts. Defining RHR based on a first percentile statistical criterion and consistent averaging window length (e.g., 30-s) enabled standardized comparisons to be made across resting conditions (sleep vs. sedentary behavior) and days. Although estimates of RHR based on pooling several days of HR data did not reveal differences between sedentary behavior and sleep, a larger range in HR values during sedentary behavior compared to sleep supports the use of sensor wear protocols that include both day and nighttime periods, to be able to distinguish between resting conditions. Additionally, when RHR estimates were derived per day, the between-day variability was as large as 14 bpm for both sedentary and sleep, suggesting that measuring RHR based on HR data from a single 24-h period may be insufficient and could misrepresent an individual's RHR. Instead, adopting an approach to measure RHR from continuous free-living HR data that involves segmenting a multi-day collection period into days, and identifying the day with the lowest RHR estimate, may permit more accurate RHR assessment and enable quantification of HR change from a standardized reference point during extended HR monitoring.
Assessing beat-to-beat HR, which is often not possible when deploying devices with proprietary analytics, revealed that potentially non-physiological HR values occurred across participants when the minimum HR value was used. When defining RHR by applying the first percentile statistical criterion to 30-s rolling windows of HR data that were pooled across the collection for each resting condition, there was no significant difference in the resultant RHR estimates, in contrast to the hypothesis that RHR estimates during sedentary behavior would be higher than during sleep. Similarly, in contrast with the hypothesis, there was no difference in day-to-day variability (i.e., CV) in daily RHR estimates between sedentary behavior and sleep. It is possible that the apparent lack of difference in overall RHR and between-day variability are related to limitations in how sleep is commonly determined in free-living settings (i.e., wrist actigraphy-based methods). Though the algorithm adopted in this study has been shown to produce sleep estimates that have good agreement with polysomnography-derived parameters, 27 the wrist-based approach is susceptible to classifying periods of wakeful rest with a lack of body movement as sleep. In such instances, it is possible that higher HR values would be measured during those misclassified “sleep” windows than what is physiologically occurring during actual sleep. Alternatively, this lack of difference in overall RHR estimates and between-day variability in daily RHR between sedentary behavior and sleep may be related to adoption of the first percentile statistical criterion, which does not provide a direct measure of lowest possible HR. While measuring the minimum HR is potentially of interest, simply choosing the lowest 30-s window is not practical given the potential for some erroneous “low” HR values as a function of noise in the free-living ECG signal. One important next step involves comparing these data-driven, daily life RHR estimates during sleep and sedentary behavior to a well-controlled clinical measurement of resting HR to determine the magnitude and direction of potential differences. Additionally, application of this daily life RHR criterion in a larger cohort of individuals, including those who live with complex health conditions, is ongoing to address the limited diversity of the current study sample and to test if differences in RHR exist between resting conditions across various cohorts.
Beyond assessment of group means, focusing on individual participant between-day variability in daily RHR estimates demonstrated that the absolute difference in RHR between days was as high as 14 bpm for both sedentary behavior and sleep, even in this control cohort. Between-day differences of this magnitude may have impacts on the use of RHR as a risk stratification tool and implications when using RHR to prescribe or classify exercise intensity. For example, epidemiological evidence suggests that an increase in RHR of 10 bpm is meaningful in terms of risk of cardiovascular and all-cause mortality.18,19 Therefore, a participant with a high degree of between-day variability could have their “risk” level misclassified if only a single day of continuous HR monitoring is used to estimate RHR. Additionally, in the context of calculating HR reserve as a tool to prescribe exercise intensity, differences in a daily estimate of RHR could change the target HR for an activity in a way that may require an individual to exercise at an intensity that may not be appropriate for their physical capacity or exercise goals. An important next step involves understanding the characteristics of the sedentary and sleep periods that contain the daily resting HR estimates (e.g., bouts of a certain length) and when within these periods the resting HR is measured (e.g., middle or end of a bout). Nonetheless, within-person variability in RHR between days, irrespective of resting condition, suggests that a single 24-h measurement period may be insufficient for determining free-living RHR. Rather, a multi-day collection is warranted to assess RHR per day and identify the day with the lowest RHR estimate as a more suitable reference point for quantifying HR change and/or assessing links to health outcomes.
A wear paradigm that involves multiple sensors and body locations can improve free-living behavioral classification, which includes improved assessment of the intensity of daily life physical activities by referencing workload-related HR increases to a reliable measurement of resting HR. Within the present study, the inclusion of multiple limb-worn IMUs allowed for periods of ankle-derived walking to be detected and removed from analysis, thus more accurately isolating periods of sedentary behavior compared to wrist only-derived estimates of activity, which have been shown to be prone to misclassification. 34 However, the finding that the within-participant range in HR values was larger during sedentary behavior (mean range of 35 bpm) compared to sleep (mean range of 23 bpm) aligned with the hypothesis that certain variables known to impact HR may be more influential during the waking versus sleeping state. Notably, current classification of sedentary behavior does not distinguish sitting versus lying down, which is important because HR is impacted by body posture, with a reduction in HR from an upright to lying down position.13,67 Additionally, other factors that impact HR, such as emotional stress, elevated BP, consumption of substances like caffeine, or use of medications (in two participants), could affect HR, 15 and could have contributed to the increased range in HR values during sedentary behavior compared to sleep. This larger range in HR values during sedentary behavior suggests that if someone is measuring RHR at a single time point, without the capacity to pool the HR values within a given resting condition and anchor the RHR measurement to the low end of the distribution, the resultant “RHR” estimate is more likely to be inflated during sedentary behavior compared to sleep. As such, if using technology that does not permit customized data analyses, focusing on HR data during sleep may be the preferred strategy to avoid inflating the RHR estimate. Ongoing work to integrate posture detection during sedentary behavior will enable a comparison to be made between HR range during sedentary lying postures versus HR range during sleep to re-assess the magnitude of HR differences that can be attributed to resting condition and better elucidate the impacts of external influences on HR during wakeful rest.
One notable observation from the present study is that collecting a high volume of HR data across several days provides a unique opportunity to profile the distribution of HR during resting conditions within and between participants. In addition to the focus on first percentile values as a statistical criterion for estimating RHR, it is possible to determine differences in HR distributions between resting conditions, days, and participants. Rather than using the term “resting heart rate” to encompass a broad range of potential measurement approaches and possible states, it may be prudent for more specific nomenclature to be adopted that considers both the context and where the measurement falls within the HR distribution. Given the noise that accompanies the collection of biometric signals, including ECG, in truly uncontrolled, free-living settings, it may not be feasible to omit all low, erroneous HR values as a function of poor signal quality or imperfect R peak detection, and therefore, may not be possible to identify the HR value that corresponds to an individual's lowest possible HR at rest. However, if the first percentile criterion adopted in this study could be considered as an approach for measurement of context-specific “minimum” values and referred to as a “minimum sedentary HR” and “minimum sleep HR,” this may permit a daily life HR estimate to be made that is near to the biologically lowest HR and serve as a consistent reference for quantifying HR change. Additionally, the median HR value within a given resting domain could be redefined as the “typical sleep HR” or “typical sedentary HR,” with the latter potentially being reflective of what is measured in a clinical setting. Beyond nomenclature, the capacity to profile the distribution of HR during resting conditions from continuous HR monitoring may challenge conventional thinking about what is clinically meaningful in terms of risk reduction and prognostic information and allow for further study into whether certain RHR distribution profiles have health implications. For example, future work could look to investigate if poorer health outcomes and increased risk are associated with the free-living “minimum,” “typical,” or range in HR values, or alternatively, associated with a distribution-based/composite HR measure during resting conditions. Additionally, continuous HR monitoring within a multi-sensor setup could be integrated into the pre-post evaluation structure of an intervention such as an exercise training program, to better elucidate if and/or how the distribution of HR values during rest changes, and if there are novel indicators of improved health outcomes.
Conclusion
This study highlights the shortcomings of conventional RHR monitoring approaches (i.e., single estimates that lack standardization) and details the development of a novel method for calculating RHR and characterizing the distribution of HR values during resting conditions based on free-living, continuous HR monitoring. The proposed method for measuring RHR is relevant to those using wearable device set ups that include a reliable HR monitoring device that provides access to raw or beat-to-beat data, in combination with the identification of resting behavioral conditions. The potential value of distinguishing between resting conditions and stratifying a multi-day collection into individual days is demonstrated via differences in HR range values between sedentary behavior and sleep, and differences in daily RHR estimates within a person across days. Use of a multi-sensor and device approach and consistent method for measuring daily life RHR may enable improved health risk stratification and quantification of the magnitude of HR change from a known reference point. Further investigation is warranted to (1) apply this approach to characterizing daily life RHR in a larger cohort, including those living with complex health conditions, (2) improve free-living resting behavioral classification via integration of postural information, and (3) confront the nomenclature used for defining RHR and describing the HR profile during daily life resting conditions. This may permit identification of novel resting HR indices that link to health outcomes or change as a function of health status or intervention.
Footnotes
Acknowledgments
The authors wish to thank HANDDS-ONT study participants, as well as ONDRI investigators and the ONDRI project management team for their administrative support of this project.
ORCID iDs
Ethical approval
The HANDDS-ONT study was approved by Clinical Trials Ontario (Project ID: 3589) with Sunnybrook Research Institute in Toronto, Ontario as the Board of Record (REB approval: 2021-1517).
Informed consent
All participants provided verbal informed consent remotely prior to study initiation, and this information was documented by the research coordinator.
Consent for publication
The authors affirm that human research participants provided informed consent for publication of their data.
Author contributions
FEG, KVO, KBB, KW, BFC, and WEM contributed to study conception and design, gaining ethics approval, and assisted with participant recruitment. FEG, KVO, and WEM performed and supported data collection. FEG, KVO, KW, and WEM developed the data analytics plan, with input from AT and KEM. Data management, curation, and analysis were performed by FEG, with support from KVO, KBB, KW, BFC, and WEM. The first draft of the manuscript was written by FEG. All authors critically reviewed and edited the manuscript and have read and approved the final version.
Funding
The authors disclosed receipt of the following financial support for the research, authorship, and/or publication of this article: This research was conducted with the support of the Ontario Brain Institute and a grant to WEM from the Natural Sciences and Engineering Research Council of Canada (#1145753). The Ontario Brain Institute is an independent non-profit corporation, funded partially by the Ontario government. The opinions, results, and conclusions are those of the authors and no endorsement by the Ontario Brain Institute is intended or should be inferred. FEG is supported by a Canadian Institutes of Health Research (CIHR) Doctoral Research Award (Funding Reference Number: 181435).
Declaration of conflicting interests
The authors declared no potential conflicts of interest with respect to the research, authorship, and/or publication of this article.
Data availability
ONDRI data—including but not limited to the data in this article—will be accessible through the Ontario Brain Institute (![]() ) to qualified researchers. Please see the Ontario Brain Institute website for information on when the data will be released and how to access the data: https://braininstitute.ca/.
) to qualified researchers. Please see the Ontario Brain Institute website for information on when the data will be released and how to access the data: https://braininstitute.ca/.
Guarantor
WEM.