
Abstract
Background and objective
To establish a nomogram prediction model for patients with chronic obstructive pulmonary disease (COPD) based on Lasso feature screening using acoustic features and general clinical data, as well as a risk warning model for patients with acute exacerbation of COPD (AECOPD), and to investigate the performance and value of these two models.
Methods
A total of 240 male COPD patients, including 41 patients with acute exacerbation, and 82 healthy control male volunteers were enrolled as subjects from October 2022 to January 2024. Acoustic features and general clinical data were collected. Lasso regression was used to screen variables related to COPD and AECOPD diagnosis, and nomogram models were separately established and verified by the receiver operating characteristic (ROC) curve, calibration curve, and decision curve.
Results
Variables related to COPD diagnosis screened by Lasso regression included age, smoking history, a_Jitter, e_MFCC1, e_F2 frequency, i_H1-A3, i_F1 amplitude, o_F1 amplitude, and u_MFCC4, and the variables related to AECOPD included expectoration, mMRC grade, i_Jitter, i_F2 frequency, i_Alpha Ratio, and u_H1-H2. The ROC Curve showed that the Area Under the Curve (AUC) of the COPD nomogram model was 0.95, and the AUC of the AECOPD risk warning model was 0.83. The calibration curve indicated that nomogram models showed reasonable consistency, and the Mean Absolute Error (MAE) values were 0.026 and 0.028, respectively. The decision curve indicated that nomogram models showed good benefit, and the benefit thresholds were nearly full threshold, and 0.11–81 and 0.88–0.99, respectively.
Conclusion
The nomogram models for COPD prediction and risk warning of AECOPD can be used as a clinical auxiliary diagnostic and early screening method, providing new insights into the intelligent auscultation of COPD.
Introduction
COPD is a common chronic airway disease that is both preventable and treatable, and it is characterized by persistent airflow restriction and respiratory symptoms caused by airway and/or alveolar abnormalities. In the early stages of COPD, patients may not exhibit obvious symptoms. As the disease progresses, symptoms such as coughing and sputum production become increasingly prominent, and in the later stages, the main manifestation is shortness of breath. In China, the morbidity rate of COPD in people aged 40 and above has reached 13.7%, which increases with age and also brings about an increasing burden in economic and social aspects. However, the proportion of COPD patients who are aware of their condition or have undergone pulmonary function tests is very low.1,2 Therefore, prevention and early diagnosis of COPD are of great clinical significance to decrease the morbidity rate. Pulmonary function examination is currently the “gold standard” for COPD diagnosis. However, in the clinical examination process, some patients show poor cooperation due to listening, speech, movement or understanding disorders, which leads to certain limitations of pulmonary function examination. 3
AECOPD refers to an acute event that frequently occurs during the course of COPD. The main clinical manifestations of patients include worsening of shortness of breath, often accompanied by wheezing, chest tightness, and increased coughing. Other symptoms such as tachycardia, insomnia, and fatigue may also appear. AECOPD is closely related to the increase of death risk, seriously affecting the life quality of patients and increasing the economic burden, so its early prevention, early diagnosis, and early treatment are of great clinical significance. 4
In the four-method diagnosis of Traditional Chinese Medicine (TCM), auscultation is an important part of “auscultation and olfaction diagnosis.” By listening to the patient's breathing, language, cough, belch, vomit, and other sounds, the nature of the disease such as cold and heat, deficiency, and excess can be distinguished. 5 Modern auscultation technology can analyze the acoustic features of patients to determine pathological changes in the vocal organs, providing an objective basis for disease diagnosis and treatment. 6 It also has the advantages of being convenient, non-invasive, and cost-effective, making it suitable for assisting in diagnosis and early screening. Moschoivs et al. 7 utilized the ResAppDx algorithm to automatically detect children's coughs and analyze their mathematical characteristics, aiding in diagnosing pediatric acute respiratory diseases. Alper et al. 8 analyzed the baseline acoustic features of participants’ speech and used random forest (RF), support vector machine (SVM) and CatBoost models to classify these acoustic parameters. It was found that the CatBoost model effectively distinguished between COPD patients and healthy individuals.
The Lasso regression analysis method overcomes the multicollinearity issue of the traditional regression model and is suitable for screening in multi-variable data sets. 9 The nomogram can visually present the results of multivariate analysis, integrating predictive models into numerical estimates of the probability of an event, which facilitates clinical application and promotion.10,11 For example, Zhang 12 used the Lasso regression method to screen the acoustic features of participants and established a logistic regression nomogram model, which could predict the probability of a participant being diagnosed with Parkinson's disease based on features such as vocal intensity, speech rate, language pause. Shi et al. 13 applied Lasso regression to screen the examination data of patients with left heart disease and constructed a nomogram model, which offers good diagnostic value and clinical adaptability, accurately assessing pulmonary hypertension risk in these patients. La Salvia et al. 14 established a nomogram model according to overall survival (OS) and progression-free survival (PFS) to predict the prognosis of lung neuroendocrine tumors (NETs), providing a useful tool for stratified prognosis among the three risk groups and enabling clinicians to adjust treatment plans according to the stratification.
Our research group has previously explored the regularity of acoustic features in COPD patients. 15 Based on this, the Lasso regression method was used in this study to screen out acoustic and general clinical variables related to COPD and AECOPD diagnosis. Then, the COPD nomogram prediction model and AECOPD risk warning model were established and evaluated. It is expected to provide a new reference for the predictive diagnosis of COPD and early warning of AECOPD in a concise and innovative manner.
Materials and methods
Research subjects
All participants in this study were collected from October 2022 to January 2024, of which the COPD group contained COPD patients in the outpatient and inpatient departments of the Respiratory Department of Huadong Hospital Affiliated with Fudan University. Due to the clinical observation of relatively few female patients, and the large difference between male and female voices, only male patients were included, with a total of 240 cases. The healthy control group was a volunteer population at the Gaohang Community Health Center, including 82 males.
Diagnostic criteria
The diagnostic criteria for the COPD group refer to Guidelines for the diagnosis and management of chronic obstructive pulmonary disease (revised version 2021), 1 mainly based on clinical data such as exposure history of risk factors, symptoms, signs and pulmonary function examination, and other diseases that can cause similar symptoms and persistent airflow restriction are excluded. During the pulmonary function test, if the forced expiratory volume after 1 s/forced vital capacity (FEV1/FVC) is < 70%, it indicates the presence of persistent airflow limitation, which is a necessary condition for the diagnosis of COPD.
The diagnostic criteria for the AECOPD group refer to the relevant content in Expert consensus on the acute exacerbation of chronic obstructive pulmonary disease in China (revision in 2023), 4 that is, COPD patients with dyspnea and/or increased symptoms of cough and sputum, the deterioration of symptoms occurs within 14 days, may be accompanied by shortness of breath and/or tachycardia. However, although the current diagnosis of AECOPD is mainly based on the clinical manifestations of patients, and laboratory tests such as blood routine, biochemical indicators, and imaging examinations can be used as auxiliary means, there are no biomarkers that can accurately predict or diagnose AECOPD due to its heterogeneity.
Inclusion and exclusion criteria
Inclusion criteria
Inclusion criteria for the COPD group: (a) meet the above diagnostic criteria for COPD; (b) age 40–90 years old, male; (c) good compliance, can cooperate with the completion of data collection; and (d) voluntarily join the study and sign the informed consent.
Inclusion criteria for the healthy control group: (a) no obvious respiratory disease, and no acute onset and medication in the past 3 months; (b) age 40–90 years old, male; (c) good compliance, can cooperate with the completion of data collection; and (d) voluntarily join the study and sign the informed consent.
Exclusion criteria
(a) patients with bronchial asthma, lung cancer, tuberculosis, and other pulmonary diseases; (b) patients with severe heart, brain, liver, and kidney dysfunction; (c) patients with listening, speech, and cognitive impairment; (d) patients with mental illness; (e) patients with a history of neck, throat, or thyroid surgery or severe medical history; (f) pregnant or lactating females; and (g) non-Chinese native speakers.
The screening process for participants is shown in Figure 1.

Screening process of participants.
Research methods
Consultation information collection
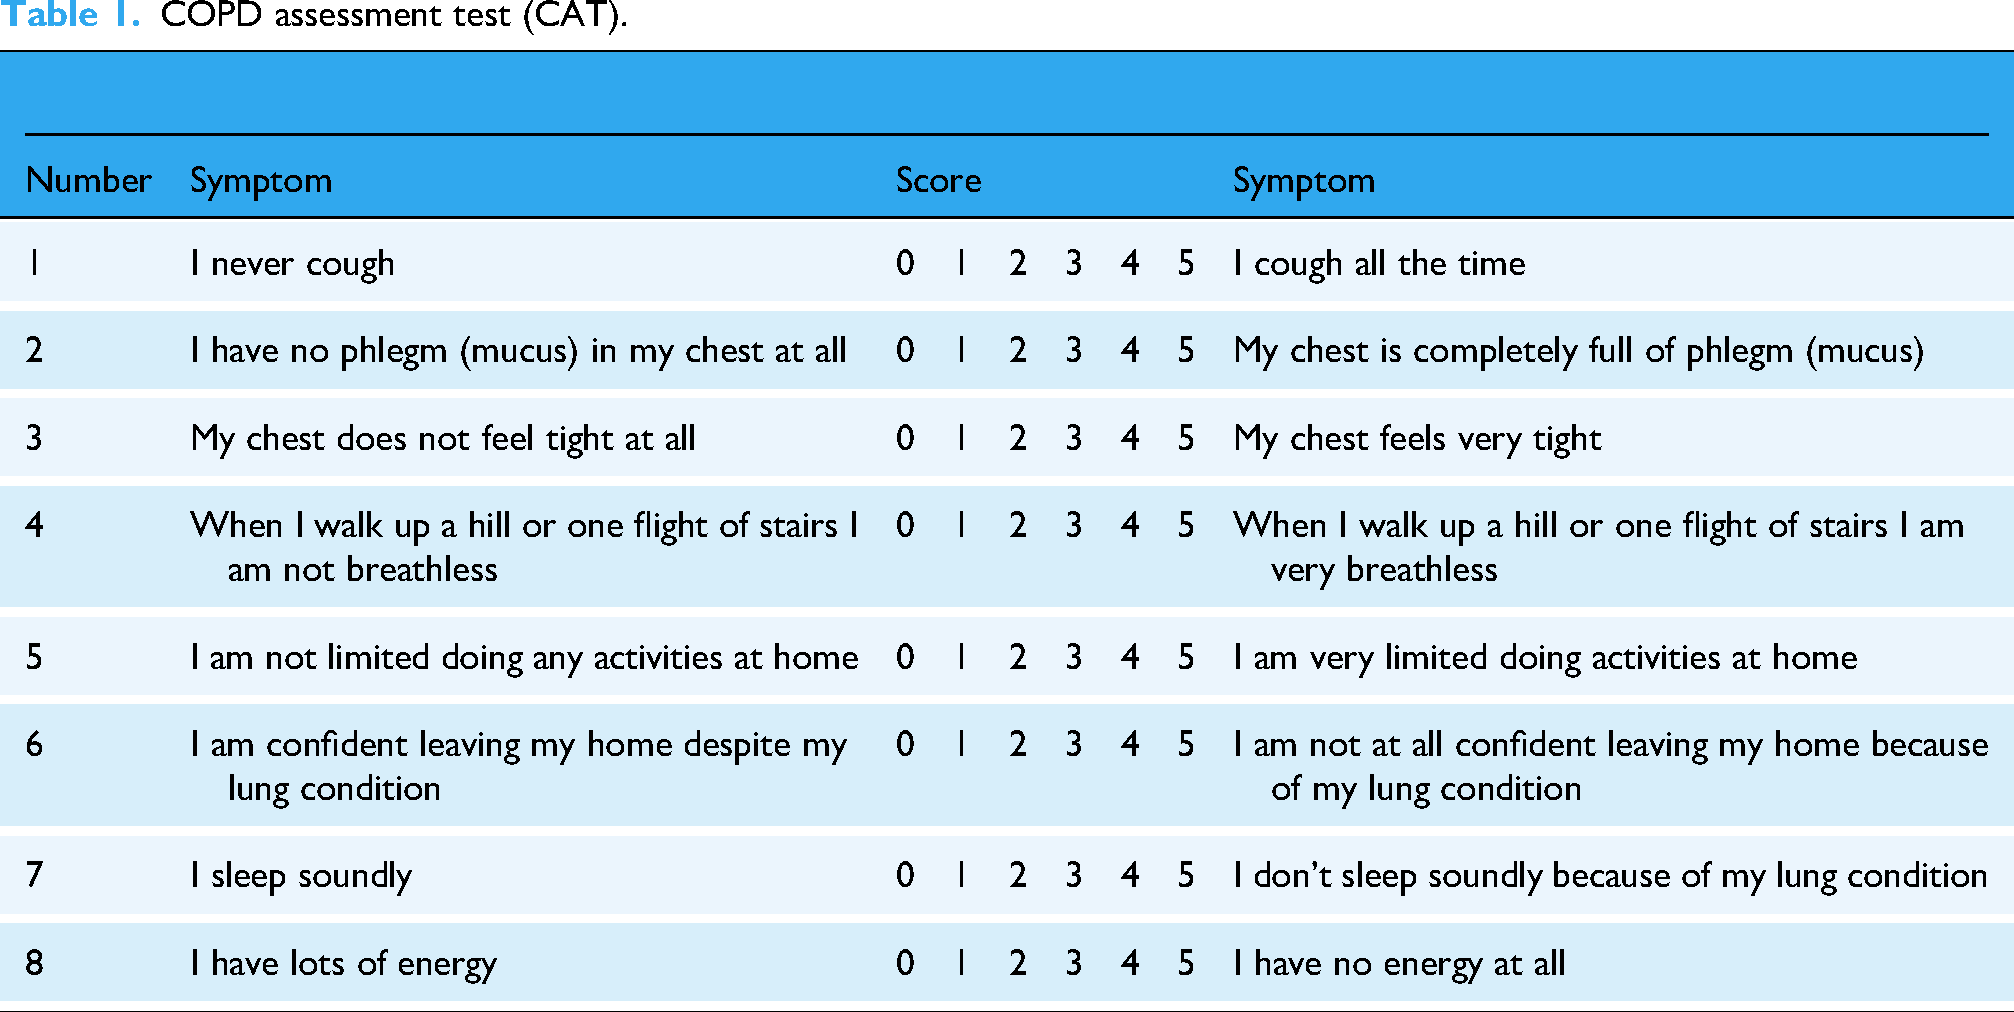
The clinical information of the subjects included name, age, height, weight, personal history of pulmonary disease, family history of pulmonary disease, and smoking history. COPD patients should complete the COPD Assessment Test (CAT) and the modified British Medical Research Council (mMRC) dyspnea Questionnaire, as shown in Tables 1 and 2, 1 and then the results of pulmonary function examination and chest CT should be reviewed and recorded.
COPD assessment test (CAT).
Modified British Medical Research Council (mMRC) dyspnea questionnaire.

The actual values were assigned to age, height, and weight. Personal history of pulmonary disease, family history of pulmonary disease, and smoking history were coded as 1 for presence and 0 for absence.
Auscultation acquisition and characteristic parameter extraction
This study used a SONY PCM-A10 recorder to collect the acoustic information of the subjects. The ambient noise decibel test was performed before sampling, and the acquisition could be performed when the noise was below 45 decibels. The recording device was placed 10 cm away from the subject's mouth and at a downward tilt of 45°, the sampling frequency was set at 44.1 kHz, and the quantization digit was 16. The subjects were asked to pronounce five vowels smoothly and naturally, namely [a], [e], [i], [o], [u], and maintain each vowel for 2 s.
The collected voice information was preprocessed to ensure the audio quality. Cool Edit Pro 2.1 software was used for audio editing, noise and redundant information were manually removed, Praat speech analysis software (version6.1.51) was used for vowel labeling, and endpoint detection and audio segmentation were used to extract relatively stable 0.5 s signals in each vowel audio. 16
The extended Geneva Minimalist Acoustic Parameter Set (eGeMAPS) was used to extract 22 characteristic parameters, including frequency, energy/amplitude, and spectral parameters. The detailed calculation methods for each parameter are documented in the OpenSMILE manual and the book. 17 The original parameter set includes advanced statistical features computed from multiple frames of speech. Since this study focuses solely on vowels, which exhibit relatively stable speech signals, the mean values of the parameters were used for analysis in our study. eGeMAPS of vowels were obtained with the help of an OpenSMILE toolkit. The specific parameters are shown in Table 3.18,19
Characteristic parameters and meanings.

Statistical analysis
This study was an observational cross-sectional study. In this study, SPSS25.0 software was used for data analysis. In the objective analysis of speech features, some groups could not satisfy the normal distribution and homogeneity of variance at the same time, so the median (interquartile range) [M(IQR)] was used to represent. Count data were represented by composition ratios and incidence rates. Mann–Whitney rank sum test was used for comparison between the two groups. The comparison of count data was performed using the χ2 test. A bilateral test was used in all cases and P < 0.05 was considered statistically significant.
Variable screening and model conducting
Subjects were randomly divided into a train set and a test set at a ratio of 7:3. For continuous variables, the original values were used directly; for categorical variables, the assignment method described above was followed. Lasso regression method (L1 regularization) was used to screen general clinical data and all acoustic variables (22*5 = 110). Through the regularization mechanism, the coefficients of irrelevant features were shrunk to zero, thereby screening variables related to the diagnosis of COPD and AECOPD. 20 Based on empirical evidence from previous related studies, for COPD-related variables, the initial value of the regularization parameter α was first set at 0.03 with an upper limit of 0.08; for AECOPD-related variables, the initial value of α was set at 0.08 with an upper limit of 0.13. Subsequently, all possible α values within the corresponding ranges were manually traversed in step of 0.001. During this process, both the AUC value and the number of selected variables output by the Lasso regression were monitored. Ultimately, an α value that balanced the number of variables and model performance was selected.
The R software was used to construct nomogram models. Stratified 10-fold cross-validation was employed to plot the ROC curve, and Area Under the Curve (AUC), accuracy, precision, recall, F1 score, and specificity were calculated to evaluate the performance of the nomogram models. A random seed was set to ensure the reproducibility of the results. Finally, the calibration curve and decision curve are applied to evaluate the consistency and benefit of the nomogram model.
Figure 2 shows an overall flow chart of the approach adopted in this study.

Research flow chart.
Results
Study results of the COPD nomogram model
Comparison of clinical general data
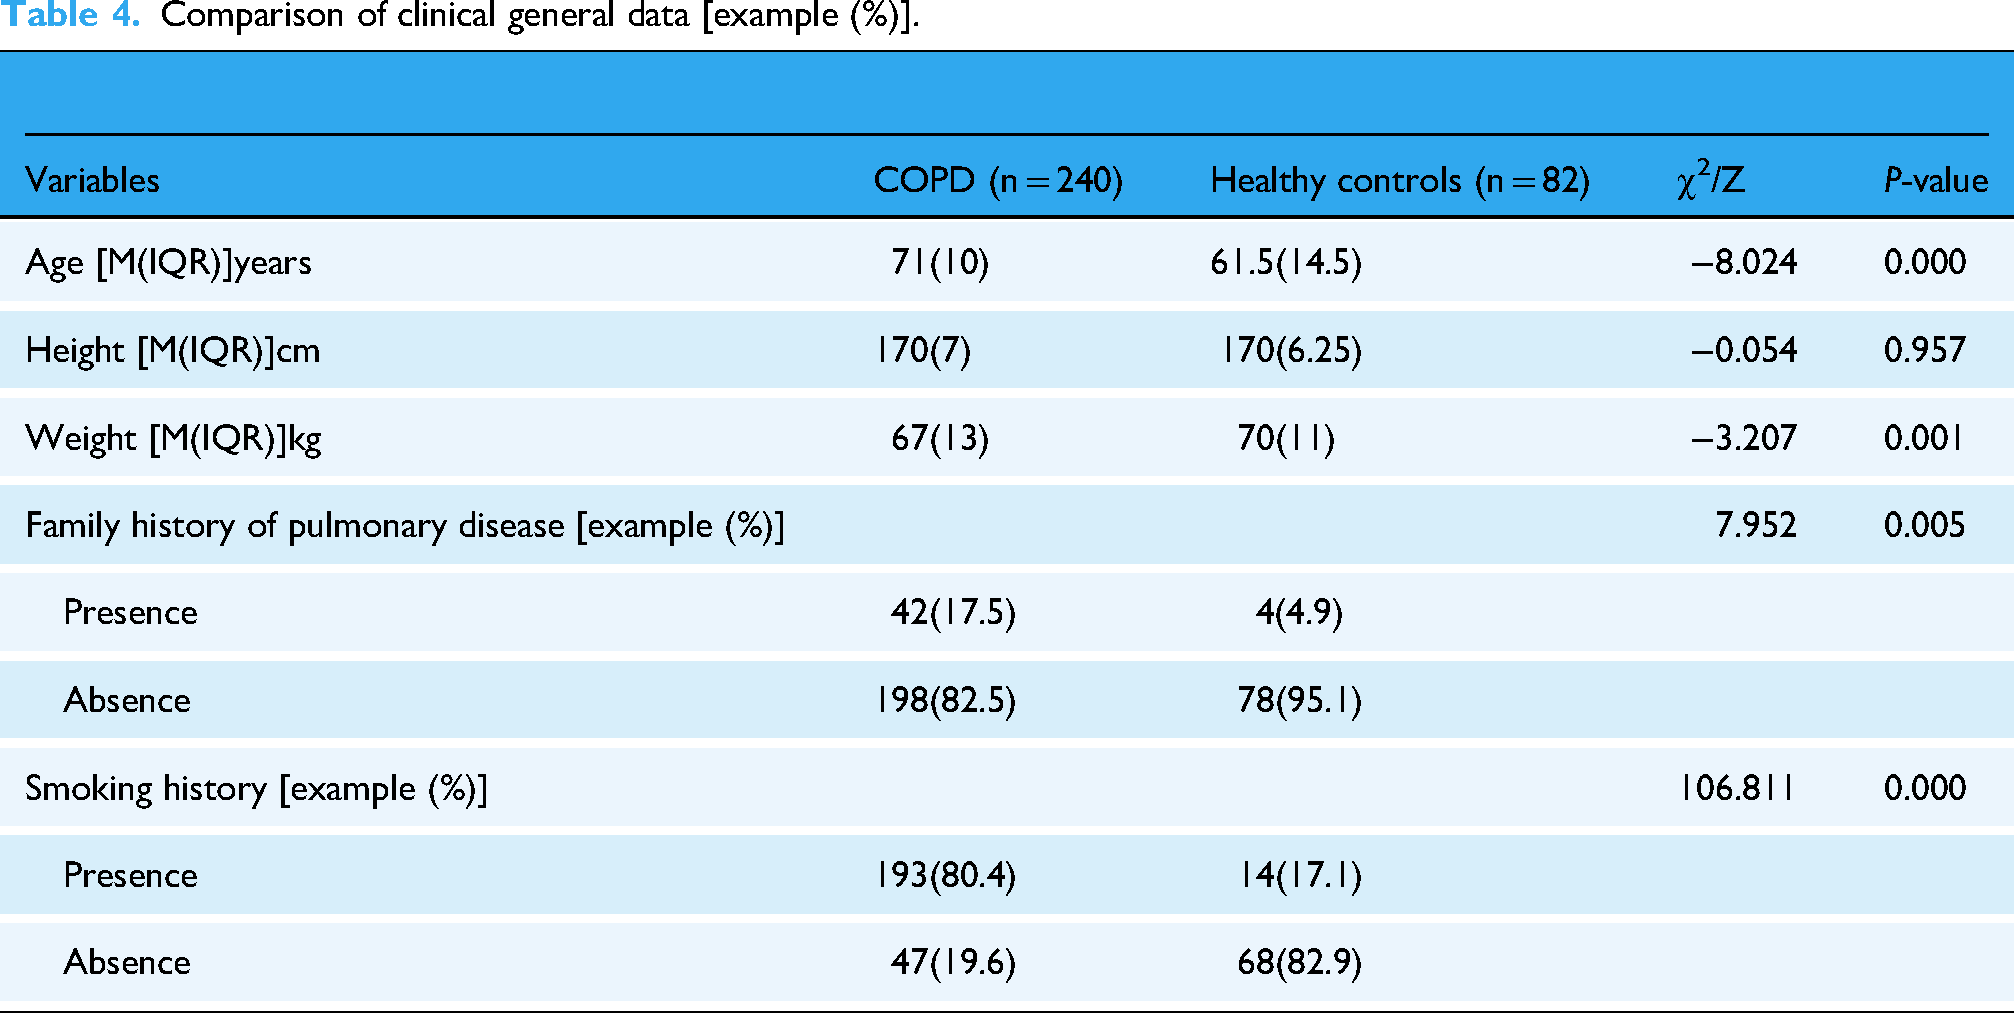
This study included 240 patients with COPD and 82 healthy controls. The statistical results showed that there were statistically significant differences in age, weight, family history of pulmonary disease, and smoking history between the two groups (P < 0.05), as shown in Table 4.
Comparison of clinical general data [example (%)].
Feature variable screening
Potential COPD predictors were screened by Lasso regression. When α = 0.046, nine variables including age, smoking history, a_Jitter, e_MFCC1, e_F2 frequency, i_H1-A3, i_F1 amplitude, o_ F1 amplitude, and u_MFCC4 were selected.
Establishment and evaluation of the COPD nomogram prediction model
R software was used to draw the COPD nomogram prediction model, as shown in Figure 3. The values of the relevant variables of the subjects were found in the corresponding scale in the graph, and the corresponding “Points” at the top were obtained by drawing a vertical line. Finally, the scores of each variable were added up to get the “Total Points,” which corresponded to the “Probability of Disease,” thereby obtaining the probability that the subjects would be diagnosed with COPD.

COPD nomogram prediction model.
The model performance was evaluated by plotting the ROC curve, confusion matrix, calibration curve and decision curve. Figures 4 and 5 and Table 5 show that the AUC (95% Confidence Interval, CI), accuracy, precision, recall, F1 score, and specificity of the nomogram prediction model were 0.95 (95% CI: 0.924–0.974), 0.89, 0.92, 0.94, 0.93, and 0.76 in the test set, respectively. It meant that in the test set, 94% of COPD patients were correctly identified, while 76% of healthy people were correctly identified.
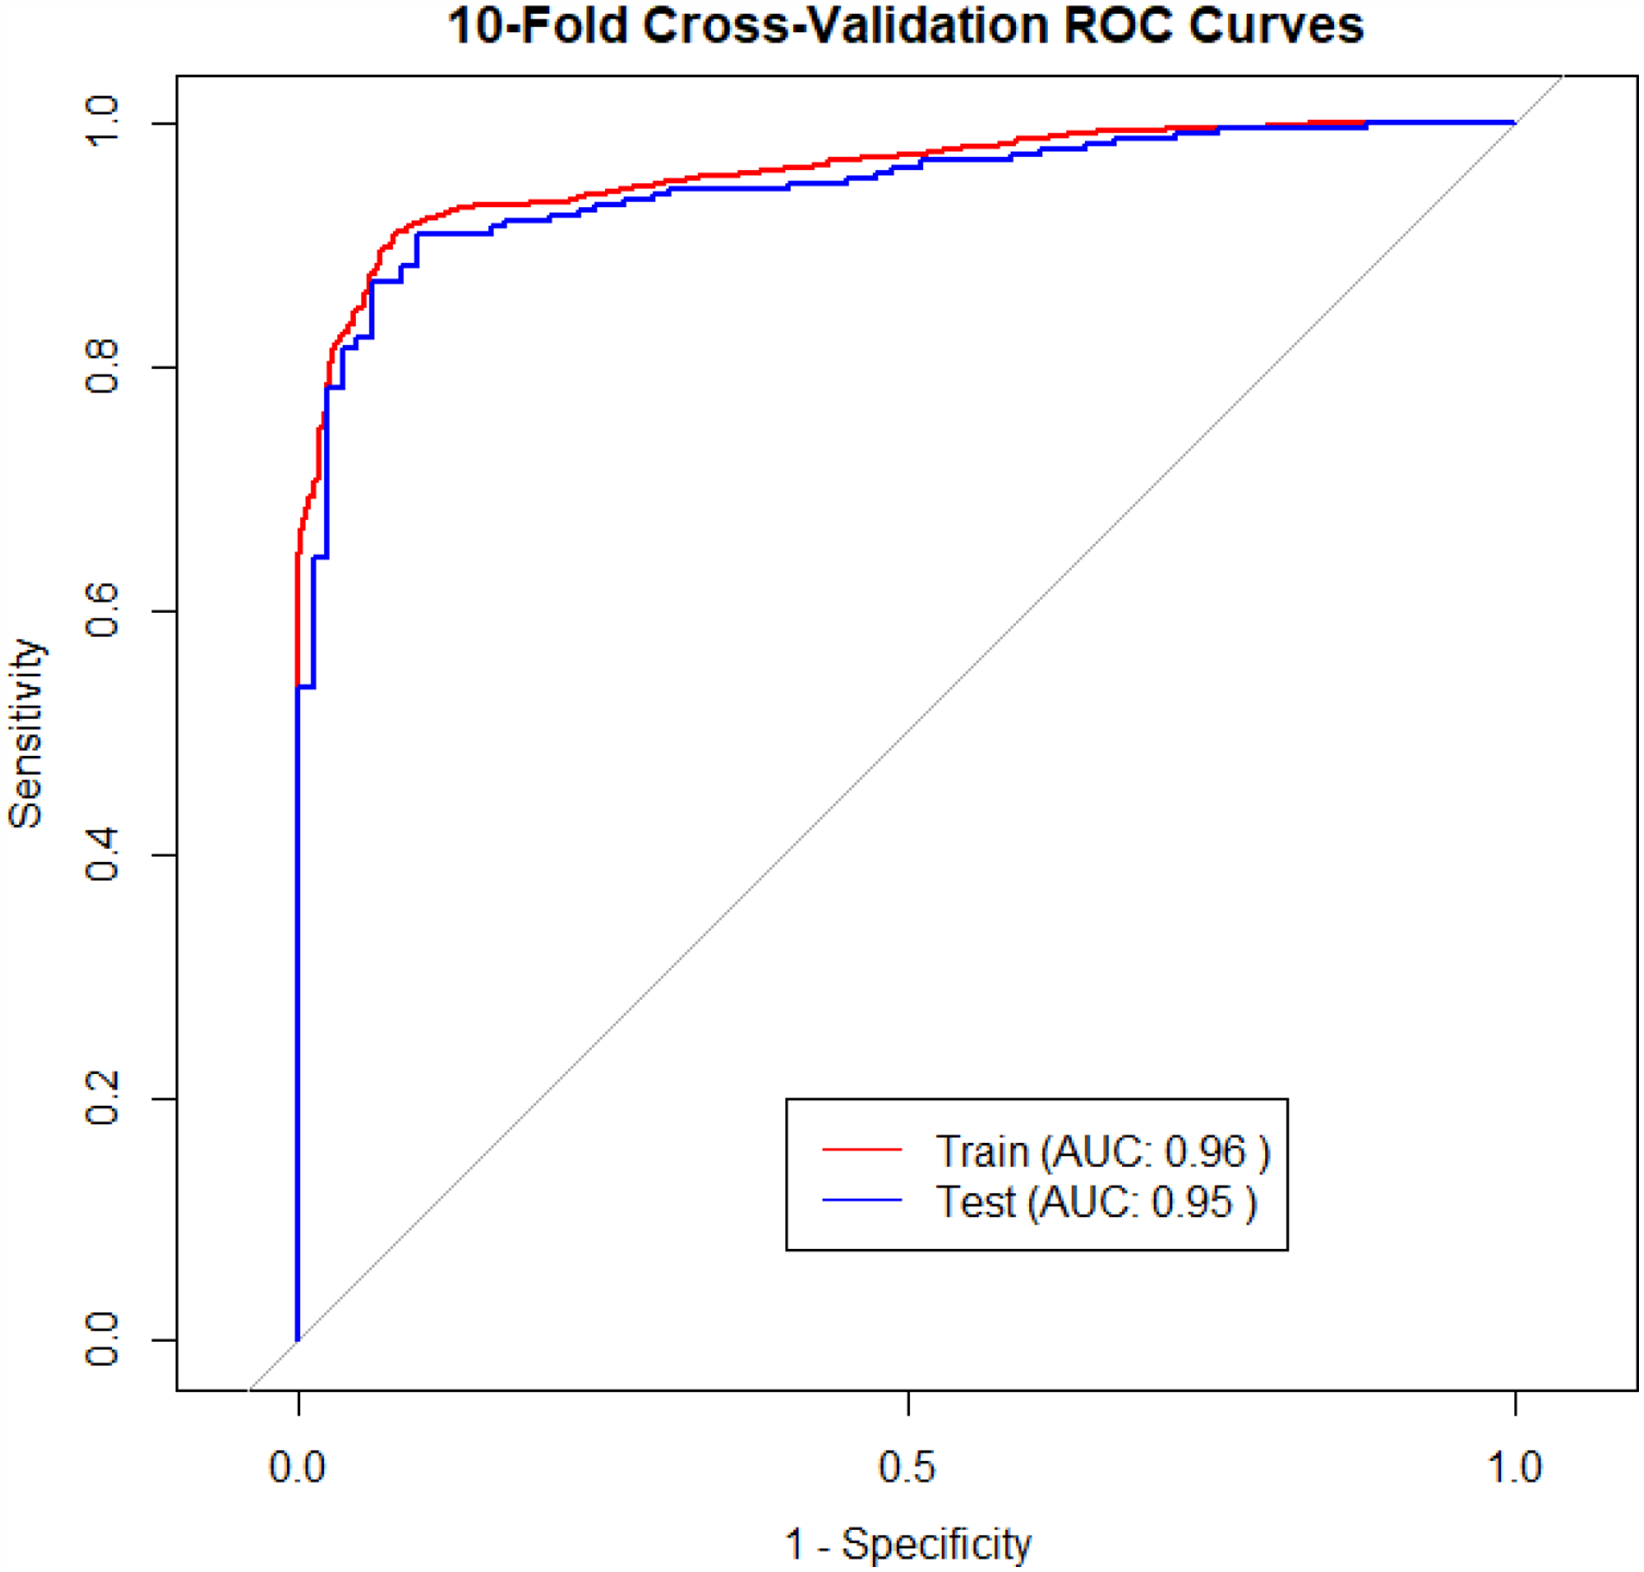
ROC curve of the COPD nomogram prediction model.

Confusion matrix of the COPD nomogram prediction model.
Performance of the COPD nomogram prediction model.

The calibration curve in Figure 6 showed that the nomogram prediction model had a high consistency between the predicted and actual probability of COPD occurrence, with an MAE of 0.026. The decision curve in Figure 7 showed that the benefit of the nomogram prediction model was relatively good, and it could provide valuable information for clinical decision-making almost within the full threshold range.

Calibration curve of the nomogram prediction model.

Decision curve of the nomogram prediction model.
Study results of the AECOPD risk warning model
In this part, 41 patients with acute exacerbation of COPD were included in the above COPD group, and 41 patients with stable COPD were matched according to age, height and weight. The risk warning model of AECOPD was constructed according to the same method mentioned above, and the model was also evaluated. Table 6 showed that there was no statistical significance in age, height and weight between the two groups (P > 0.05).
Comparison of basic information between patients with AECOPD and stable COPD [M(IQR)].

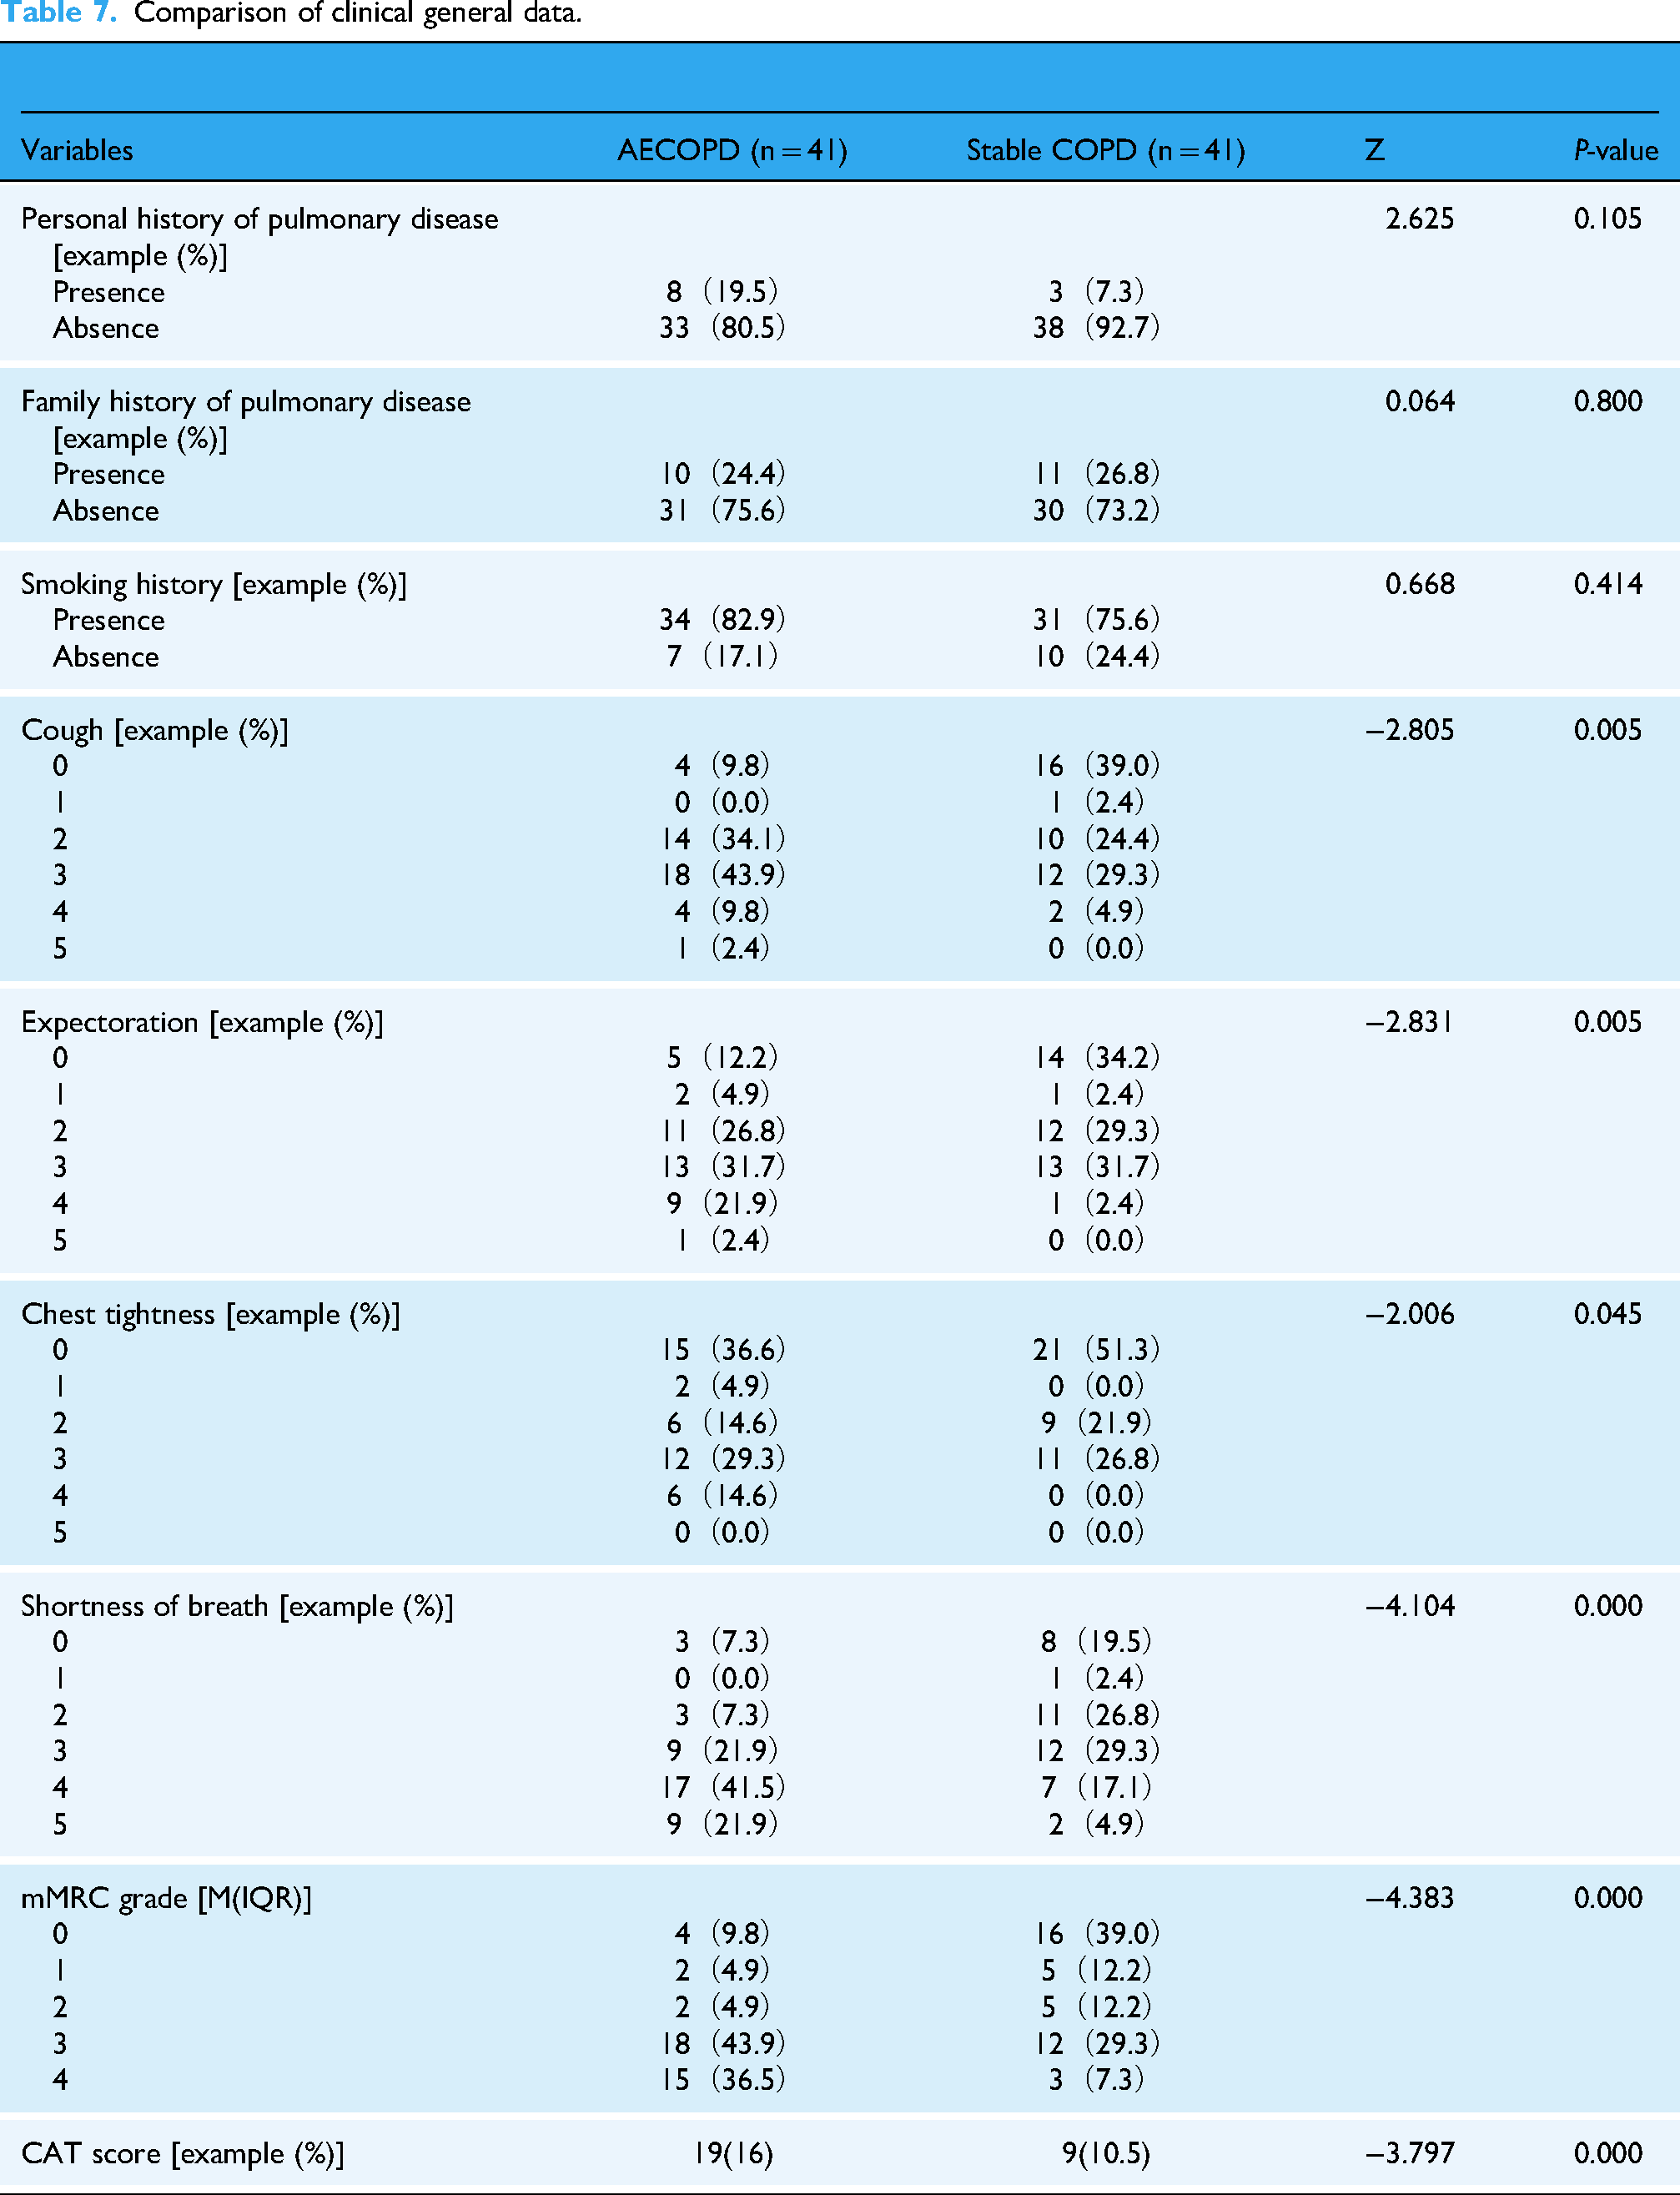
Cough, expectoration, chest tightness, and shortness of breath were assigned from 0 to 5 according to their degree. The CAT score was assigned according to the actual score, and mMRC grades were assigned from 0 to 4 degrees. 1
Comparison of clinical general data
The statistical results showed that there were statistically significant differences in cough, expectoration, chest tightness, shortness of breath, CAT score, and mMRC grade between the two groups (P < 0.05), as shown in Table 7.
Comparison of clinical general data.
Feature variable screening
Potential AECOPD predictors were screened by Lasso regression. When α = 0.1, six variables including expectoration, mMRC grade, i_Jitter, i_F2 frequency, i_Alpha Ratio, and u_H1-H2 were selected.
Establishment and evaluation of the AECOPD risk warning model
R software was used to draw the AECOPD risk warning model, as shown in Figure 8. The interpretation method is the same way as the COPD section above, and the “Probability of Disease” refers to the probability of future acute aggravation events in COPD patients.

AECOPD risk warning model.
The performance of the risk warning model was evaluated the same way as the COPD part mentioned above. Figures 9 and 10 and Table 8 show that the AUC (95% CI), accuracy, precision, recall, F1 score, and specificity of the risk warning model were 0.83 (95% CI: 0.725–0.921), 0.77, 0.76, 0.78, 0.77, and 0.76 in the test set respectively. It meant that in the test set, 78% of AECOPD patients were correctly identified, while 76% of patients with stable COPD were correctly identified.

ROC curve of the AECOPD risk warning model.

Confusion matrix of the AECOPD risk warning model.
Performance of the AECOPD risk warning model.

The Calibration curve in Figure 11 showed that the risk warning model had a high consistency between the predicted and actual probability of COPD occurrence, with an MAE of 0.028. The Decision curve in Figure 12 showed that the benefit of the risk warning model was pretty good, and it could provide valuable information for clinical decision-making within the threshold range of 0.11–81 and 0.88–0.99.

Calibration curve of the AECOPD risk warning model.

Decision curve of the AECOPD risk warning model.
Discussion
Auscultation of TCM has a long history. According to oracle bone inscriptions, it can be traced back to the Yin Dynasty that there existed an expression referred to as “sick language”. 21 Classic on Difficult Issues (Nan Jing,《难经》) asserts, “To know through listening is called sage,” that reflects the status of auscultation. 22 Jingyue's Complete Works (Jing Yue Quan Shu,《景岳全书》) records, “Voice originates from the visceral qi. When the viscera are strong, the voice will be loud and powerful; when the viscera are weak, the voice will appear timid and lackluster,” suggesting that the external sound performance by the human body is closely related to the strength or weakness of their visceral qi. 23 COPD patients suffer from long-term coughing, expectoration, and wheezing, which damages their visceral qi, thereby affecting normal voice production.
In this paper, based on the screening of general clinical data and acoustic variables by the Lasso regression method, a COPD nomogram prediction model and an AECOPD risk warning nomogram model were established. The results showed that the two models performed well in terms of consistency and benefit. It proves that the nomogram models constructed in this study can effectively help diagnose COPD and provide early warning for the risk of acute exacerbation in COPD patients.
In this study, age, smoking history, a_Jitter, e_MFCC1, and other indicators screened by Lasso regression were important indicators related to COPD, and screened indicators such as expectoration, mMRC grade, and i_Jitter were important indicators related to AECOPD. Among them, the change of acoustic frequency parameter may indicate the change of vocal cord structure, thus affecting vocalization. The change in spectral parameters may indicate an increase in the patient's phonatory resistance, requiring more energy to produce sound. 6
In terms of evaluation, the AUC, precision, recall, and F1 scores of the COPD nomogram prediction model test set were high, but the Specificity was relatively low, indicating that the model has a good overall differentiation between healthy people and COPD patients, and has a strong ability to identify COPD patients, but a slightly weak ability to identify healthy people, which may be related to the large difference in sample size between the two groups of people. When the sample size of healthy individuals is significantly smaller than that of COPD patients, the model may overly focus on the characteristics of COPD patients and insufficiently learn the features of healthy individuals. This may lead to a tendency for the model to misclassify healthy individuals as COPD patients, resulting in classification bias. The “Apparent curve” in the Calibration curve figure was close to the “Ideal curve,” and MAE was close to 0, indicating that the model displayed in the Calibration curve is relatively accurate, and the probability of the subject being predicted to be diagnosed with COPD is highly consistent with the actual diagnosis. The Decision curve showed that almost within the full threshold range, high benefits can be obtained by using this model to guide clinical decision-making, and the risk of COPD can be reduced if intervention is carried out in advance according to the predicted results. 24
The AUC of the AECOPD risk warning model test set was relatively high, while the Accuracy, Precision, Recall, F1 score, and Specificity were relatively low. This indicates that the model demonstrates good overall differentiation between acute-phase patients and stable-phase patients. However, it does not show exceptionally strong performance in identifying a specific group, possibly due to the small sample size and reduced variability in some variables caused by matching. Small sample sizes may prevent the model from adequately learning the characteristics of the two groups of patients; additionally, variable matching may obscure the natural differences between the two groups, leading to a decline in the model's generalization ability on the test set. The “Apparent curve” in the Calibration curve figure was also close to the “Ideal curve,” and MAE was close to 0, indicating that the model displayed in the Calibration curve is relatively accurate, and the predicted probability of the acute aggravation event is in high consistency with the actual occurrence. The Decision curve showed that when the threshold probability falls within 0.11–0.81 and 0.88–0.99, high benefits can be obtained by using this model to guide clinical decision-making, and the risk of acute exacerbation of COPD can be reduced if the intervention is carried out in advance according to the predicted results. However, it should be noted that the practicability of these two models still needs to be evaluated and adjusted according to the actual situation and clinical experience.
It can be seen that using convenient recording equipment to collect and analyze acoustic signals is more objective and precise than artificial “auscultation” in distinguishing the voice changes of COPD patients. The integration of speech features with clinical data in modeling has achieved the combination of TCM auscultation principles with modern medical technology, providing a scientific basis for intelligent auscultation of COPD. In particular, in the aspect of AECOPD risk warning, the model established in this study offers a new addition to the application of auscultation technology in the field of AECOPD risk assessment. It has good auxiliary diagnostic value and application prospects for people who are not able to receive routine pulmonary function tests and for the application of Internet online diagnosis and treatment.
Conclusion
This study explored integrating TCM auscultation theory with modern speech analysis for COPD predictive diagnosis and AECOPD risks. Based on Lasso feature screening and nomogram modeling, speech features were combined with clinical data to establish a COPD nomogram prediction model with a high AUC value and excellent recall performance, as well as an AECOPD risk warning model with superior precision and specificity. Key COPD predictors included age, smoking history, a_Jitter, and e_MFCC1, while expectoration, mMRC grade, and i_Jitter were linked to AECOPD risks. The calibration curves demonstrated strong consistency between predicted probabilities and actual outcomes, and decision curves further validated their clinical utility, especially for early intervention support. These models offer auxiliary COPD screening tools and advanced intelligent auscultation research, with potential for online medical applications.
Shortage and prospect
This study has several limitations. The construction of the COPD nomogram prediction model has not reached the ideal level. Some indicators, as well as the scale distribution of “Total Points” and “Probability of Disease” are not evenly distributed, and the Specificity of the model is relatively low. This may be related to the large difference in sample size between COPD patients and healthy people, the lack of some information, and the wide range of parameter magnitude. When plotting the Decision curve, the proportion of COPD patients could not match the actual prevalence rate, which may introduce some bias into the results.
In addition, the sample size of patients with acute exacerbation and stable COPD is small, and all are male, so the characteristic differences obtained by analysis and the AECOPD risk warning model are not representative and universal enough. When selecting patients with stable COPD, matching was performed based on the age, height, and weight of patients in the acute exacerbation phase. This approach helps control variables to a certain extent, but these factors may also be associated with the risk of acute exacerbation in COPD. Therefore, subsequent studies need to expand and balance the sample size, include female participants, further optimize the parameter screening process, and conduct analysis and modeling from more aspects.
At present, establishing models to explore the relationship between acoustic feature parameters and pulmonary diseases remains a challenge in diagnostic research. In recent years, deep learning has shown strong learning ability, prediction accuracy and generalization ability in studies on acoustic diagnosis of pulmonary diseases. 25 Moving forward, more advanced deep learning algorithms should be introduced to improve the overall performance of the models, and model evaluation should be conducted through external validation to guide clinical practice and provide more powerful support for intelligent acoustic diagnosis of COPD.
Footnotes
Acknowledgments
The authors would like to thank the Huadong Hospital affiliated with Fudan University, Gaohang Community Health Center and all the involved medical staff for the positive support received.
Ethical considerations
This study was approved by the Ethics Committee of Huadong Hospital affiliated with Fudan University (authorization no.20220122). The participants provided their written informed consent to participate in this study.
Author contributions
Investigation: Shuyi Zhang, Jiaojiao Sha, and Zhou Lu. Data collection: Jiaojiao Sha and Zhou Lu. Methodology: Shuyi Zhang and Yulin Shi. Analysis: Shuyi Zhang and Jiaojiao Sha. Resources: Zhou Lu, Tao Jiang, and Jiatuo Xu. Supervision: Tao Jiang, Yulin Shi, and Jiatuo Xu. Writing—original draft: Shuyi Zhang. Writing—review and editing: Shuyi Zhang, Jiaojiao Sha, and Yulin Shi. All authors have read and approved the manuscript.
Funding
The authors disclosed receipt of the following financial support for the research, authorship, and/or publication of this article. This study was supported by the National Natural Science Foundation of China (no: 82104738), the Capacity Building of Local Colleges and Universities under the Shanghai Municipal Science and Technology Commission (no: 21010504400), and the Traditional Chinese Medicine Research Projects of Shanghai Municipal Health Commission (no: 2022QN013).
Declaration of conflicting interests
The authors declared no potential conflicts of interest with respect to the research, authorship, and/or publication of this article.
Data availability statement
The datasets used and/or analyzed during the current study are available from the corresponding author upon reasonable request.
Guarantor
Zhou Lu, Yulin Shi and Jiatuo Xu