
Abstract
Background
Sarcopenia places a heavy healthcare burden on individuals and society. Recognizing sarcopenia and intervening at an early stage is critical. However, there is no simple and easy-to-use prediction tool for diagnosing sarcopenia. The aim of this study was to construct a well-performing online web calculator based on a machine learning approach to predict the risk of low lean body mass (LBM) to assist in the diagnosis of sarcopenia.
Methods
Data from the National Health and Nutritional Examination Surveys 1999–2004 were selected for model construction, and the included data were randomly divided into training and validation sets in the ratio of 75:25. Six machine learning methods— Classification and Regression Trees, Logistic Regression, Neural Network, Random Forest, Support Vector Machine, and Extreme Gradient Boosting (XGBoost)—were used to develop the model. They are screened for features and evaluated for performance. The best-performing models were further developed as an online web calculator for clinical applications.
Results
There were 3046 participants enrolled in the study and 815 (26.8%) participants with LBM. Through feature screening, height, waist circumference, race, and age were used as machine learning features to construct the model. After performance evaluation and sensitivity analysis, the XGBoost-based model was determined to be the best model with better discriminative performance, clinical utility, and robustness.
Conclusion
The XGBoost-based model in this study has excellent performance, and the online web calculator based on it can easily and quickly predict the risk of LBM to aid in the diagnosis of sarcopenia in adults over the age of 60.
Introduction
The concept of sarcopenia was first proposed in 1988 to describe the age-related loss of muscle mass and function, particularly the significant loss of lean body mass (LBM). 1 With the progress of research, the definition of sarcopenia has evolved from the initial simple loss of muscle mass to a progressive and generalized skeletal muscle disorder with loss of muscle number and mass associated with a variety of diseases. 2 The prevalence of sarcopenia varies by age, sex, and region, with prevalence rates ranging from 1% to 35%.3–6 A meta-analysis of general population studies showed that the overall prevalence of sarcopenia in healthy adults over the age of 60 was 10%. 7 Sarcopenia may be caused by the low-grade chronic inflammation that occurs with aging. 8 The prevalence of sarcopenia is likely to increase further as the population ages. Sarcopenia is associated with a wide range of adverse health outcomes, including falls, 9 fractures, 10 disability, 11 cognitive impairment, 12 and death, 13 and is associated with the progression and poor prognosis of many diseases.14,15 In addition to the health implications, sarcopenia places a serious financial burden on individuals and society. The results of a study by Janssen et al. based on data from the U.S. Census, the National Health and Nutrition Examination Survey (NHANES), and the National Health Care and Utilization Expenditures Survey showed that the direct medical costs in the United States in 2000 for sarcopenia as defined by low LBM were estimated to be $18.5 billion, or about 1.5% of total health care expenditures for that year. 16 The 10% reduction in the prevalence of sarcopenia would result in an annual savings of $1.1 billion in health-care expenditures in the United States. 16 Therefore, recognizing sarcopenia and intervening at an early stage not only helps to improve individual health but also reduces public health expenditures and the burden on the healthcare system. However, most cases of sarcopenia go undiagnosed. 17
There is no definitive consensus on the diagnosis of sarcopenia, and the core and criteria for the diagnosis of sarcopenia vary between international working groups. The European Working Group on Sarcopenia in the Elderly (EWGSOP) and the Asian Working Group on Sarcopenia (AWGS) emphasize skeletal muscle strength and mass as the basis for the diagnosis of sarcopenia.2,18 As research has progressed, EWGSOP and AWGS have increasingly emphasized the role of muscle strength and physical performance in predicting adverse health outcomes and as a main indicator of sarcopenia. The International Working Group on Sarcopenia emphasizes the combination of muscle mass and poor physical functioning. 19 The Foundation for the National Institutes of Health (FNIH), on the other hand, does not give a definition of sarcopenia but does give diagnostic criteria corresponding to the core of the diagnosis of sarcopenia: muscle strength and mass. 20 Data from the NHANES are planned to be used in this study, and therefore are referenced to the FNIH definition of sarcopenia, with LBM as necessary for the diagnosis of sarcopenia. Valid tests to assess muscle mass include whole-body dual-energy x-ray absorptiometry (DEXA), computed tomography, and magnetic resonance imaging. However, these modalities are not accepted for use by the older population or primary care providers due to financial costs, radiation, and other issues. In contrast, their more accepted diagnostic modality is based on the clinical judgment of primary care providers. 21 The availability of a simple, validated LBM assessment tool would go a long way toward improving the current situation, where screening for sarcopenia is difficult.
Machine learning (ML), an important branch of artificial intelligence, is now widely used in healthcare, manufacturing, education, and other industries to realize evidence-based decision-making. 22 Its powerful predictive performance can assist clinical practice in making data-based decisions. The aim of this study is to develop the first online prediction tool for LBM using ML based on data that can be simply collected in the community. This online tool can be used to assist in community screening for sarcopenia and early intervention in high-risk populations, helping to improve individual health and reduce public health expenditures.
Materials and methods
Data sources and study population
Data for this study were obtained from NHANES, a cross-sectional study conducted by the National Center for Health and Nutrition Statistics to assess the health and nutritional status of various segments of the U.S. population. Since 1999, it has been conducted annually among a representative sample size of approximately 5000 people of all ages, races, regions, and socioeconomic backgrounds in the United States, and data are published on a two-year cycle. Three cycles of data from 1999–2004 containing whole-body data measured by DXEA were included in this study. Data from whole-body scans were collected on a Hologic QDR-4500A fan-beam densitometer (Hologic, Inc., Bedford, Massachusetts) using Hologic software version 8.26:a3*. For simplicity and ease of use of the model, only general demographic characteristics, body measurements, and common chronic disease status of patients were included, specifically: gender, age, race, height, weight, waist circumference, arm circumference (ARMC), body mass index (BMI), hypertension, and diabetes mellitus. Variables that can be obtained quickly and at a low cost were included as potential characteristics of the model. For age, those over 85 years were counted as 85. Race was categorized as Mexican American, Other Hispanic, Non-Hispanic White, Non-Hispanic Black, and Other.
The determination of LBM in this study was based on the criteria recommended by the FNIH sarcopenia foundation: skeletal muscle mass index (SMI) < 0.789 in men or <0.512 in women. 20 Appendicular skeletal muscle mass (ASM) was obtained using the sum of the limb lean mass data from the whole-body scan data obtained by calculating DXA. Extremity lean mass data included left arm lean mass, left leg lean mass, right arm lean mass, and right leg lean mass, and we excluded data for which there were missing extremity limbs and no lean mass data. The ASM was further adjusted for BMI to calculate SMI, and SMI was used to define LBM.
Inclusion criteria: age ≥60 years. Exclusion Criteria: 1. pregnancy; 2. self-reported history of shadowgraphic contrast agent use within the past 7 days; 3. self-reported weight greater than 450 lbs or height greater than 6′5″; 4. presence of missing limb data; and 5. Presence of missing values in the pooled data.
The data analyzed in this study were obtained from the NHANES public database, a publicly available dataset provided by the National Center for Health Statistics (NCHS) of the U.S. Centers for Disease Control and Prevention and available on the website (http: //www.cdc.gov/nchs/nhanes.htm). All data collection procedures were reviewed and approved by the NCHS Research Ethics Review Board and were de-identified to ensure participant privacy. Therefore, no additional ethical approval from our institution was required for our study. In addition, the informed consents of all patients were obtained, as details can be found at https://wwwn.cdc.gov/nchs/nhanes/continuousnhanes/documents.aspx?BeginYear=1999, https://wwwn.cdc.gov/nchs/nhanes/continuousnhanes/default.aspx?BeginYear=2001, and https://wwwn.cdc.gov/nchs/nhanes/continuousnhanes/default.aspx?BeginYear=2003.
Statistical analysis
Continuous variables were analyzed using the independent t-test or Mann–Whitney U test. Normally distributed continuous variables are expressed as mean ± standard deviation, and non-normally distributed continuous variables are expressed as median (interquartile range). Categorical variables were analyzed using the chi-square test or Fisher's test and expressed as percentages. All statistical analyses were performed in R software using the “CBCgrps” package.
Model construction, evaluation, and validation
Data from three cycles of NHANES (1999–2004) were included for analysis, and the included data were randomly divided into training and validation sets in a ratio of 75:25. We used the extracted variables as potential features for ML analysis. Since the goal of this study is to construct a simple prediction tool for LBM, we need to screen the features included in the model. In this study, the characteristics were screened by first analyzing the variance of univariate factors and then constructing a multifactor regression model. For the variables screened by the multifactor regression model that are meaningful for identifying LBM, correlation tests are further conducted to clarify whether there is a significant correlation between the variables. If there is a significant correlation between variables, backward stepwise regression is used to filter out the variables that are more significant for identifying LBM, and the variables that are not significant for identifying LBM are excluded from the correlated variables. In addition, to clarify whether there was a nonlinear relationship between the variable and the outcome, we used restricted cubic spline (RCS) to analyze it. A p < 0.05 for the nonlinearity test between the variable and the outcome would indicate that there is a nonlinear relationship between the variable and the outcome.
Classification and Regression Trees (CART), Logistic Regression (LR), Neural Network (NNet), Random Forest (RF), Support Vector Machines (SVM), and Extreme Gradient Boosting (XGBoost), which are six ML methods, are used to construct the classification models. Going through these six different modeling strategies and assumptions helps to fully evaluate the performance of each method and find the method that best fits our data and problem. Classification and Regression Tree is an easy-to-interpret model that can effectively deal with nonlinear relationships and interactions between variables. The simplicity and ease of interpretation of LR, a classical linear model, make it ideal for dealing with binary classification problems. Neural Network is able to capture complex nonlinear relationships and is particularly suitable for handling large-scale datasets and high-dimensional features. Random Forest improves prediction accuracy (ACC) by integrating multiple decision trees and has good resistance to overfitting. Support Vector Machine performs well on high-dimensional data, especially in determining the optimal classification boundaries. Extreme Gradient Boosting is known for its efficient implementation of gradient boosting and excellent performance in several competitions, demonstrating strong processing power. The method selected for this study is better suited to the scale and characteristics of clinical data than other state-of-the-art algorithms such as Convolutional Neural Networks (CNN) and Transformer. Despite CNN's excellent performance in image data processing and Transformer's strengths in natural language processing and time series data, they may not be as effective as the method selected for this study in processing one-dimensional clinical data and do not have an advantage in terms of training time and computational resources.23,24 In summary, the ML methods chosen in this study are not only adapted to the characteristics of clinical data but have been widely used in clinical research, proving their effectiveness and usefulness on such data.
Ten-fold cross-validated resampling is performed to ensure the stability and repeatability of model performance. The receiver operating characteristic (ROC) curve is used to evaluate the predictive performance of the model, and the higher area under the curve (AUC) of the ROC indicates better discrimination in the model. Accuracy, precision, recall, F1-Score, Kappa, and Matthew’s correlation coefficient (MCC) values are used as complementary indications of the model's predictive ability. The closer these statistics are to 1, the better the predictive performance of the model. This study further evaluated the clinical utility of the model in decision-making, as represented by decision curve analysis. In addition, we performed a sensitivity analysis to evaluate the robustness of the model. The AUC value was used as the main evaluation metric, and the statistical indicators were combined to derive the best ML model. For the best ML model, Shapely Additive exPlanations (SHAP) is used to specify feature importance. In addition, we further build an online web calculator to facilitate the application of the model. The online web calculator is built based on the “shiny” package. Finally, validation was performed based on gender subgroups, and ROC curves were used to indicate discrimination performance.
All statistical analyses, model construction and validation, and development of the online web calculator in this study were implemented in R software (version 4.3.2).
Results
After screening based on the inclusion and exclusion criteria, 3046 participants were finally included in the study, and the whole process of screening and analysis is shown in the flowchart (Figure 1). Lean body mass was present in 26.8% (n = 815) of the participants in this study; 22.4% of all female participants had LBM, compared to 30.2% of male participants. The median age of participants in the LBM group was 72 (66, 80), significantly greater than 69 (64, 76) in the non-LBM group. The LBM group had lower height [161.9 (154.4, 167.8) vs. 168.6 (161, 175.5)], higher BMI [29.36 (26.56, 32.89) vs. 26.77 (23.99, 30.15)], thicker waist circumference [104 (96.6, 113.15) vs. 98.6 (90, 107.3)], and thicker ARMC [32.2 (30, 35.3) vs. 31.8 (29, 34.6)]. The risk of LBM was more pronounced in the diabetic population: 22% of the diabetic population in the LBM group versus only 16% in the non-LBM group. The baseline characteristics of all participants included in the study are shown in Table 1. All participants included in the study divided the entire dataset into a training set and a validation set in a ratio of 75:25. There were 2284 participants included in the training set, of whom 615 (26.9%) had LBM.

Flowchart of data screening and analysis.
Characteristics of patients included in the study.

LBM: low lean body mass; Height: standing height; Waist: waist circumference; BMI: body mass index; ARMC: arm circumference; HBP: high blood pressure.
The results of the univariate analysis of variance in the training set indicated significant differences between the LBM and non-LBM groups in gender, age, race, height, BMI, waist circumference, ARMC, and diabetes mellitus (p < 0.05). These eight variables were included in a multivariate regression model, and the results of the multivariate regression analysis indicated that gender, age, race, height, and waist circumference were high risk factors for LBM (Figure 2(a)). Next, the correlation between these five variables was tested, and the results indicated a significant correlation between gender and height (Figure 2(b)). We further used backward method stepwise regression to analyze the importance of these five variables for identifying the risk of LBM, and the results showed that the importance was in the order of height, gender, waist circumference, race, and age. Combined with the correlation between the variables, we excluded the variable of gender and finally included the four variables of height, waist circumference, race, and age as the features for ML in the model. The results of the RCS analysis showed a nonlinear relationship between height, waist circumference, and LBM: p < 0.001 for the nonlinear test of height and p = 0.028 for the nonlinear test of waist circumference (Figure 3).

Multifactor regression forest plots and correlation analysis hotspots. (a) Forest plot of the results of the multifactor regression analysis. (b) Hotspot plot of correlation coefficients between variables.
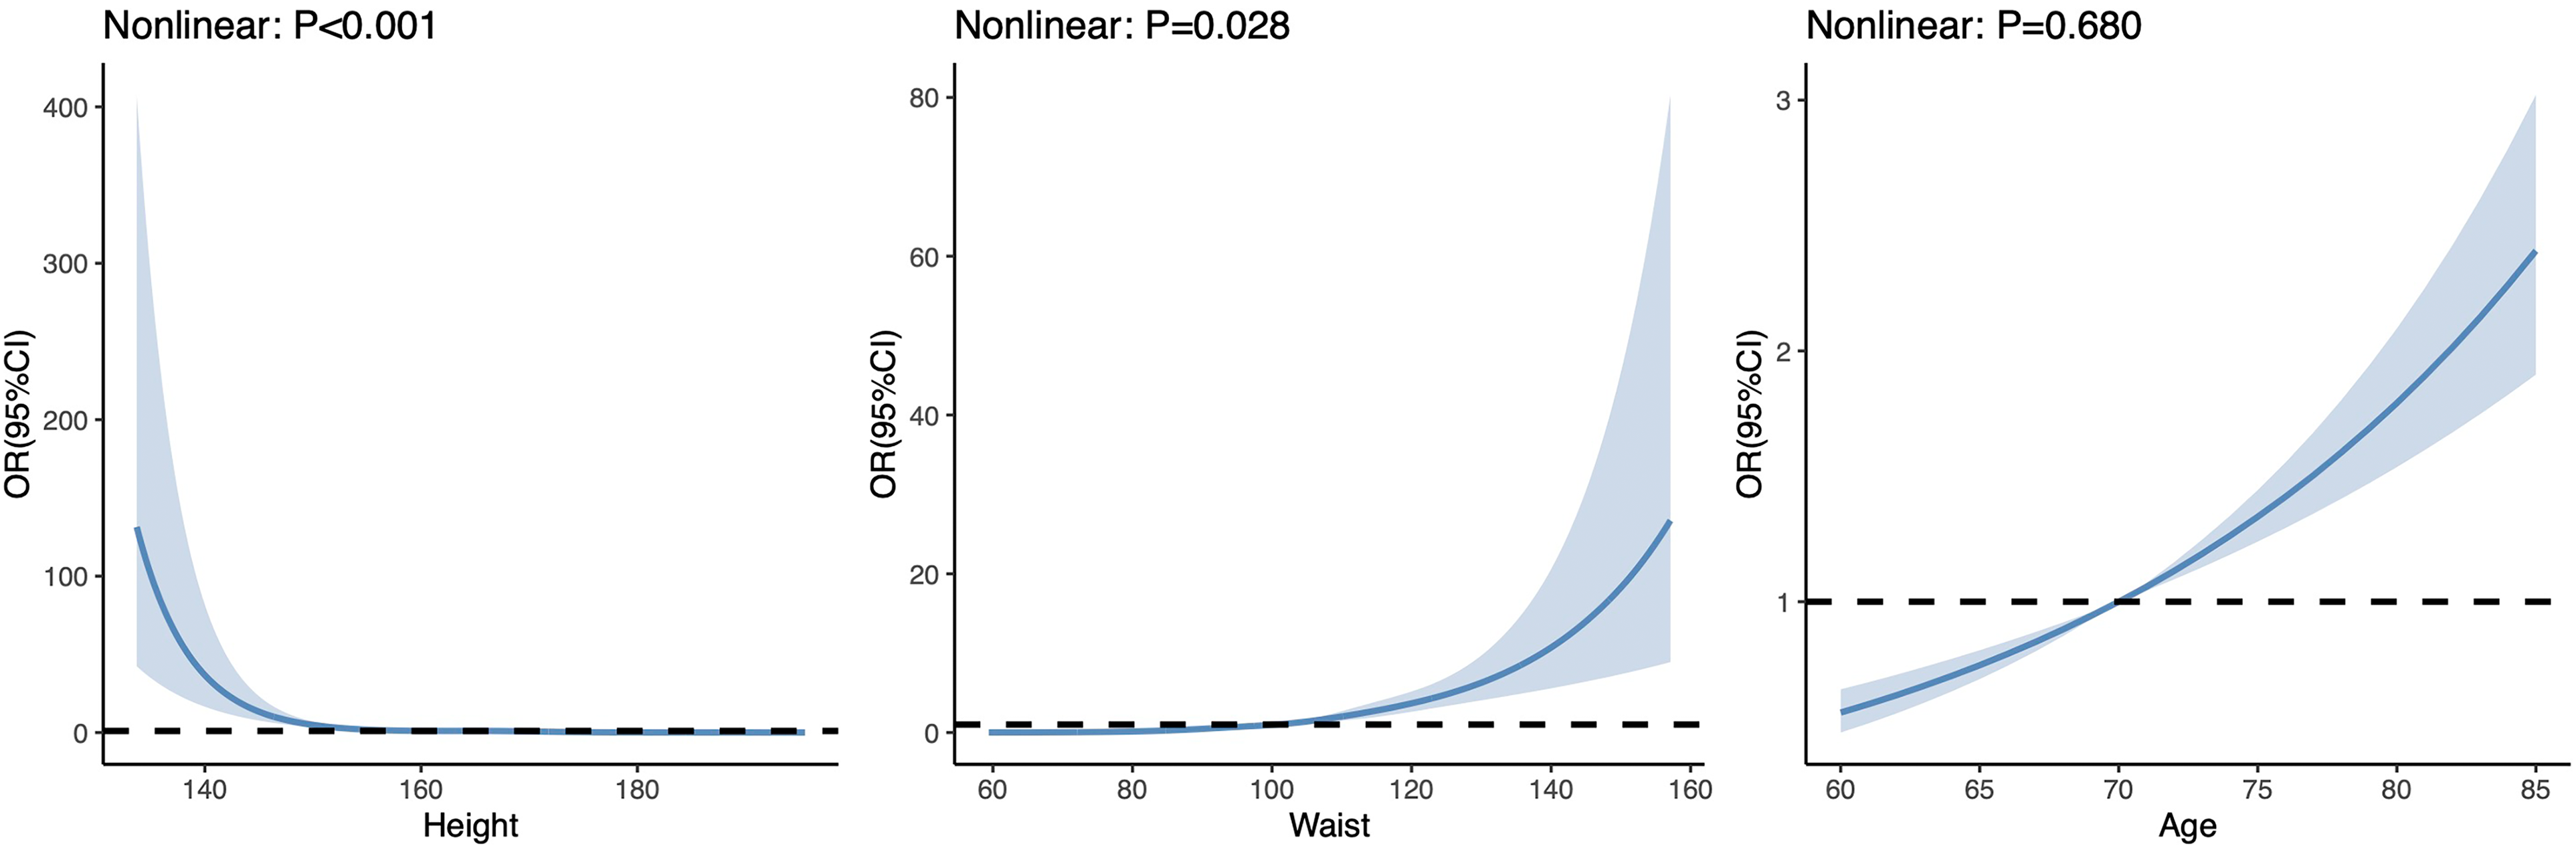
Restricted cubic spline plots between each variable and LBM.
The performance of the models constructed by each method was determined by resampling with 10 ten-fold cross-validation. Receiver operating characteristic curves were plotted (Figure 4(a) and Figure 4(b)), and AUC values were calculated. For AUC values, CART, LR, NNet, RF, SVM, and XGBoost are: 0.862, 0.833, 0.841, 0.953, 0.832, and 0.873 in the training set, and 0.854, 0.827, 0.833, 0.832, 0.812, and 0.855 in the validation set (Table 2). For ACC values, CART, LR, NNet, RF, SVM, and XGBoost were: 0.76, 0.739, 0.764, 0.849, 0.753, and 0.805 in the training set; and 0.748, 0.769, 0.72, 0.776, 0.744, and 0.772 in the validation set (Table 2). For precision values, CART, LR, NNet, RF, SVM, and XGBoost were: 0.534, 0.509, 0.542, 0.65, 0.526, and 0.606 in the training set; and in the validation set were: 0.512, 0.546, 0.48, 0.555, 0.509, and 0.546 (Table 2). For the recall values, CART, LR, NNet, RF, SVM, and XGBoost are: 0.852, 0.836, 0.8, 0.95, 0.828, and 0.789 in the training set; and 0.83, 0.715, 0.795, 0.73, 0.715, and 0.77 in the validation set (Table 2). For F1-score, CART, LR, NNet, RF, SVM, and XGBoost were: 0.657, 0.633, 0.646, 0.772, 0.643, and 0.685 in the training set; and in the validation set were: 0.633, 0.619, 0.599, 0.631, 0.595, and 0.639 (Table 2). For Kappa values, CART, LR, NNet, RF, SVM, and XGBoost were: 0.486, 0.448, 0.479, 0.665, 0.469, and 0.548 in the training set; and in the validation set were: 0.458, 0.458, 0.404, 0.474, 0.415, and 0.479 (Table 2). For MCC values, CART, LR, NNet, RF, SVM, and XGBoost were: 0.518, 0.481, 0.499, 0.692, 0.497, and 0.558 in the training set; and in the validation set were: 0.492, 0.469, 0.437, 0.486, 0.430, and 0.497 (Table 2).
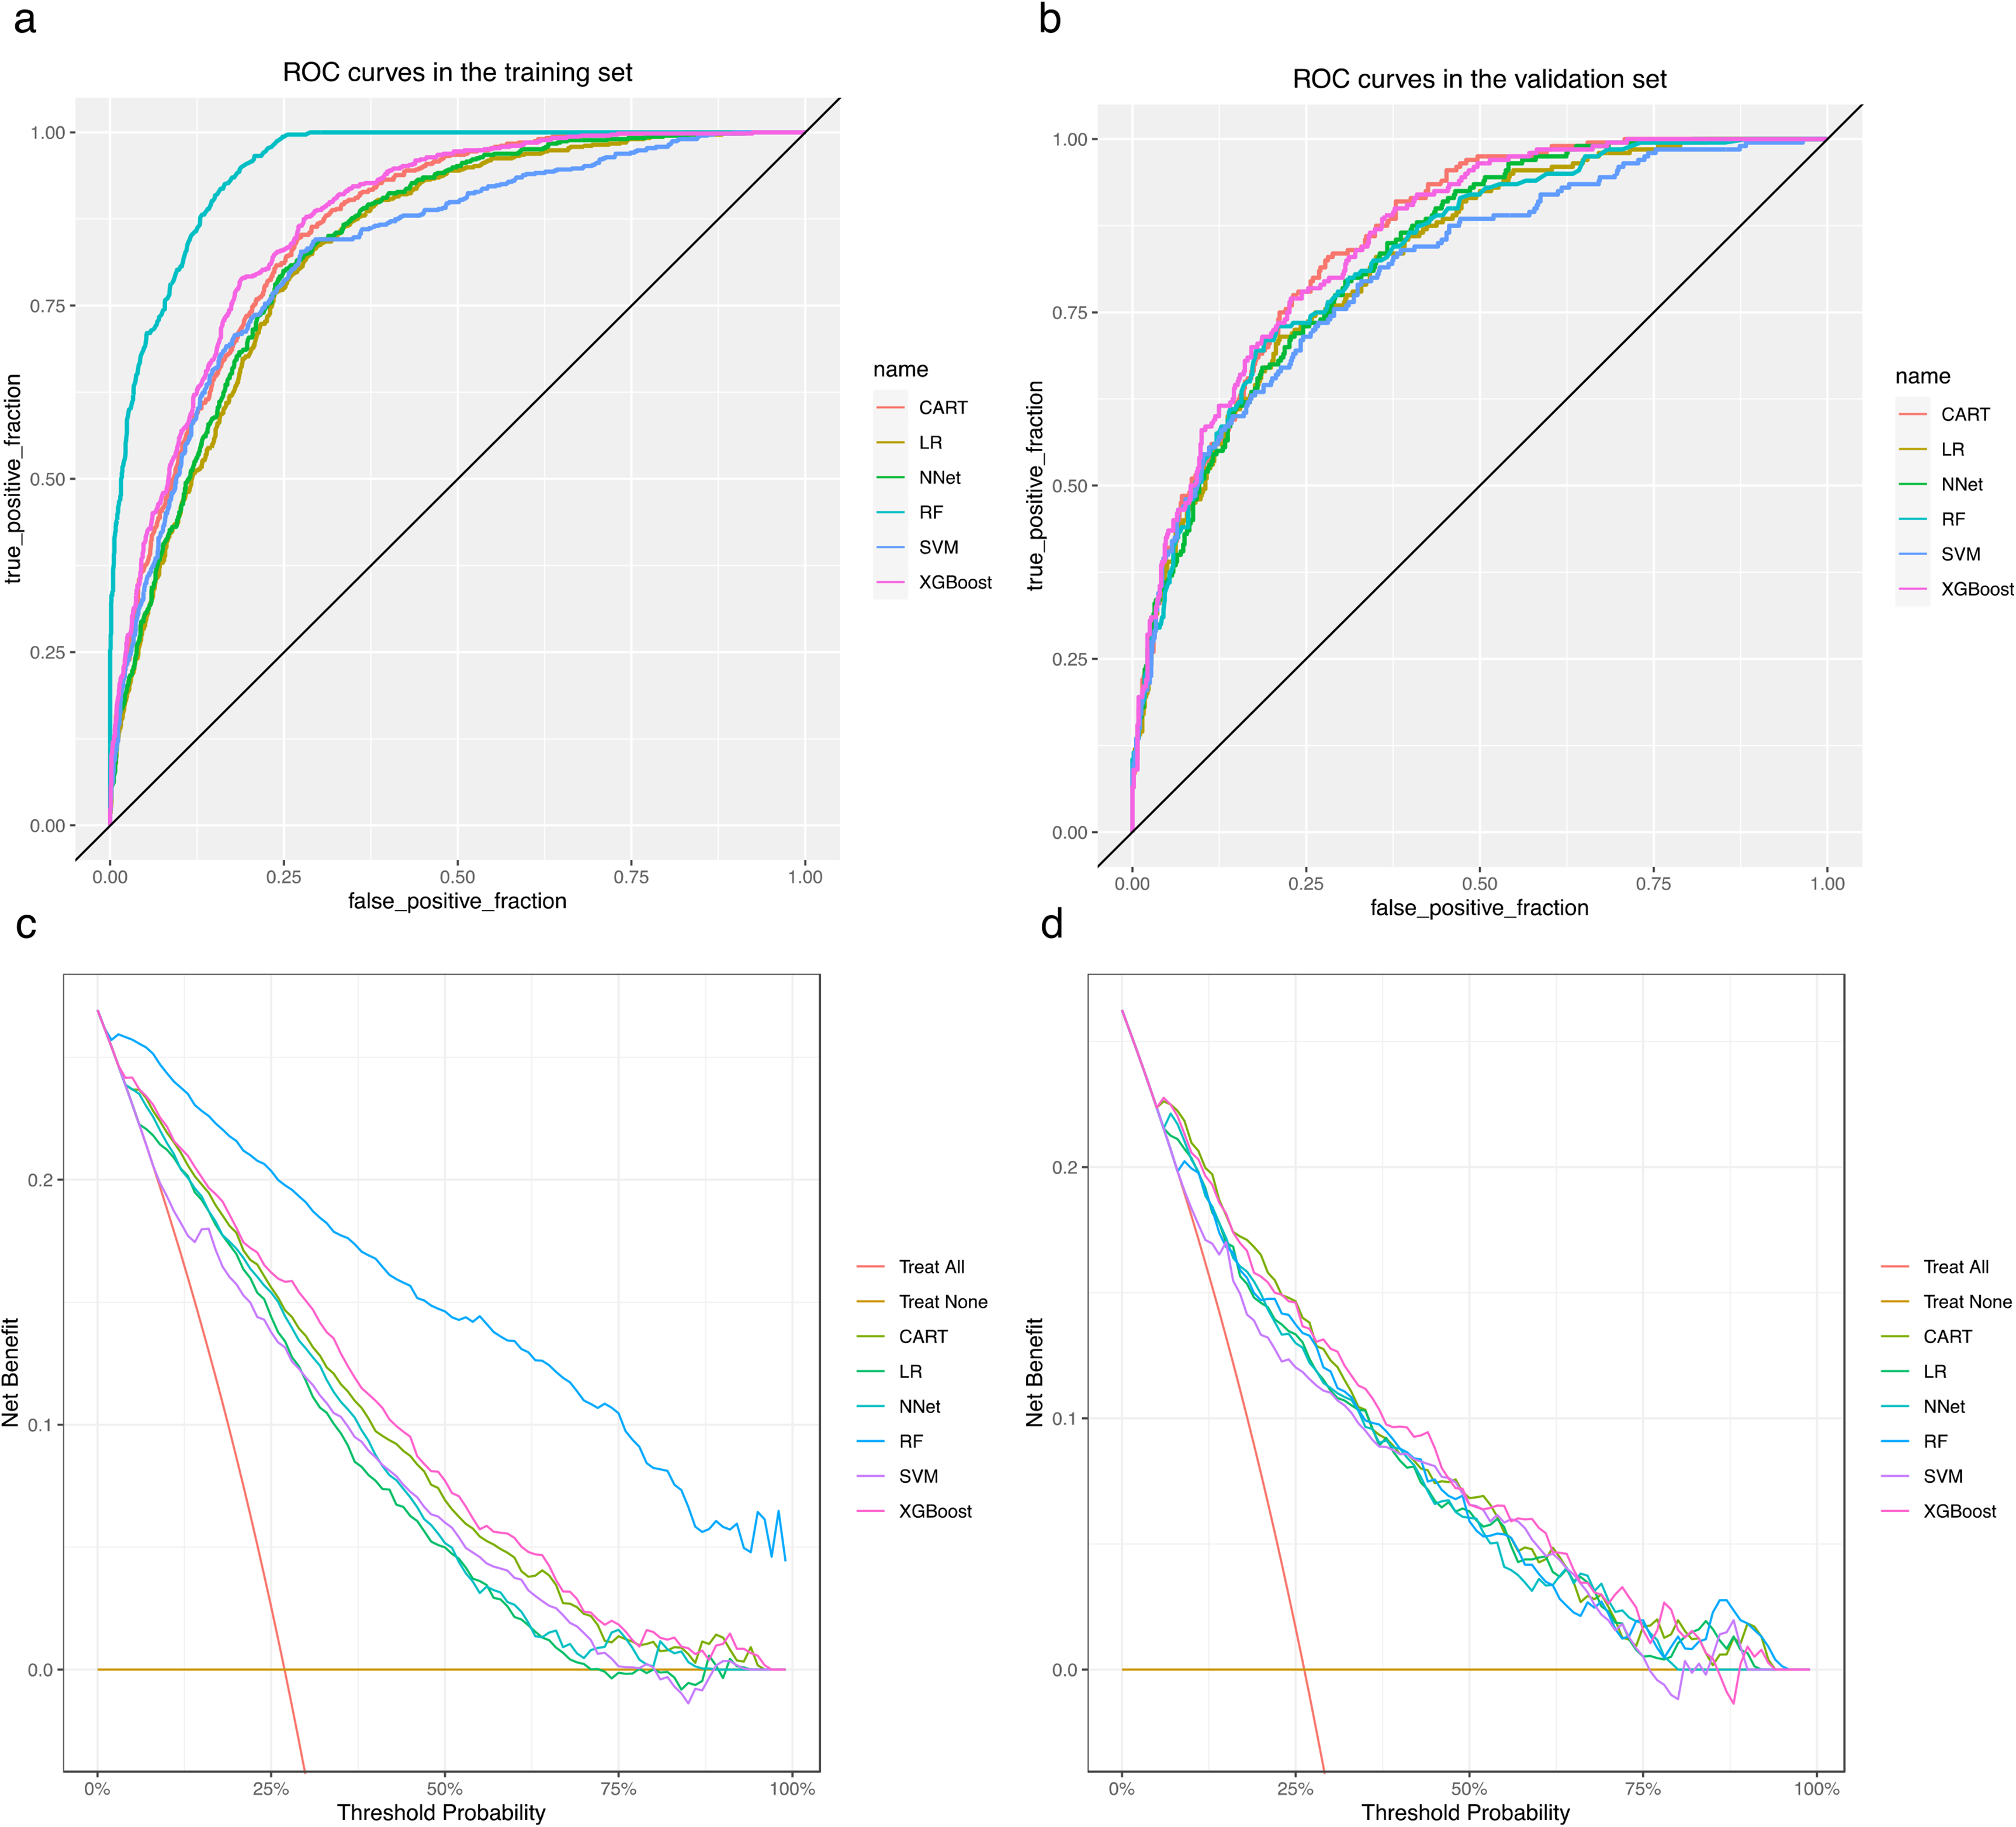
Receiver operating characteristic (ROC) and DCA curves for each model in the training and validation sets. (a) ROC curves in the training set. (b) ROC curves in the validation set. (c) DCA curves in the training set. (d) DCA curves in the validation set.
Evaluation metrics of the models constructed by each method.

Tra: training set; Val: validation set; CART: Classification and Regression Tree; LR: Logistic Regression; NNet: Neural Network; RF: Random Forest; SVM, Support Vector Machine; XGBoost, Extreme Gradient Boosting; AUC: area under the curve; MCC: Matthew’s correlation coefficient.
The DCA curves show that each model is able to achieve higher net returns than the “all intervention” or “no intervention” strategies within a wide range of prediction thresholds, both in the training set (Figure 4(c)) and in the validation set (Figure 4(d)). The results of the sensitivity analysis show that the CART and RF models are less robust, while the LR, NNet, SVM, and XGBoost models are more robust (Figure 5). Combining all the indicators, although the RF model has a better discriminative performance in the training set; however, the performance in the validation set and the results of the sensitivity analysis show that its robustness is poor. As a result, the ML model of the XGBoost method was rated as the best model for possessing better robustness and the best discriminative performance and clinical benefit except for the RF model. The importance of the features in this model was interpreted based on SHAP, and a summary plot of the SHAP values was plotted, which showed that the importance of the features in this model was in the following order: height, waist, race, and age (Figure 6). We further developed an online web calculator based on the ML model of the XGBoost approach to predict the risk of low LBM in adults over 60 years of age (Figure 7, https://jialeguo.shinyapps.io/low_lean_body_mass/). The AUC values for this prediction tool were 0.915 (95% confidence interval [CI], 0.900–0.930) and 0.880 (95% CI, 0.856–0.904) in the training set of male and female patients, respectively; and in the validation set of males and females, 0.893 (95% CI, 0.863–0.923) and 0.882 (95% CI, 0.841–0.924) (Figure 8).

Sensitivity analysis of the models. (a) Sensitivity analysis of CART model performance. (b) Sensitivity analysis of LR model performance. (c) Sensitivity analysis of NNet model performance. (d) Sensitivity analysis of RF model performance. (e) Sensitivity analysis of SVM model performance. (f) Sensitivity analysis of XGBoost model performance. CART: Classification and Regression Tree; LR: Logistic Regression; NNet: Neural Network; RF: Random Forest; SVM, Support Vector Machine; XGBoost, Extreme Gradient Boosting.

Summary plot of SHAP values for the model based on XGBoost. The vertical coordinate ranks the importance of the features according to the importance of the variables from highest to lowest, with the more highly ranked variables being more important to the model. The horizontal coordinate responds to the SHAP value corresponding to each point (i.e., each study participant), and the color of each SHAP value point indicates whether the observation is high (purple) or low (yellow). XGBoost: Extreme Gradient Boosting; SHAP: Shapely Additive exPlanation.
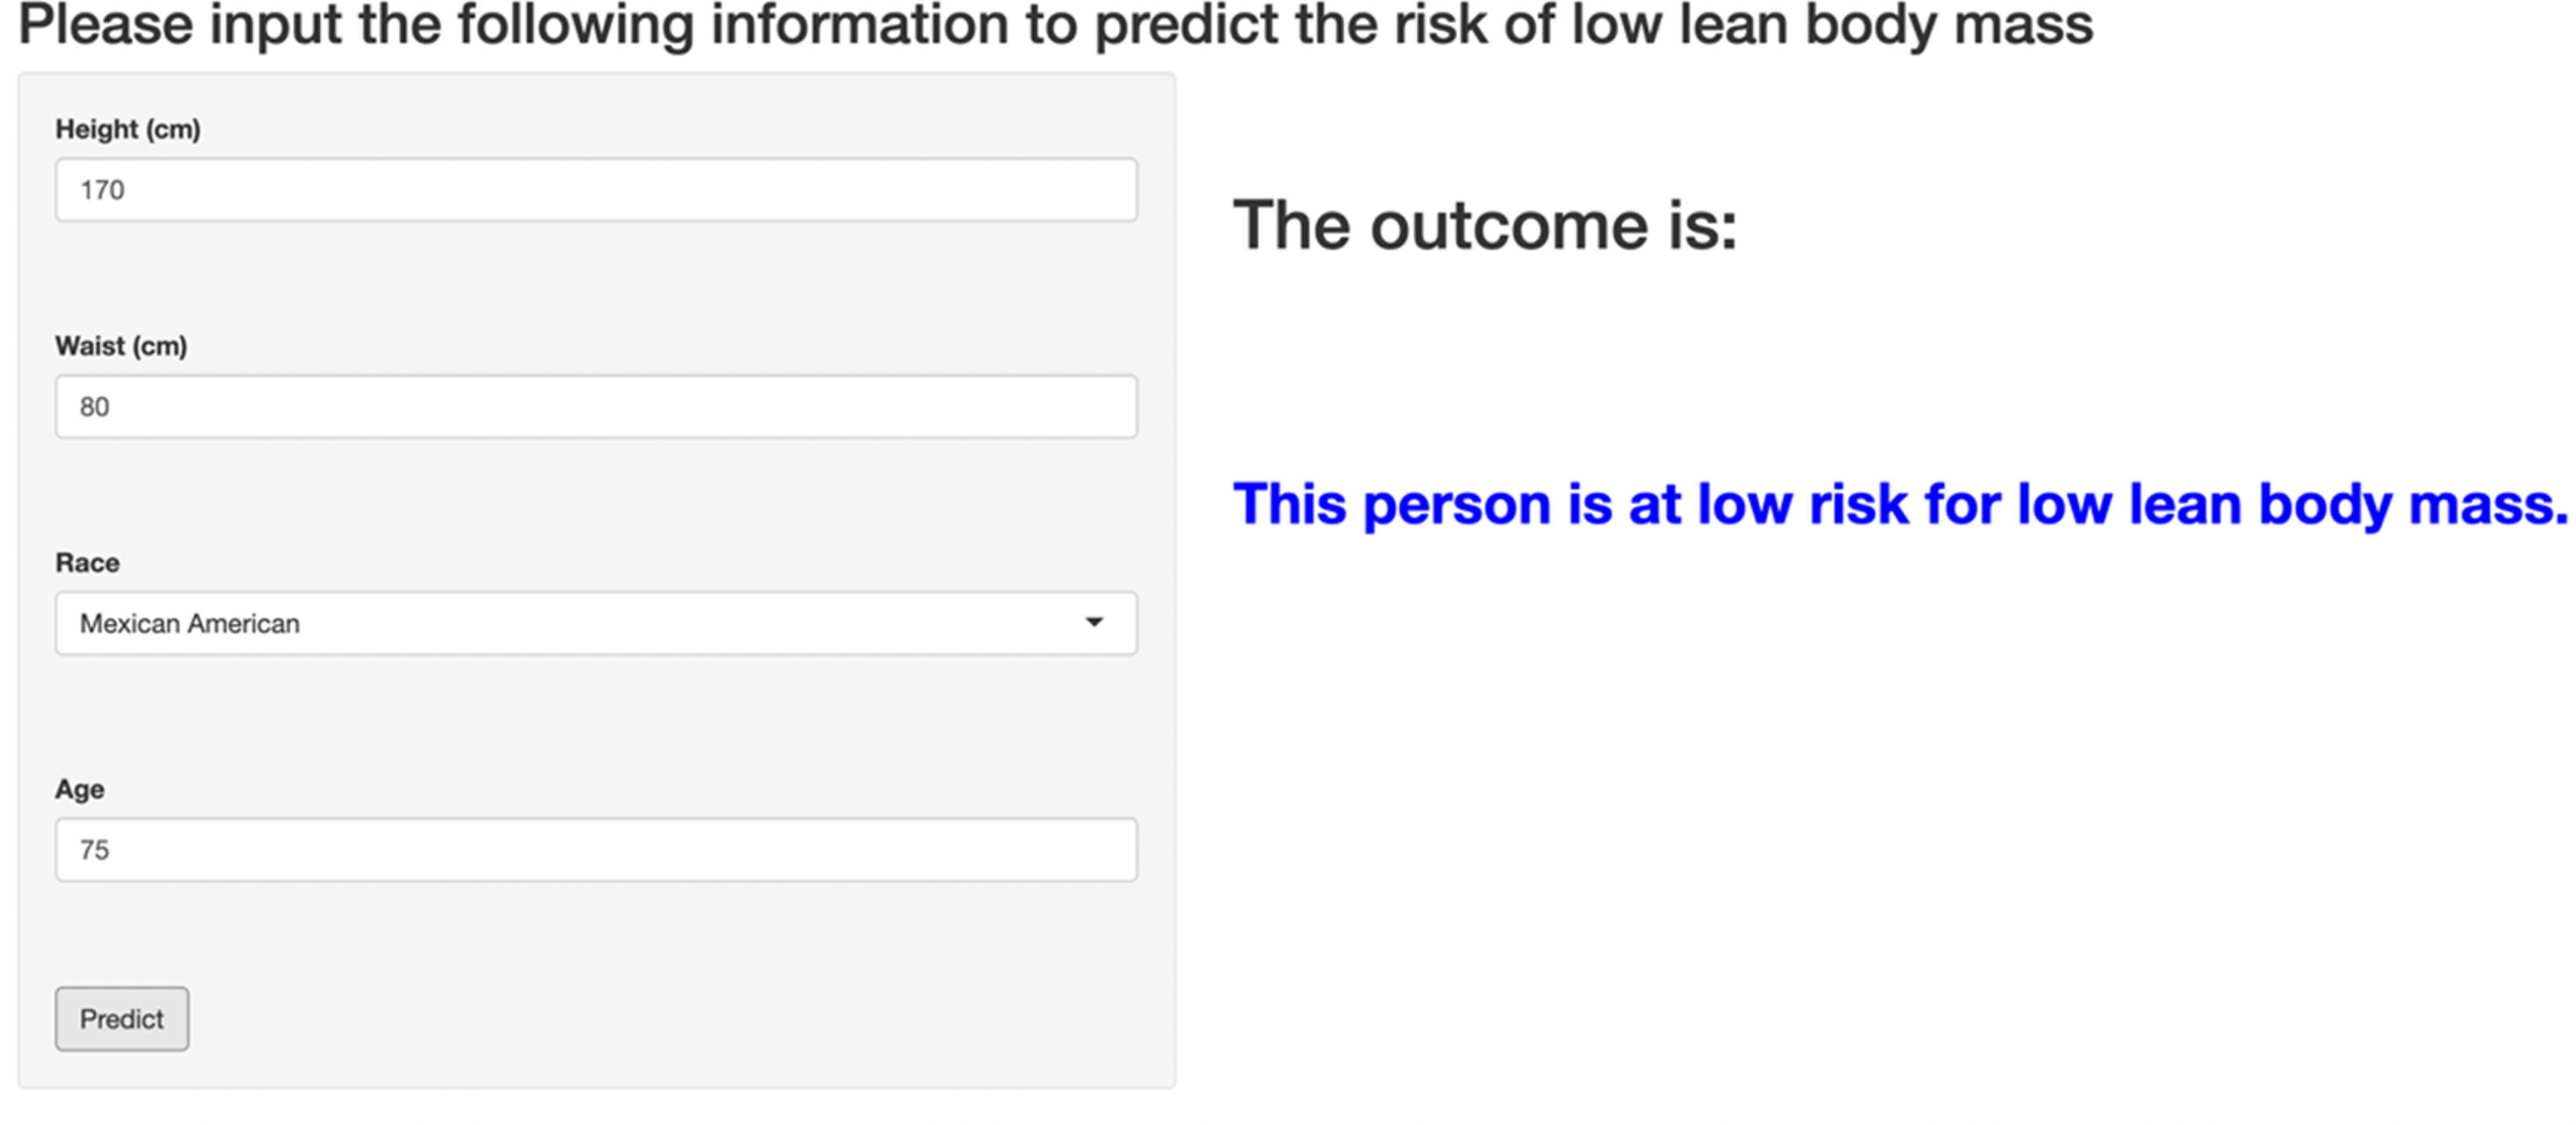
An online web calculator based on XGBoost machine learning model. The left sidebar panel contains four input rows and an action button, from top to bottom, height, waist, race, age, and “predict” button. For the height, waist, and age input rows, you can enter your specific height (cm), waist (cm), and age (years) in this row; for the race input row, you can select the corresponding race in this row, which contains “Mexican American,” “Other Hispanic,” “Non-Hispanic White,” “Non-Hispanic Black,” and “Other Race.” Once these four input rows have been entered, the risk of LBM can be predicted by clicking the “predict” button at the bottom of the left sidebar panel. Once clicked, the corresponding risk is output on the right side: high risk or low risk. XGBoost, Extreme Gradient Boosting.
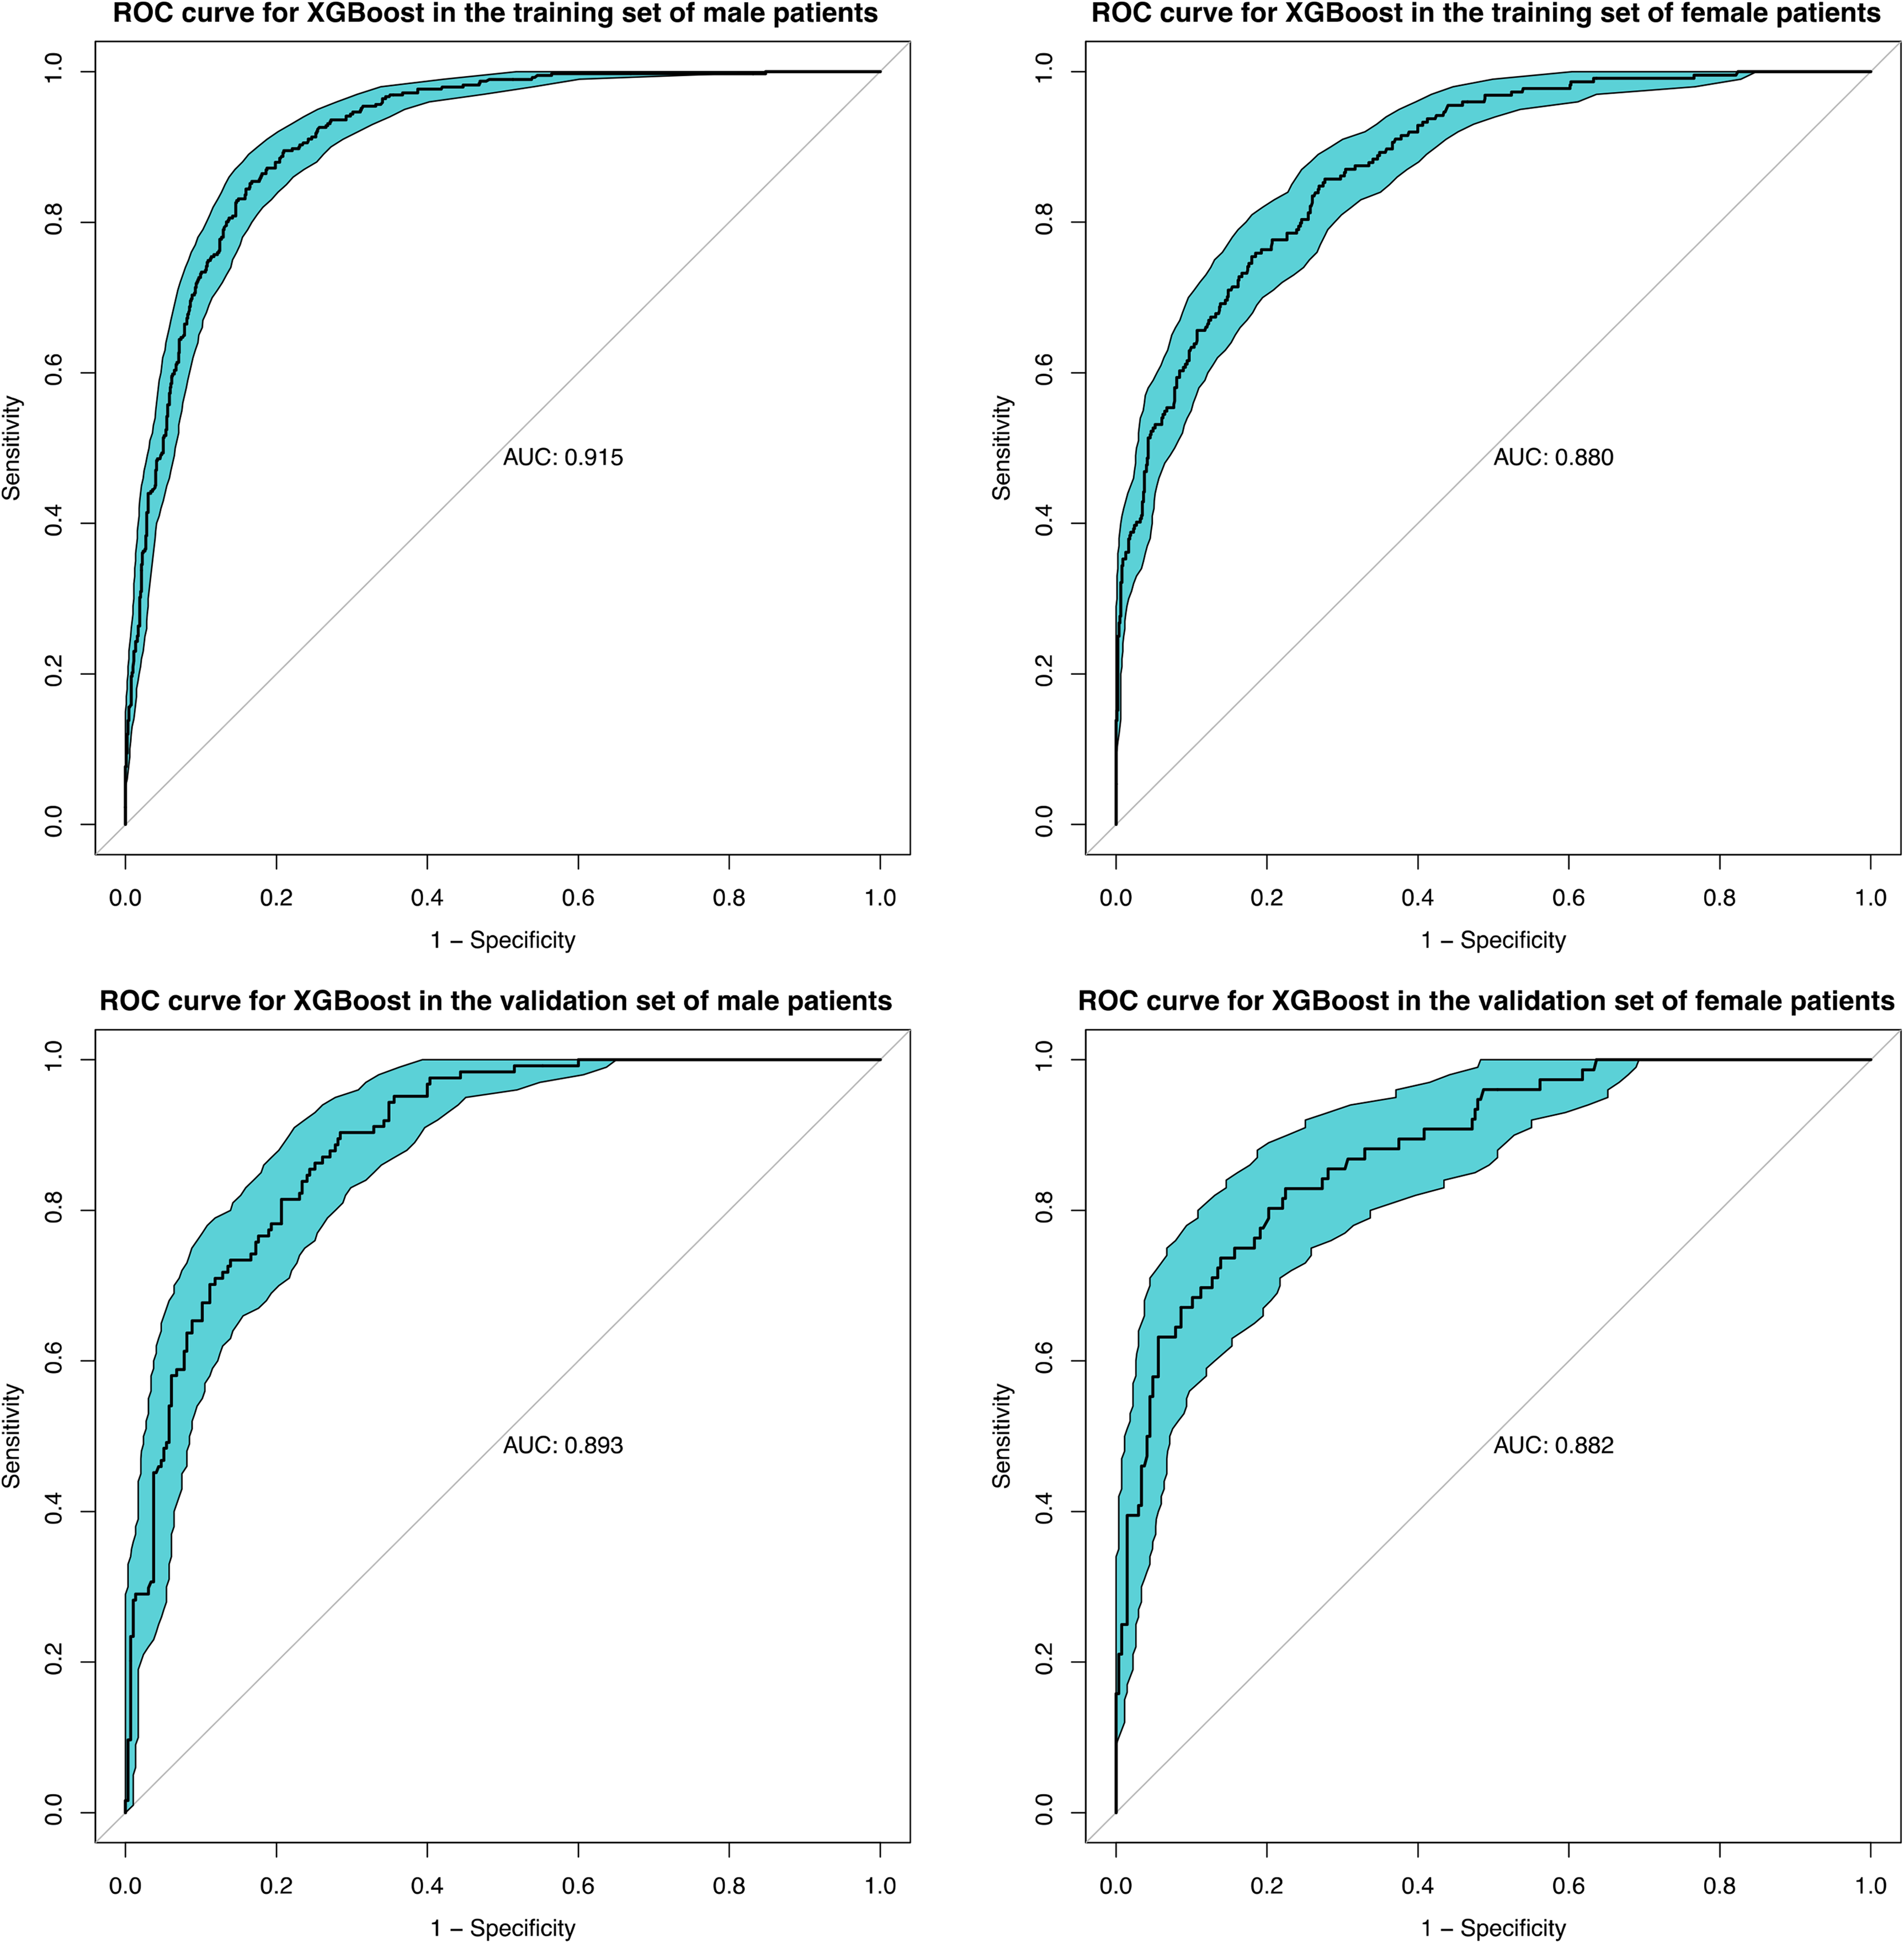
Receiver operating characteristic (ROC) curves of XGBoost model in different gender subgroups. XGBoost, Extreme Gradient Boosting.
Discussion
In this study, we use six ML methods, CART, LR, NNet, RF, SVM, and XGBoost, to construct classification models. The features included in the model were screened for high-risk factors for LBM by including variables with univariate analysis of variance p < 0.05 in a multivariate regression model, and then screened by performing correlation tests and eliminating correlated and relatively unimportant variables. Eventually the four variables height, waist circumference, race, and age were used as features for ML. The results of the RCS showed a nonlinear relationship between height, waist circumference, and LBM. The performance and robustness of each model is then evaluated based on 10 times 10-fold cross-validation resampling to ensure the robustness of the model performance. Finally, the model based on the XGBoost ML method has better performance in both the training and validation sets while having better robustness. The AUC, ACC, Precision, Recall, F1-score, KAPPA, and MCC of the model in the training set are 0.873, 0.805, 0.606, 0.789, 0.685, 0.548, and 0.558, respectively, and in the validation set are 0.855, 0.772, 0.546, 0.77, 0.639, 0.479, and 0.497. The SHAP-based interpretation of the model illustrates that for this XGBoost model the importance of the features is height, waist circumference, race, and age in that order. In addition, the constructed model was further developed into an online web calculator for ease of use. Finally, the performance of the model was tested in different gender subgroups and showed good predictive performance in both male and female populations. Based on this web-based calculator, patients at high risk of LBM can be easily and quickly identified to assist in the diagnosis of sarcopenia, and public health expenditure can be reduced while intervening at an early stage to improve an individual's health status.
Machine learning has been progressively applied to predict a wide range of musculoskeletal disorders, such as osteoporosis, with better predictive performance compared to traditional prediction tools. 25 Several prediction models have been used to predict the risk of sarcopenia in older adults. Ryu et al. used chest X-rays to identify the risk of sarcopenia based on a deep learning approach in South Korea, and the AUC values of the model in the training and validation sets were 0.813 and 0.780, respectively. 26 Yang et al. developed a nomogram for the prediction of sarcopenia based on 633 Chinese adults over the age of 60 with AUC values of 0.974 and 0.968 in the training and validation sets, respectively. 27 Zhang et al. used artificial intelligence to predict the risk of sarcopenia based on multiple clinical characteristics and experimental results in a large cohort study of 4057 adults aged 50 years or older in China, and the best model had AUCs of 0.916 and 0.882 in the training and validation sets, respectively. 28 However, the diagnostic modalities of sarcopenia in these studies require further research: all were based on bioelectrical impedance analysis testing, which is influenced by various factors such as hydration status, food intake, and fat distribution and tends to overestimate muscle mass in the older population.29,30 The study by Bae et al. has similar shortcomings. This was a study that used Korean National Physical Fitness Award data to predict the risk of sarcopenia based on a deep learning model with 87.55% ACC, 85.57% precision, 90.34% recall, and an F1 score of 87.89%. The determination of ASM in this study was based on anthropometric data using a correlation formula, and this approach to determining sarcopenia also lacks validation. 31 In contrast, Kim et al. used eye examination and demographic data from the Korean National Health and Nutrition Examination Survey (NHANES) to identify the abundance of sarcopenia. Determination of sarcopenia in this study was based on DEXA measurements, and like us, an online web calculator was developed for ease of use. 32 However, the findings of this study may be more relevant for specialized ophthalmologists to screen for sarcopenia, and there are difficulties in screening for sarcopenia in the general community. In addition, these studies were conducted in Asian populations, and the prevalence and diagnosis of sarcopenia vary somewhat among populations in different regions, so the results of these studies are not necessarily applicable to the U.S. region. All of these models incorporate many variables that are difficult to capture in the community, and there are many limitations in the application of the models, as well as a lack of tools developed to facilitate their use. The study by Luo et al. was based on data collected from a population in the US region using ML methods to develop models to predict the risk of sarcopenia, similar to ours. 33 The definition of sarcopenia in this study was also based on DXA measurements, as we were, and it further stratified sarcopenia. The AUC for possible sarcopenia meeting one diagnostic criterion was 0.716, and for sarcopenia meeting two diagnostic criteria, the AUC was 0.915. However, the number of variables included in this study was large, encompassing multiple chronic disease states, medication use, physical measurement data, and laboratory test results. As with previous related studies, there was no further development of tools for ease of use, the number of features in the model was large and complex, and there were many difficulties in the utility of the model. Interpretation and application of ML models are two of its major dilemmas, and the development of an online web calculator can help with clinical applications. 34 In contrast, our study was the first to develop an online web-based calculator, and the variables included were simple, with only height, waist circumference, and BMI being collected to predict the risk of LBM. The predictive performance of the model was also improved over previous related studies. The results in this study showed a nonlinear relationship between two variables, height and waist circumference, and LBM. This may be the reason why the ML model in this study showed to possess better predictive performance than the LR model. This nonlinear relationship could also be further deepened in future studies, which could be important in guiding the prevention of LBM controlling for appropriate waist circumference and focused screening for LBM for specific heights.
Sarcopenia is associated with a wide range of adverse health outcomes and leads to a poor prognosis for many diseases and an increased risk of comorbidities, all of which have significant public health implications. Garilalla et al. showed that sarcopenia significantly prolonged the length of hospital stay in older adults (13.4 days in the sarcopenia group versus 9.4 days in the non-sarcopenia group, p = 0.003). 35 The risk of readmission was significantly lower in patients without sarcopenia (adjusted hazard ratio .53; 95% CI: 0.32–0.87, p = 0.013). 35 The study by Ye et al. demonstrated that severe sarcopenia increases the number of hospitalization visits [incidence ratio 1.31, 95% CI: 1.03–1.66, p = 0.03] and can lead to financial catastrophe for families due to health care costs [ratio: 1.04, 95% CI: 1.01–1.07, p < 0.01]. 36 This effect that sarcopenia increases hospitalization costs and the number of hospitalizations has shown the same results in many other studies.37–39 Bokshan's study showed that sarcopenia increases the risk of blood transfusion in addition to postoperative costs. 40 Reducing the risk of blood transfusion through early identification of sarcopenia may also alleviate the public health burden in the face of increased risk of blood shortages due to decreased or delayed increase in blood donors since the COVID-19 pandemic.41,42 In addition to its impact in terms of health care expenditures, sarcopenia is associated with social and public problems such as productivity impairments and self-life disorders. However, there is a lack of research on the impact of these indirect burdens.
It is important to note that this study still has some limitations. First, the definition of LBM in this study was based on the criteria recommended by the FNIH sarcopenia foundation, and the source population for the data used was a community-based population in the United States. Because the prevalence of sarcopenia varies from region to region and the diagnostic criteria for LBM vary from region to region, the predicted outcomes need to be viewed with great caution when applied to other regions. Second, this study was conducted using LBM to aid in the diagnosis of sarcopenia, so further refinement of muscle strength and muscle performance testing is needed to clarify the diagnosis of sarcopenia in patients identified as being at high risk for LBM. Although LBM is still used as the primary indicator for determining sarcopenia in the FNIH as the primary guideline for sarcopenia in the United States, recent studies have increasingly emphasized the importance of muscle strength and physical performance in predicting adverse health outcomes. Therefore, in future studies, we need to incorporate muscle strength and physical performance metrics to better comply with evolving definitions and improve the prognostic value of our model. Third, although the population in this study was representative of all levels of the U.S. regions, the sample size was large, and we conducted internal validation by dividing the entire dataset into training and validation set, we lacked an external cohort study to validate the performance of the prediction tool. Future external validation of the performance of the prediction tools in this study using external cohort data in the U.S. region is warranted. In addition, although six typical ML methods were used to construct the models in this study, there may still exist some methods (e.g., Deep Belief Networks) that may have better performance that were not used in this study. 43 Although deep learning models are more often applied to process two-dimensional data such as images, it is also necessary to build models based on some deep learning methods in the future. Finally, although we used a variety of methods to prevent the problem of model overfitting, including: dividing the dataset into a training set and a validation set, which showed similar and good prediction performance in both the training and validation sets; using a variety of collapsed cross-validation methods to ensure the stability and generalization performance of the model; and avoid using too many irrelevant features by feature filtering. However, these techniques do not guarantee complete avoidance of the overfitting problem.
Conclusion
In this study, using height, waist circumference, race, and age as features, the ML model constructed by the XGBoost ML method possesses good classification performance. A web calculator was further constructed to facilitate the application of the model, which can be used to quickly predict the risk of LBM in people to aid in the diagnosis of sarcopenia using these easily captured features. It can be used for community-based population screening in the United States and early intervention in high-risk populations to improve individual health and reduce public health expenditures. In the future, ML models are expected to contribute more to disease screening.
Footnotes
Acknowledgements
The authors thank the participants and staff of the National Health and Nutrition Examination Survey 1999–2004 for their valuable contributions.
Availability of data and material
Contributorship
Jiale Guo contributed to the data analysis and writing the original manuscript, Qionghan He contributed to the software and writing the original manuscript, Chunjie She contributed to the data analysis, Hefeng Liu contributed to the revision of the manuscript, Yehai Li contributed to the project administration and the conceptualization. All authors read and approved the final manuscript.
Ethical approval
The protocol used in NHANES was approved by the National Center for Health Statistics Research Ethics Review Board and was conducted in accordance with the principles of the Declaration of Helsinki as detailed on their official site (![]() ). In accordance with local policy, this study no longer required additional ethical review by the authors’ institutions.
). In accordance with local policy, this study no longer required additional ethical review by the authors’ institutions.
Declaration of conflicting interests
The authors declared no potential conflicts of interest with respect to the research, authorship, and/or publication of this article.
Funding
The authors received no financial support for the research, authorship, and/or publication of this article.
Informed consent
The NHANES protocol was approved by the National Center for Health Statistics Research Ethics Review Board, and the informed consents of all patients were obtained. Details can be found at https://wwwn.cdc.gov/nchs/nhanes/continuousnhanes/documents.aspx?BeginYear=1999, https://wwwn.cdc.gov/nchs/nhanes/continuousnhanes/default.aspx?BeginYear=2001, and ![]() .
.
Guarantor
YL.