
Abstract
Objective
This retrospective study (2020–2022) compared the usage patterns across international regions of an employer-provided digital mental health platform, which is available in native languages and offers both self-guided digital activities and one-on-one sessions.
Methods
Routine data from the platform were analyzed by describing the demographic profile of 178,119 users from different geographical regions, their baseline mental health status and burnout levels, as well as patterns of engagement. Statistical analyses were conducted using logistic and ordered logit models to examine the association between cumulative engagement with the platform over time and baseline characteristics.
Results
The platform had high engagement and satisfaction levels across regions and age groups. Female users were more engaged than males in both self-guided digital activities and one-on-one sessions. Older users and those from non-US regions were more engaged in self-guided digital activities, while younger users and those from the US were more engaged in one-on-one sessions. Symptoms of anxiety were also associated with engagement with one-on-one sessions.
Conclusions
The study's findings provide valuable insights into the benefits of digital platforms in addressing mental health needs of employers from different regions. Future research should focus on exploring the specific factors that influence engagement with digital mental health platforms and how these platforms can be optimized and tailored to better serve diverse populations.
Keywords
Introduction
The global burden of mental health conditions is substantial and on the rise, with costs to the world economy forecasted to increase from $2.5 trillion United States Dollars (USD) in 2010 to $6 trillion USD by 2030.1,2 In 2019, mental health conditions accounted for 13.9% of all years of healthy life lost to disability. 1 Despite these trends, government spending on mental health across the world remains disproportionately low. In 2020, mental health received less than 2.1% of median government health expenditure per capita, 3 although this rate varies greatly by country. This indicates that there is a need for cost-effective mental health interventions to support the growing gap between the health burden and service provision.
Mental health-focused digital health technologies (MH-DHTs) are tools providing services for the prevention, treatment and management of mental health conditions. Mental health-focused digital health technologies come in multiple forms, including tele-therapy and tele-coaching, peer support, education/psychoeducation, self-guided resources, meditation apps, virtual reality-based treatments, digital therapeutics and many more.4,5 These technologies are increasing in availability and provide several advantages over traditional mental health interventions, such as overcoming barriers (e.g. transportation, stigma, limited supply of mental health professionals and costs) and improving accessibility, convenience and privacy. 6
Current literature, including meta-analyses of randomized controlled trials (RCTs), provides evidence that a range of different MH-DHTs are effective7–11 in stress management, improving psychological well-being, worker engagement and productivity, 12 and reducing symptoms of depression and anxiety in a range of countries and contexts, including both high- and low-income countries.13–18 A systematic review and meta-analysis of five RCTs found that telehealth was as effective as face-to-face therapy in treating anxiety and related conditions. 19 Despite their efficacy, access to MH-DHTs could be limited by barriers such as access to the internet, computers or smartphones, 20 technological confidence, 21 and language barriers. 22
In the past few years, MH-DHTs have become increasingly available through employers.12,23,24 Workers’ well-being is significantly and positively related to productivity, indicating that emotional well-being is a crucial factor for organizational performance. 25 On the other hand, burnout, a psychological syndrome characterized by emotional exhaustion, has been shown to have significant negative impact on productivity across various professions.26–28 Given the link between poor mental health, burnout and loss of productivity, as well as their cost-effectiveness, MH-DHTs are particularly suitable for use in a workplace setting. Many studies suggest that MH-DHTs are particularly helpful at mitigating symptoms of poor mental health and burnout across different sectors such as construction, 29 healthcare,30,31 and teaching, 32 as well as for employees experiencing health conditions such as menopause 33 and insomnia, 34 although, these sectors were not specifically included in our analysis. While there are many studies highlighting the benefits of MH-DHTs in enhancing mental health in individual sectors, countries or geographical regions, there are limited cross-country comparisons of the use of these technologies, especially in real-world settings. Cultural context plays a significant role in shaping mental health perceptions and affects how symptoms are recognized, the willingness to seek help, and the types of interventions that are considered acceptable or effective. What works in one context may not work in another. Adopting an MH-DHT that can function across multiple countries is particularly crucial for multinational companies with a workforce spanning continents. In these companies, the diverse mental health needs and varying cultural understandings of mental health can create significant challenges in implementing effective and inclusive mental health strategies. While MH-DHTs can provide a cost-effective solution, it is important to firstly understand how diverse population engage with digital mental health services.
This study aimed to address this gap in the literature by analyzing the use of an employer-provided digital mental health platform in different regions across the world. While previous studies have evaluated the effectiveness of the platform in improving well-being, 35 this study addresses two research questions: (1) what are the demographic profiles of the users and their baseline mental health and burnout levels? and (2) what patterns of engagement exist among individuals of different demographics and from different geographical regions?
Understanding the use and engagement of digital mental health platforms is important for several reasons. Firstly, these platforms have the potential to provide accessible and personalized mental health support to diverse populations, 36 including employees in different regions and age groups. However, to maximize the benefits of these platforms, it is essential to understand how they are used and engaged with by different user groups. Secondly, the analysis of usage and engagement can provide insights into the preferences and needs of users, which can inform the design and implementation of these platforms. 37 Such findings can guide the development of strategies to improve engagement among different user groups. Lastly, understanding patterns of real-world usage of MH-DHT might ultimately impact the broader field of mental health research by providing insights that will help maximize the potential of these technologies to increase self-management of care 38 and ease the burden on health systems 39 ; however, these objectives fall beyond the scope of this study.
Methods
Design and participants
This was a retrospective study of routine data collected from an employer-provided digital mental health platform (Modern Health, Inc., San Francisco, CA). The platform offers personalized support through self-guided courses and programs, meditation exercises, group psychoeducational sessions and one-on-one sessions with licensed mental health providers, such as therapists, and certified professional coaches. The services offered on the platform are designed and built using evidence based practices, and the platform itself has been the focus of several research studies.35,40–42 Access to the platform is available to employees through their employer. The platform is accessible as a web-based and smartphone-based application and is available in most countries worldwide, with both the content of the application and the one-on-one session available in native languages. The procedures for data extraction and analysis followed similar protocols of other retrospective studies of digital health interventions.43,44 When signing up, platform users provided their consent to Modern Health's Terms of Service and Privacy Notice, according to which, Modern Health may use and share aggregated or anonymized data collected for research. The data were de-identified by Modern Health before being sent to the research team. On this basis, Western Clinical Group IRB and RAND Corporation's Human Subjects Protection Committee deemed the study exempt from further research ethics review.
Data elements included platform user demographics, baseline mental health and burnout status and measures of engagement with the platform. Clinical and burnout outcomes and engagement measures are described in detail below. Demographic information included gender, age and country of residence of platform users. For the purpose of this study, countries of residence were grouped into seven regions: Africa and the Middle East, Asia, Canada, Europe, Latin America and the Caribbean, US and Oceania (groupings of regions can be found in Appendix Table A.1.). We kept the US and Canada as separate groups, rather than combining as ‘North America’, as the US had the largest volume of participants in the entire cohort, thus, combining these countries would likely mask unique data patterns for Canada. Other regions were grouped based on geographical proximity, applying often used regional categories.
Platform users were included in the analyses based on two sets of inclusion criteria, one for descriptive summaries (descriptive cohort) and one for statistical analyses (analytic cohort). Users were included in the descriptive cohort if they reported their country of origin and started using the platform between January 2020 and December 2022 (when the data were transferred to the research team). The total sample size of the descriptive cohort included 178, 119 participants (Appendix Figure A.1.). The statistical analyses focused on engagement over time, so participants were included in the analytic cohort if they met the above criteria for the descriptive analysis and completed at least two clinical assessments at least 30 days apart and completed the clinical assessments in their preferred language. The total sample size of the analytic cohort included 33, 477 participants (Appendix Figure A.2.).
Clinical assessments
The platform utilizes validated instruments that have been extensively tested for their reliability in various populations and settings: the World Health Organization-Five Well-Being Index (WHO-5), the Generalized Anxiety Disorder 2-item (GAD-2) and the Patient Health Questionnaire 2-item (PHQ-2).45–63 Users were asked to complete these self-reported questionnaires through the platform at sign-up, every four weeks thereafter, and, if they were seeing a provider, before every other session. Completion of the clinical assessments was optional. These instruments are described in more detail below:
World Health Organization-5
The WHO-5 is used to assess well-being and identify potential depression. The questionnaire (Appendix Table A.2.) consists of five items that are rated on a 6-point Likert scale. The total raw scores are multiplied by 4 and range from 0 to 100, with higher scores indicating better well-being. Previous studies have used different thresholds to interpret the scores of the WHO-5, but most agree that a score lower than 50 is indicative of poor well-being, and lower than 28 is indicative of risk for depression.59,60
Generalized Anxiety Disorder-2
The GAD-2 is used to screen for GAD. The questionnaire (Appendix Table A.3.) consists of two items that assess the frequency of symptoms of anxiety over the past two weeks on a 4-point Likert scale, ranging from 0 (not at all) to 3 (nearly every day). Scores range from 0 to 6, where a score of 3 or higher is indicative of risk for clinical anxiety. 64
Patient Health Questionnaire-2
The PHQ-2 questionnaire is used to screen for depression. The questionnaire (Appendix Table A.4.) consists of two items that assess the frequency of symptoms of depression over the past two weeks on a 4-point Likert scale, ranging from 0 (not at all) to 3 (nearly every day). Scores range from 0 to 6, where a score of 3 or higher is indicative of risk for clinical depression. 64
Burnout
Burnout was measured with a validated single-item questionnaire asking participants how often they felt burned out from their work, with responses ranging from 0 (never) to 6 (every day) (Appendix Table A.5.). 65
Engagement with digital platform services
Engagement is defined as the extent to which users interacted with the platform. Operationalization of engagement was based on the number of self-guided digital activities completed (described below) and the number of one-on-one sessions with mental health providers. The engagement dataset included a log of each time a user started and completed an activity, allowing for a detailed analysis of patterns of engagement over time.
Engagement data were available for three types of self-guided digital mental health activities (courses, programs and meditation exercises), as well as one-on-one sessions with mental health providers. These are described below:
Courses are designed to help participants to build skills, such as boosting confidence and self-worth, support a healthy lifestyle, improve the quality of relationships and managing stress.
Programs are quick reads on a variety of topics, including (but not limited to) managing anxiety and depression, building healthy habits and building resilience.
Meditations are audio recordings designed to guide participants through exercises such as mindful meditation, breathing techniques, mindful movements and self-compassion.
One-on-one sessions consist of one-on-one sessions with a licensed mental health therapist or certified professional coach. The frequency and number of therapy sessions attended by participants was determined by the number of sessions covered by their employer, their therapeutic requirements and their level of involvement in the process. The type of provider (therapist or coach) was determined based on a combination of clinical need and preferences of the participants. Participants could work with a therapist, a coach or both (simultaneously or sequentially). Coaches and therapists were available in all regions and countries.
One-on-one sessions satisfaction ratings
After each one-on-one session, participants were given the opportunity to fill out a questionnaire rating their satisfaction with the session on four accounts: a general five-star rating, their confidence in the provider's ability to help, the extent to which they worked on their goals and the degree to which the session improved their well-being. All ratings were scored on a scale from 1 to 5, with higher scores indicating greater satisfaction.
Group psychoeducational sessions are also offered in the platform, but participation in these sessions is anonymous and thus data were not able for extraction for analyses.
Retention rates
Retention rate is a metric that measures the percentage of users who continue to use a product or service, in this case an app, over a given period, divided by the total number of users who initially signed up.66,67 In this study, the authors calculated the retention rate of the platform by looking at the active period between a user signing up and their latest logged activity. Active periods are defined as days where there was a logged self-guided digital activity, one-on-one session or clinical assessment. To calculate retention rate, the number of users who had an active period of at least 15, 30 and 90 days was divided by the number of users who signed up.
Data analysis
Descriptive summaries were conducted on the descriptive and analytic cohorts to compare the demographic profile of users from different regions, their baseline clinical mental health status and burnout levels, retention rates and patterns of engagement with the digital mental health services. Engagement with the platform was calculated based on the number of completed sessions within each activity. Continuous measures, such as the clinical assessments and app engagement, were summarized as means with standard deviations and medians with interquartile limits. Categorical measures, including demographic information such as country of residence, gender and age, were summarized as percentages. When comparing percentages in this study, it is important to note that these comparisons are descriptive in nature and are not subjected to formal statistical testing. The aim is to provide an overview of the observed patterns and trends based on the available data.
Statistical analyses were conducted exclusively on the analytic cohort to examine the association between cumulative engagement with the platform over time and baseline characteristics. For these analyses, we used ordinal logistic regression to examine the outcome of engagement with self-guided digital activities. 68 The number of self-guided digital activities was operationalized as 0, 1–2, 3–5 and 6+ sessions. Because the total number of allowable one-on-one sessions differed by employer, we used binomial logistic regression to examine the outcome of engagement with one-on-one sessions (0 sessions vs. any number of sessions). 69 For this analysis, we excluded companies that did not offer one-on-one sessions. For both models, predictor variables included age, gender, region and measures of baseline mental health and burnout. Mental health was operationalized as: well-being (mean WHO-5 score), depression (PHQ-2: <3 or ≥3), anxiety (GAD-2: <3 or ≥3). Burnout was operationalized as: burnout experienced more than one day per month: yes or no. A variable for time, operationalized as yearly quarters of follow-up from baseline mental health assessment to last observation, was included in the models to account for variation in follow-up and its potential influence on cumulative engagement. Odds ratios and 95% confidence intervals were reported. All descriptive summaries were performed in R (version 4.1.2), and statistical analyses were performed in STATA 17.0 (Stata Corp; College Station, TX).
Results
We describe below the results of the analyses by research question. We specify whether the findings came from the descriptive or the analytic cohort, where relevant.
Demographic profile summaries of users and baseline mental health and burnout levels
Descriptive cohort characteristics
A total of 178,119 users were included in the descriptive analyses. Most users were from the US (73.4%), followed by Europe (12.4%), Asia (5.9%), Canada (3.4%), Oceania (2.5%), Latin America and the Caribbean (2.2%) and Africa and the Middle East (0.3%). Women represented a larger percentage of users in the US (38.4%), Canada (32.2%) and Europe (27.9%) compared to the other regions (15.6%–23.5%) (Table 1). However, self-reported gender was frequently missing, with more than half of the participants in Oceania (65.5%), Africa and the Middle East (56.6%) and Latin America and the Caribbean (52.3%) not disclosing their gender. On average, mean and median age were similar across regions. Between 25.2% (Canada) and 56.6% (Africa and the Middle East) of users did not disclose their age.
User characteristics by region, descriptive cohort.
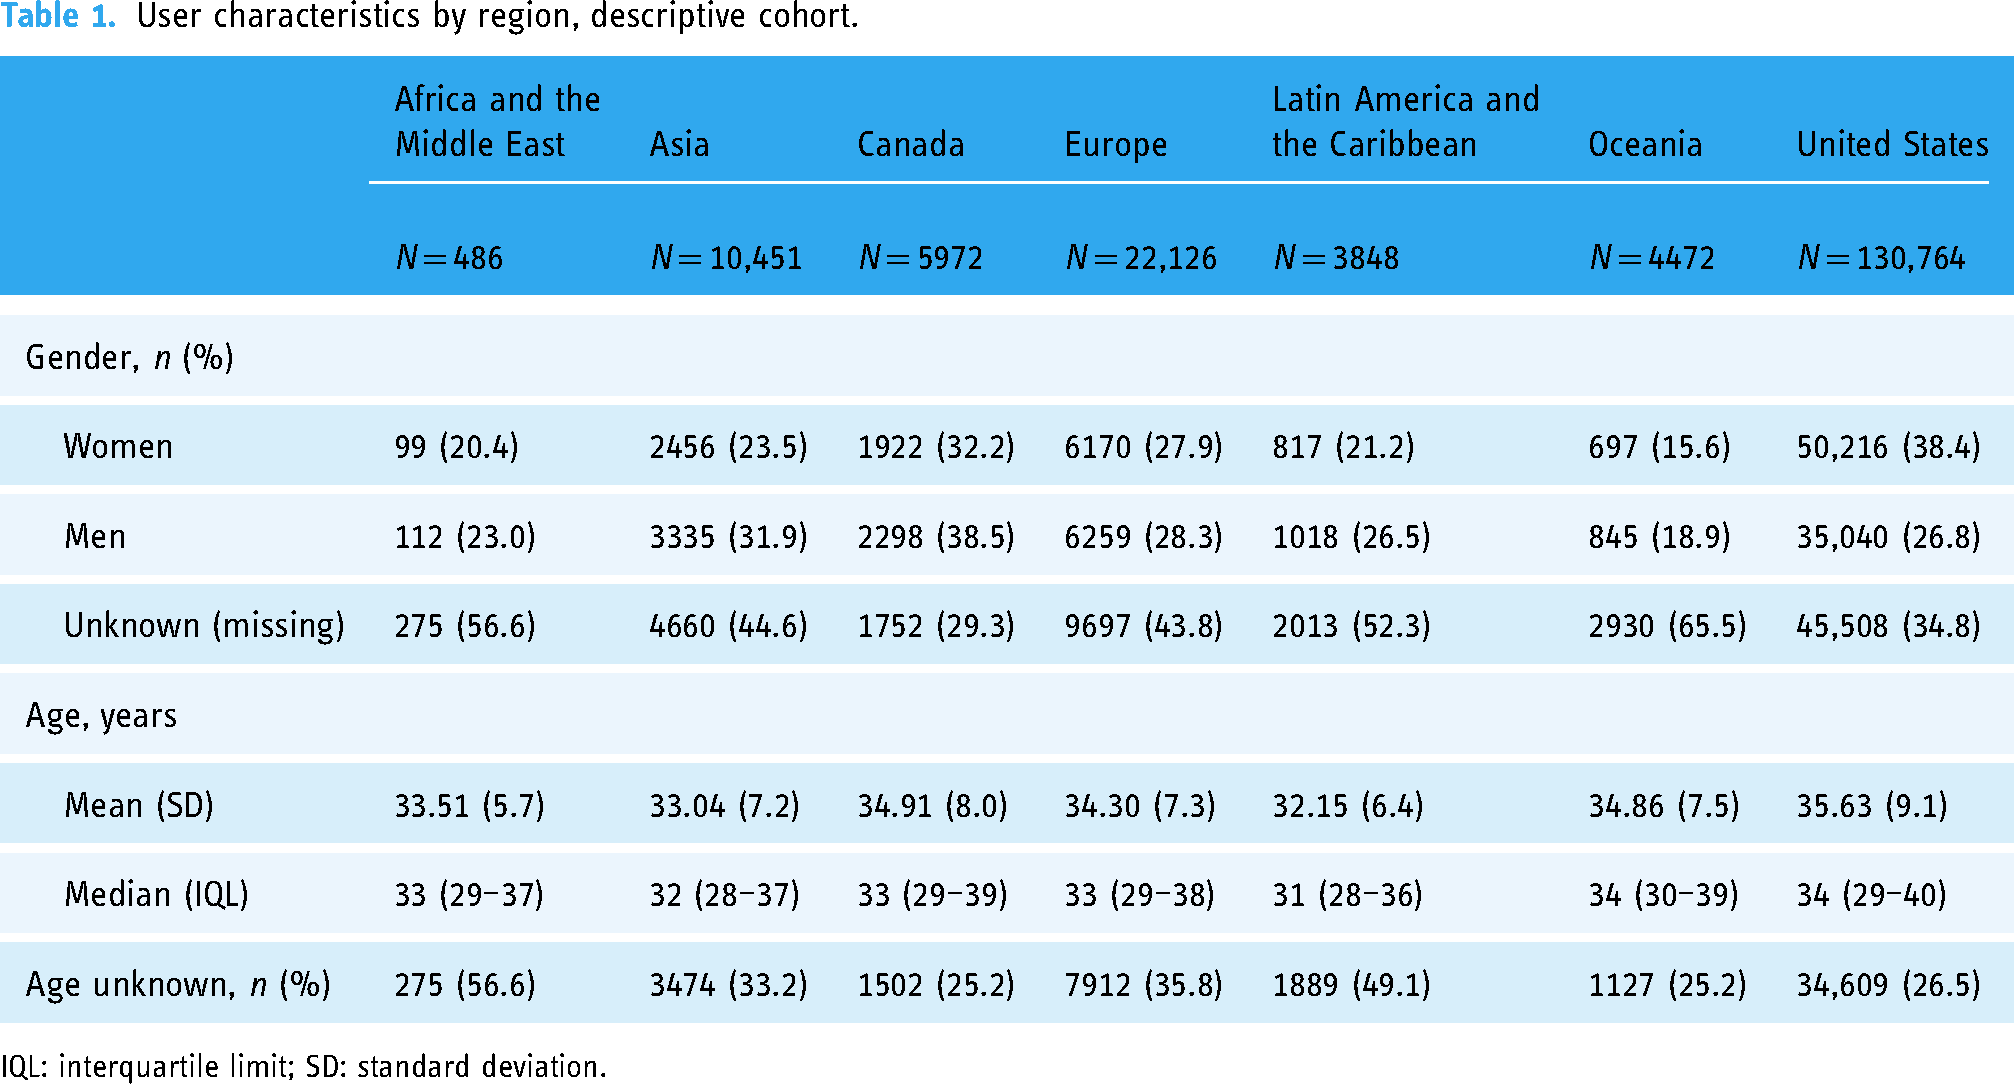
IQL: interquartile limit; SD: standard deviation.
Analytic cohort characteristics
The distribution of users between regions was similar in the analytic cohort to the descriptive cohort (Appendix Table A.6.). However, there was a difference in the gender distribution of participants between the two cohorts. The descriptive cohort had a higher percentage of male participants, while the analytic cohort had a higher percentage of female participants. The percentage of participants who did not declare their gender was similar between the two cohorts.
Baseline clinical assessments in the descriptive cohort
Across all regions, most users had a WHO-5 < 50, indicating poor overall well-being (Table 2). Africa and the Middle East had the largest percentage of users with poor well-being (66.6%), whereas Latin America and the Caribbean had the smallest (56.7%). Overall, the majority of users across regions screened positive for clinical anxiety (>60%) and about one-quarter to one-third screened positive for clinical depression. Descriptively, there were no substantial differences between regions in terms of anxiety and depression.
Baseline clinical measures by region, descriptive cohort.
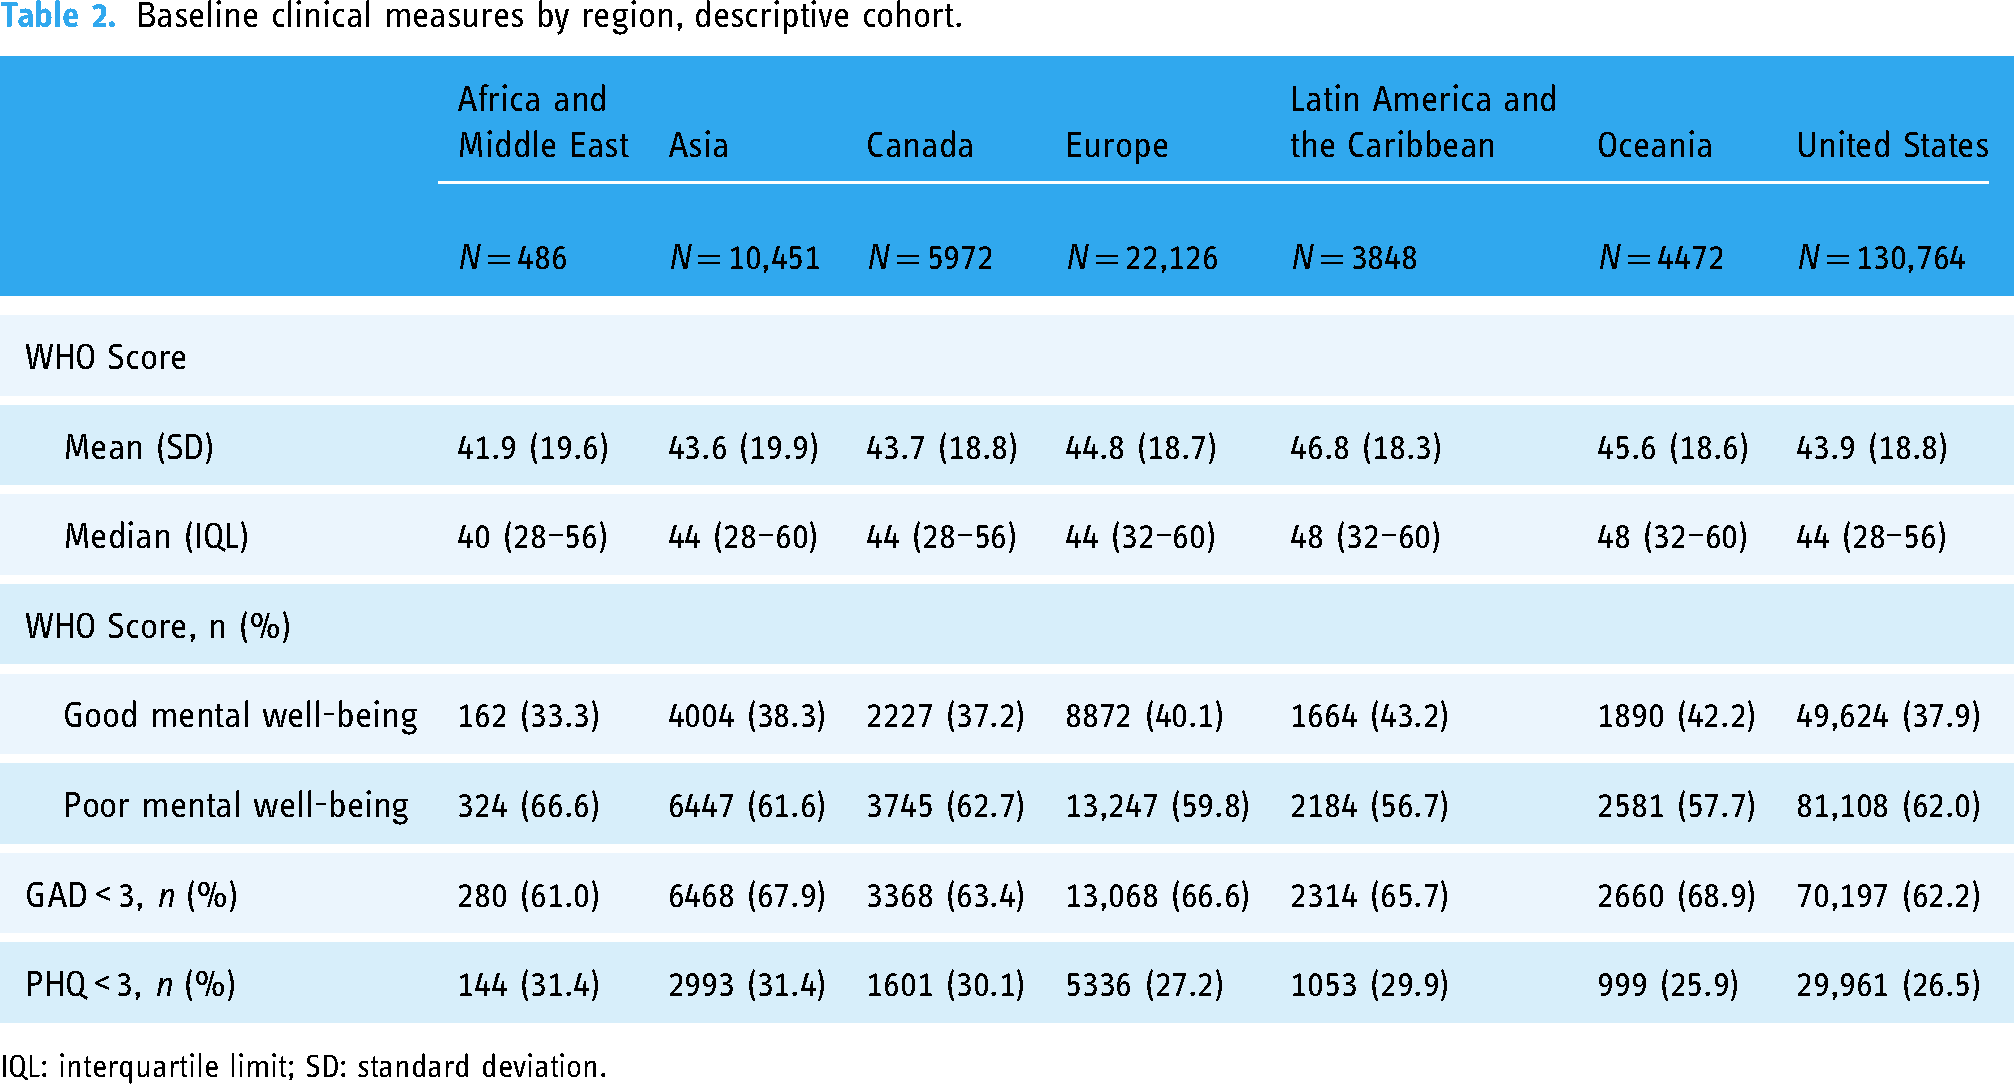
IQL: interquartile limit; SD: standard deviation.
Baseline burnout in the descriptive cohort
Levels of burnout were the highest among US participants, with 60.7% feeling burned out more than once a month (Table 3). The regions with the lowest percentage of participants experiencing burnout were Europe (46.5%) and Africa and the Middle East (53.1%).
Baseline burnout by region, descriptive cohort.
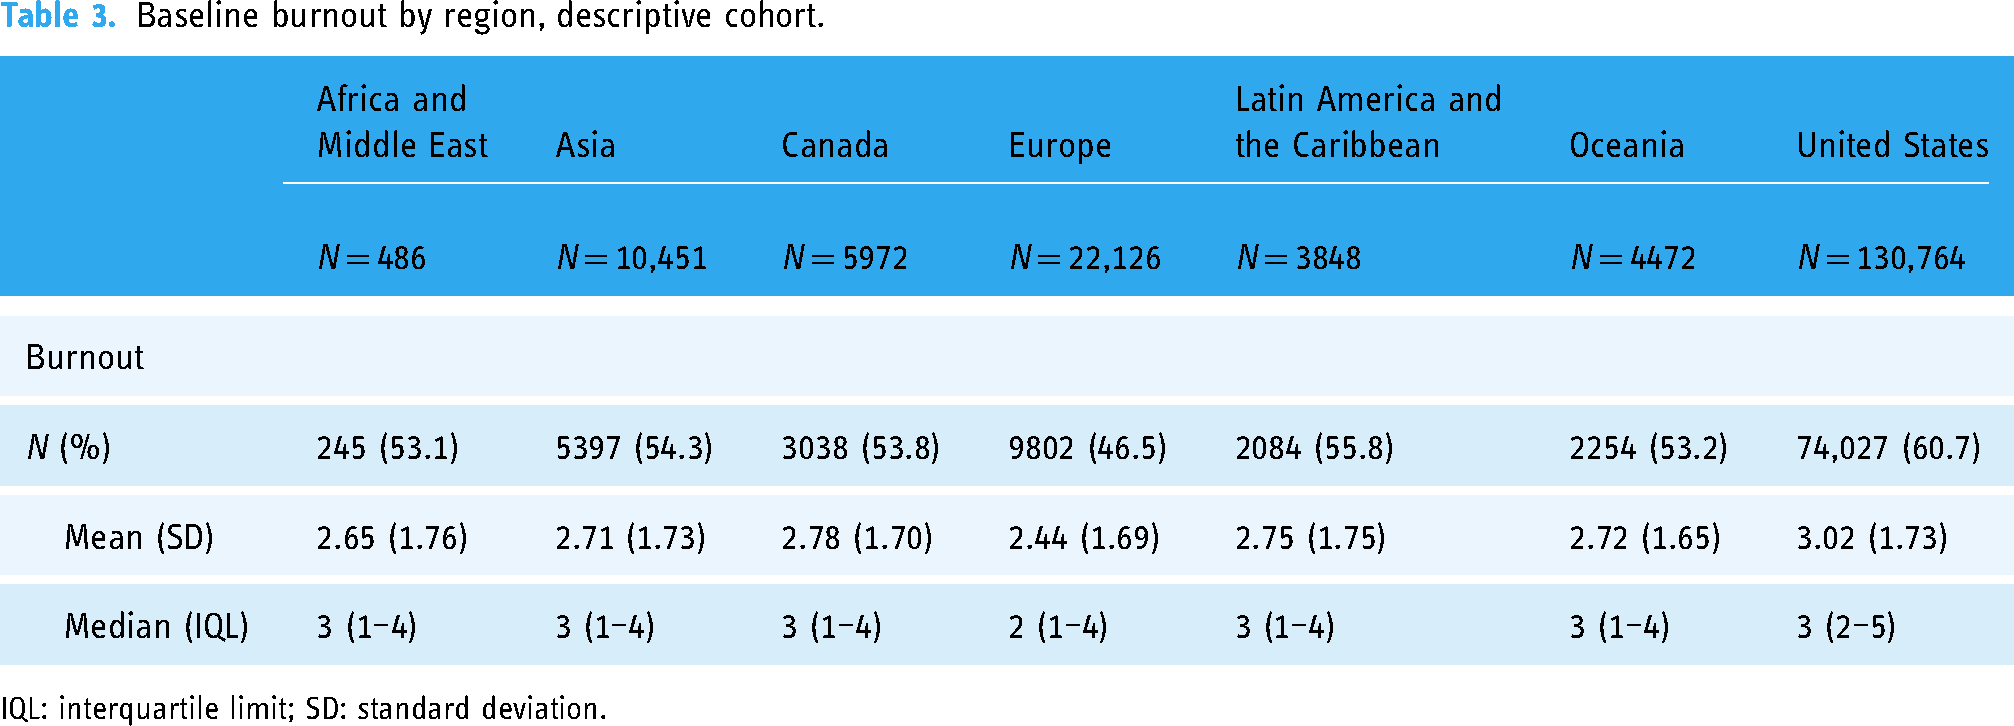
IQL: interquartile limit; SD: standard deviation.
Patterns of engagement
Platform engagement in the descriptive cohort
Across all regions, the majority of participants engaged with the platform after signup, with the highest engagement in Latin America and the Caribbean (64.2%) and the lowest in Asia (56.1%) (Table 4, Figure 1). In most regions, participants engaged with both self-guided activities and one-on-one sessions rather than only one or the other. However, in Asia, a larger percentage of participants opted for self-guided digital activities only. Asia had the lowest uptake of one-on-one sessions overall, with only 30% of participants engaging in this activity (Table 5). By contrast, the US had the highest percentage of participants who attended one-on-one sessions overall (47%), as well as the highest percentage of participants who only attended one-on-one sessions (23%) and the lowest percentage of participants who only completed self-guided activities (14.6%).

Engagement by region, descriptive cohort.
Engagement by region, descriptive cohort.

‘Any type of engagement’ includes participants who completed at least one one-on-one session or one self-guided activity, or both.
‘Both one-on-one sessions and self-guided activities’ includes participants who completed at least one one-on-one session and one self-guided activity.
‘Self-guided activities only’ includes participants who completed at least one self-guided activity and no one-on-one sessions.
‘One-on-one sessions only’ includes participants who completed at least one one-on-one session and no self-guided activities.
‘No engagement’ includes participants who did not complete any one-on-one session nor self-guided activities after signing up.
Overall platform engagement by region, descriptive cohort.
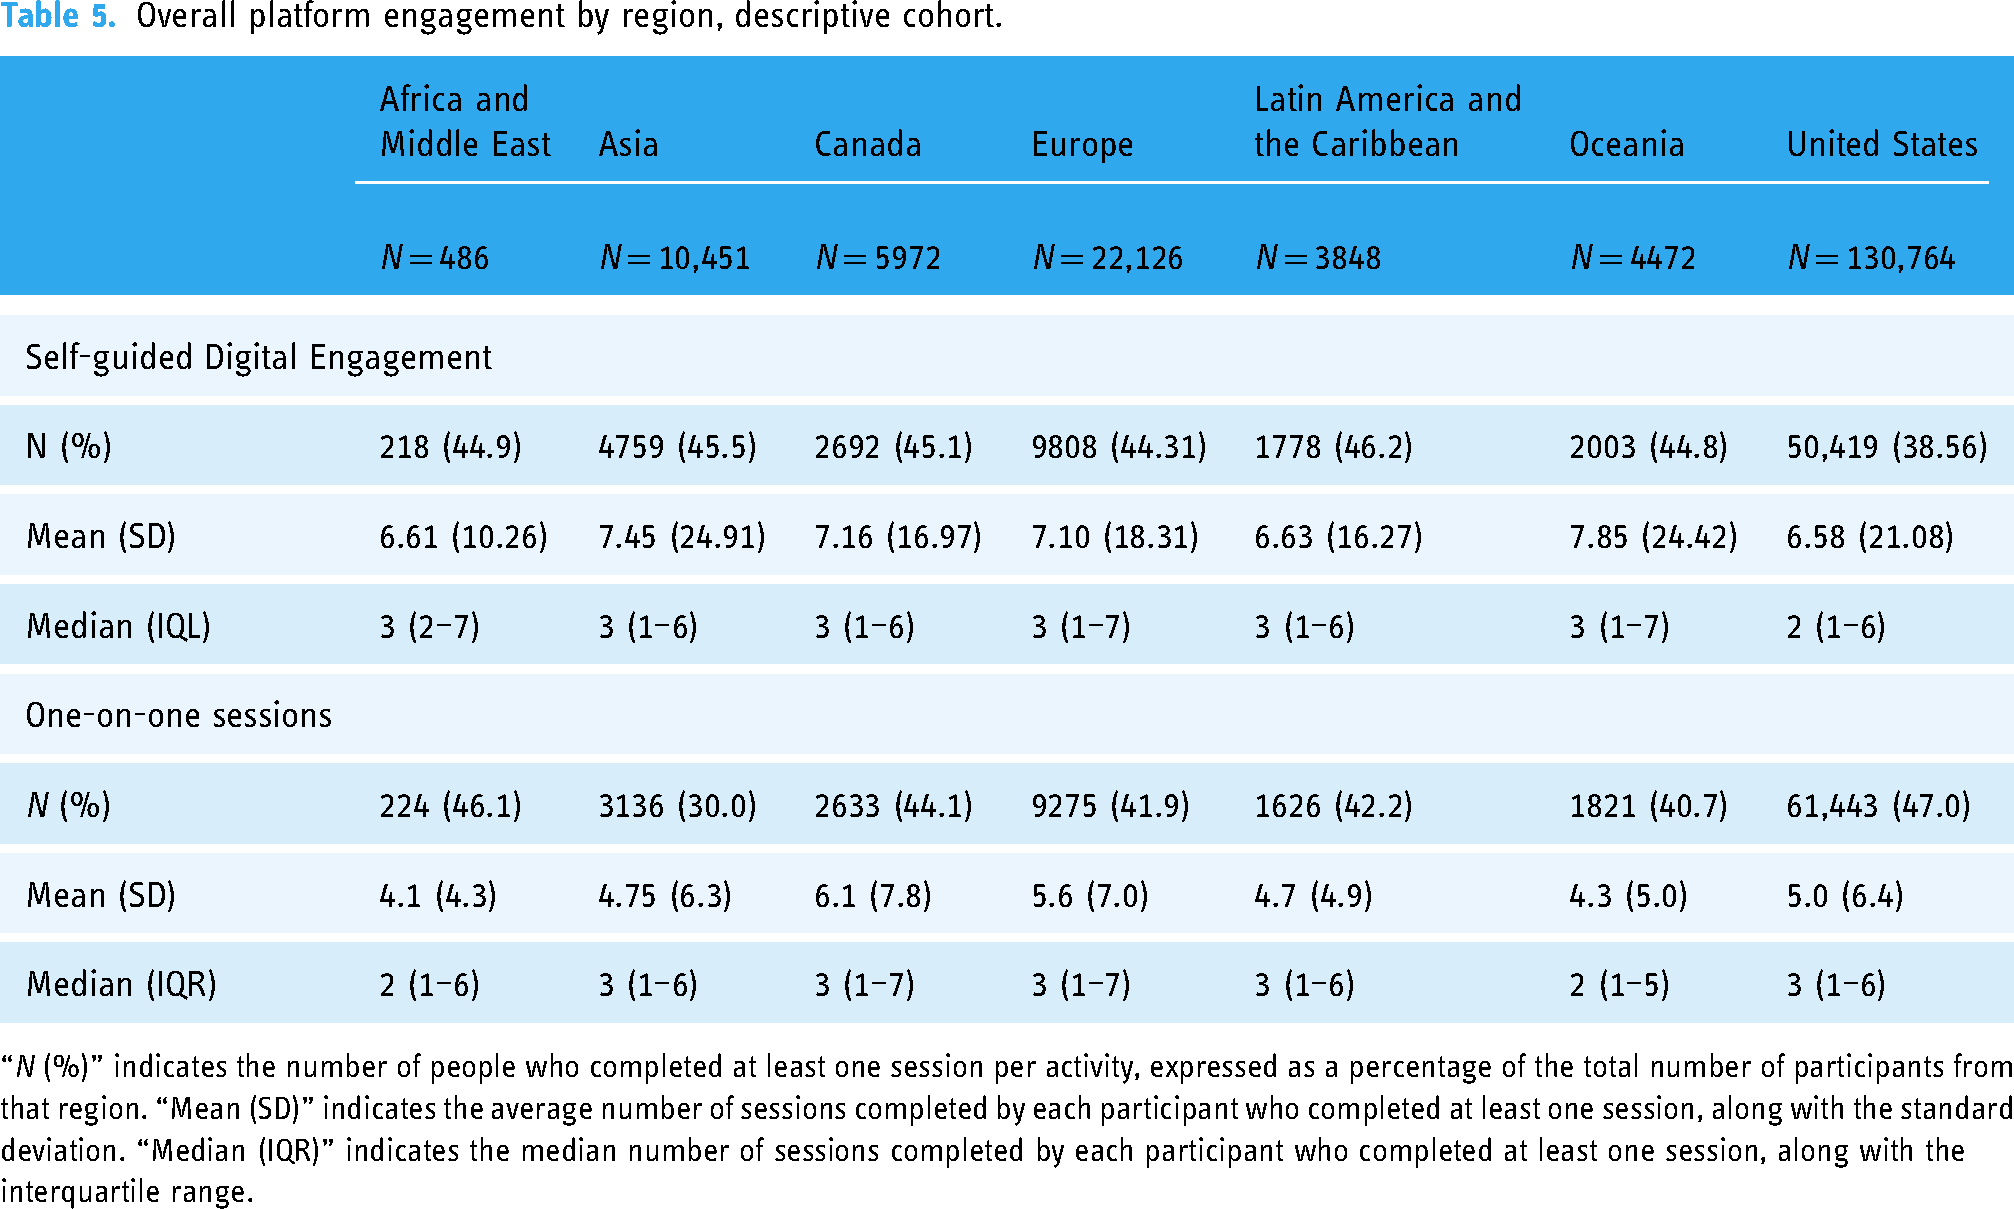
“N (%)” indicates the number of people who completed at least one session per activity, expressed as a percentage of the total number of participants from that region. “Mean (SD)” indicates the average number of sessions completed by each participant who completed at least one session, along with the standard deviation. “Median (IQR)” indicates the median number of sessions completed by each participant who completed at least one session, along with the interquartile range.
There was a higher utilization of self-guided digital activities than one-on-one sessions in all regions except for the US and Africa and the Middle East. Descriptively, there were no notable differences between the average number of sessions per activity across all regions, with averages ranging between 6.61 in Africa and the Middle East and 7.85 in Oceania for self-guided activities and 4.1 in Africa and the Middle East and 6.1 in Canada for one-on-one sessions.
Between 30% and 70% of participants across regions who participated in one-on-one sessions responded to questions regarding satisfaction. Average ratings of satisfaction were calculated across all sections. The ratings were 4 out of 5 and above across regions on all satisfaction questions (Appendix Table A.7.).
Retention rates in the descriptive cohort
In the descriptive cohort, 59.4% of users were still using the app after 15 days, with the percentage declining to 53.3% after 30 days and 39.6% after 90 days (Appendix Table A.8.). The retention rate varied by region, with Asia having the lowest retention rate of 51.7% after 15 days, 46.2% after 30 days and 32.8% after 90 days. In contrast, Oceania had the highest retention rate of 60.5% after 15 days, 54.4% after 30 days and 41.6% after 90 days.
Platform engagement in the analytic cohort
The overall engagement with services was much higher for the analytic cohort than for the descriptive one, as expected. In the descriptive cohort, 57–65% of user engaged with the platform, while the percentage increased to 86.3–89.7% in the analytic cohort. In the analytic cohort, the US had the highest proportion of participants who did not engage in any self-guided activity (37.2%), while Asia had the highest proportion of participants who engaged in six or more activities (33.4%) (Table 6, Figure 2). Asia, on the other hand, had the highest proportion of participants who did not engage in one-on-one sessions (41.4%), while Canada had the highest proportion of participants who engaged in nine or more sessions (21.9%) (Table 6, Figure 3).

Cumulative engagement of self-guided activities, analytic cohort.

Cumulative engagement of one-on-one sessions, analytic cohort.
Levels of cumulative engagement by region, analytic cohort.

Association between engagement and baseline characteristics in the analytic cohort
Association between engagement and baseline characteristics was examined among users in the analytic cohort. Platform users who were female (vs. male), those aged 38–67 years (vs. 18–27), from non-US regions, and those with longer follow-up had increased odds of engagement with self-guided digital activities (Table 7). Additionally, female (vs. male) users, those aged 18–27 years (vs. 38 or older) and those from the US (vs Asia, Europe, Latin America and the Caribbean and Oceania) had increased odds of engagement with one-on-one sessions. Lower WHO scores and GAD-2 scores (indicating symptoms of anxiety) were associated with increased odds of engagement with one-on-one sessions.
Predictors of engagement, analytic cohort.

Discussion
This retrospective study analyzed the use of an employer-provided digital mental health platform across several international regions. The study focused on understanding the demographic profiles of the users and their baseline mental health and burnout levels and what patterns of engagement exist among individuals from different geographical regions and demographics.
The study revealed consistent demographics across regions, with varying levels of engagement observed in both digital resources and one-on-one sessions. Descriptive differences in engagement were observed by region, with lower engagement and retention rates noted in Asia, where participants favoured self-guided activities. In contrast, US participants exhibited higher engagement in one-on-one sessions. Furthermore, statistical analyses found that individuals from non-US regions had higher odds of engagement with self-guided digital activities than those from the US, while those from the US had higher odds of engagement in one-on-one sessions than individuals from non-US regions. These disparities may reflect cultural differences, as cultural contexts significantly influence how individuals perceive, interpret and respond to mental health issues. The difference between Asia and the US might be linked to mental health stigma. As some studies suggest, in Asian cultures, mental health issues are often highly stigmatized due to traditional beliefs, societal norms and lack of mental health literacy,70–72 making self-guided activities perhaps a more accessible and accepted channel to address mental health distress. Conversely, in North America, while mental health stigma still exists, awareness and acceptance of mental health issues might have generally improved over time.73,74 While these hypotheses provide potential explanations for the observed regional differences in platform engagement, further research incorporating qualitative data and cultural context is necessary to validate these hypotheses.
The analysis also revealed differences in how users of different genders and age groups engaged with the platform, however, one must remember that a vast percentage of users did not disclose their gender nor age, so this sample is not representative. Our statistical analysis showed that female users of the platform were more engaged than male users, in terms of both self-guided digital activities and one-on-one sessions, when controlling for other factors. This finding is in line with previous studies suggesting that, overall, men tend to seek mental health treatment less often than women75–78; however, further research is required to understand whether this applies to digital mental health services as well. Some authors suggested that traditional masculine norms and societal expectations can act as barriers to men seeking help for mental health issues. 79 Developers of MH-DHTs might want to consider the importance of understanding the social contexts that shape men's attitudes towards help-seeking in order to develop more effective strategies to encourage men to seek support and engage with mental health platforms when needed.
Older users tended to engage more in self-guided digital activities, while younger users did more with one-on-one sessions. Previous studies suggest that older adults, especially men, are less willing to seek specialty mental health services, 80 and are also less likely to seek talking therapies compared to younger population, 81 which partially supports our findings. However, more research is needed to understand why users of different ages might prefer one type of engagement over the other. In general, it is important to acknowledge that without qualitative data, such as interviews or surveys, we cannot definitively determine the underlying reasons for gender and age differences in platform engagement.
Poorer baseline mental health status, including self-reported symptoms of depression and anxiety, were also associated with more frequent engagement in one-on-one sessions. At baseline, across all regions, most users met the threshold for poor well-being, suggesting that people may have been more likely to sign up for the platform if they were struggling with their mental health and wanted support. Additionally, more participants across regions showed signs of anxiety compared to depression, in accordance with global data. 82
The prevalence of poor mental health was largely consistent between regions, with no notable differences. These results are in contrast with results from previous literature comparing international populations on measures of anxiety and depression, for which results have been highly heterogeneous.83–85 It is important to note that users from our cohort are likely not representative of the general population, as they were all employed and had access to this platform through their employer. Furthermore, authors of previous research recognized that there are important methodological challenges in synthesizing such data across different studies, including the use of varying case definitions, the selection of samples not allowing generalization, lack of standardized indicators and incomplete reporting, making it difficult to draw conclusions regarding international comparisons.86,87 Thus, it is possible that, in previous studies, differences in methodology accounted for differences between regions rather than the differences being attributable to actual cultural differences. 88
Overall rates of platform engagement in this study were high across regions, with 38.6–46.2% of participants utilizing self-guided digital resources and 30–47% utilizing one-on-one sessions. Between 56% and 63% of participants engaged with the platform's services at least once since registering with it. Across all regions, retentions rates with the platform at 15 days were between 51% and 60%, and between 46% and 54% at 30 days. Notably, previous literature suggests that retention rates for mental health apps are generally low, with rates of 3.9% and 3.3% at 15 and 30 days, respectively, for apps providing unguided mental health interventions. 38 For health and fitness apps more broadly, there is an estimated 3.7% retention rate after 30 days since the mobile app install. 89 We hypothesize that high rates of engagement across regions observed in our study may be attributed to the platform providing digital resources and one-on-one sessions in native languages, as well as a variety of offers that could suit a diversity of users.
Although we did not focus on clinical outcomes in this manuscript, prior work has shown that this platform is associated with improvements in subjective well-being, as measured by the WHO-5, and depression symptoms, as measured by the PHQ-9, among users, globally.35,41 For example, Prescott and colleagues reported more pronounced improvements in WHO-5 scores among users who engaged with 1:1 individual sessions compared with those who only engaged with digital assessments. Furthermore, they further showed higher odds of clinical improvements in depression among users who engaged 1:1 individual sessions versus digital assessments. 35
This study adds to the growing body of literature that examines user engagement with digital mental health platforms. Prior research has underscored the positive relationship between increased engagement with digital mental health tools and improved clinical outcomes. 90 Moreover, studies have indicated that personalized support, access to social networks and tailored feedback are key factors that enhance user engagement with digital interventions aimed at promoting mental health. 91
By identifying which specific features of a platform are associated with particular user profiles, mental health developers can gain valuable insights to inform their efforts in personalizing the application to boost user engagement. This understanding can guide developers in tailoring the platform to meet the unique needs and preferences of different user groups, ultimately enhancing the effectiveness and usability of digital mental health interventions. Our study, however, has several limitations that should be considered when interpreting the findings and planning for future research. This was a retrospective analysis of routinely collected data. The pooling of participants by region likely masks patterns in the data for individual countries and subregions. Similarly, data from the US and Canada may mask state- or province-based patterns. Despite pooling, regions outside of the US composed a small percentage of the overall cohort, and statistical analyses by region were not possible due to limited statistical power. Statistical analyses were used to understand the characteristics of users that can help to explain differences in utilization patterns, but these observations do not represent causal relationships. Future qualitative studies with diverse groups of users could shed a light on the causal links behind utilization patterns. Qualitative studies could deepen our understanding of platform users’ experiences and barriers, and how these interact with users’ cultural backgrounds. Another limitation of the study was that the study sample is likely not generalizable to broader populations within each region, or globally, due to self-selection bias. The platform was available to employers internationally and their employees self-selected into signing up for the platform. Given likely unmeasured differences between users of each country and the self-selection of users who engage with services, caution should be exercised when interpreting the findings of the statistical analysis. Furthermore, the study time frame overlaps with the COVID-19 pandemic, which makes it difficult to generalize our findings outside the context of the pandemic. During this time, mental health deteriorated for individuals all over the world. 92 Lastly, future research should prioritize assessing the long-term impact of platform engagement on mental health outcomes through longitudinal studies. Future research could also incorporate engagement theory to analyze the findings of studies on digital mental health platforms and delve into the factors influencing user interaction, commitment and satisfaction with the platform.
This study has several strengths that contribute to its relevance in the field of digital mental health. Firstly, the data were collected under real-world conditions. This means that the study's findings are more likely to reflect how the platform is used in real-life situations. Secondly, very few studies have compared the usage of the same platform across different regions, making this study novel and unique in its approach. By analyzing the usage of a digital mental health platform across several regions of the world, this study provides insights into what determines preferences for digital platform use between different regions of the world. This has important implications for mental health practitioners, policymakers, employers and other stakeholders interested in improving mental health outcomes and engagement with mental health programs.
Conclusions
This study highlights the importance of providing a mental health program that caters to the diverse needs of a global workforce, ensuring equitable care and experiences across different regions, cultures and languages. The findings show that a digital mental health platform, offering services in native languages with providers in employees’ countries of residence, garners high engagement and satisfaction among users from various regions and age groups. Varied engagement patterns were observed by geographic region, while preferences for self-guided versus one-on-one activities were influenced by gender, age, region and baseline mental health status. The study underscores the significance of offering multiple mental health care options within a single platform to address the unique needs of employers with diverse global workforces.
In conclusion, this research sheds light on the potential impact of tailored digital mental health interventions in promoting mental well-being among employees worldwide. By identifying users’ profiles and engagement patterns, mental health programs can be optimized to better support the mental health needs of a diverse global workforce.
Footnotes
Acknowledgements
The authors would like to thank Cynthia Castro Sweet, Sara Sagui-Henson and Brooke Smith for their helpful comments and guidance and Kate Morley for advising on statistical analyses and for reviewing the manuscript.
Contributorship
GM was the project manager of this study. WDP and RJR ideated the study and were involved in protocol development. DSL researched literature and contributed to writing the introduction. GM conducted the descriptive statistical analyses and wrote the first draft of the manuscript. RJR conducted the statistical analyses and made significant contributions to writing and editing the manuscript. WDP and RJR provided advice and guidance on all the analyses. WDP contributed to writing and editing the manuscript. All authors reviewed and edited the manuscript and approved the final version of the manuscript.
Declaration of conflicting interests
The author(s) declared the following potential conflicts of interest with respect to the research, authorship, and/or publication of this article: This study was funded by Modern Health, the developer and owner of the platform that was analyzed.
Ethical approval
RAND Corporation's Human Subjects Protection Committee reviewed this study and deemed it exempt from further research ethics review on the basis that the analyses were conducted on secondary data that were fully anonymized before being handed to the research team.
Funding
The author(s) disclosed receipt of the following financial support for the research, authorship, and/or publication of this article: This work was supported by Modern Health, Inc., San Francisco, CA.
Guarantor
RJR.
Appendix
Retention rates after 15, 30 and 90 days by region, descriptive cohort.

| N at baseline | N after 15 days | Retention rate after15 days (%) | N after 30 days | Retention rate after 30 days (%) | N after 90 days | Retention rate after 90 days (%) | |
|---|---|---|---|---|---|---|---|
| Africa and Middle East | 486 | 276 | 56.8 | 239 | 49.2 | 160 | 32.9 |
| Asia | 1,0451 | 5399 | 51.7 | 4831 | 46.2 | 3433 | 32.8 |
| Canada | 5972 | 3519 | 58.9 | 3162 | 52.9 | 2325 | 38.9 |
| Europe | 22,126 | 13,262 | 59.9 | 12,004 | 54.3 | 8937 | 40.4 |
| Latin America and Caribbeans | 3848 | 2248 | 58.4 | 2007 | 52.2 | 1403 | 36.5 |
| Oceania | 4472 | 2707 | 60.5 | 2431 | 54.4 | 1860 | 41.6 |
| United States | 130,764 | 78,323 | 59.9 | 70,262 | 53.7 | 52,408 | 40.1 |
| Total | 178,119 | 105,734 | 59.4 | 94,936 | 53.3 | 70,526 | 39.6 |