
Abstract
Background
Unhealthy eating habits are costly and can lead to serious diseases such as obesity. Nutrition apps offer a promising approach to improving dietary behavior. Gamification elements (GEs) can motivate users to continue using nutrition apps by making them more enjoyable, which can lead to more positive behavioral changes regarding dietary choices. However, the effects of users’ preferences and individual characteristics on gamified systems are not yet understood. Current calls for research suggest that personalized gamified systems might lead to user satisfaction, continuous app use, and—ultimately—long-term improvements in diet.
Objective
The aim was to determine the most preferred GEs in nutrition apps and to define clusters of GEs preferences in terms of personality and socio-demographic characteristics.
Methods
We surveyed 308 people to measure their preferences regarding GEs in nutrition apps and applied best-worst scaling to determine the most preferred GEs. Furthermore, we used cluster analysis to identify different user clusters and described them in terms of personality and socio-demographic characteristics.
Results
We determine that GEs most favored are goals, progress bars, and coupons. We revealed three distinct user clusters in terms of personality and socio-demographic characteristics. Based on the individual factors of openness and self-perception, we find that significant differences exist between the preferences for leaderboards and coupons.
Conclusion
We contribute by shedding light on differences and similarities in GE preferences relating to specific contexts and individual factors, revealing the potential for individualized nutrition apps. Our findings will benefit individuals, app designers, and public health institutions.
Introduction
With over 1.9 billion overweight adults and an increasing trend toward excess weight in children, we are facing an enormous health crisis largely caused by unhealthy diets. 1 Obesity, a serious consequence of such diets, often arises in conjunction with insufficient physical activity. This condition can become life-threatening, either by disrupting the immune system or causing psychological suffering, which, in some cases, leads to suicidal thoughts. 2 Equally significant are the implications for public health, including direct and indirect economic costs such as preventive, remedial, or palliative healthcare services, as well as reduced labor supply and output.2,3 Looking ahead, researchers estimate that by 2030, average annual obesity-related medical costs in the US could rise to US$66 billion.4,5 While wider structural inequalities play a significant part in these social, health, and economic issues, it remains important to encourage individuals to make healthy choices regarding food and to assist them in reviewing and reflecting on their habitual diet-related behaviors. 6
Decisions about food can be influenced by many factors, including taste, price, convenience, familiarity, mood improvement, and emotional comfort.
7
When individuals seek to modify their diet, they often encounter barriers like a lack of motivation and confidence.
8
The prevalence of smartphones in daily life has opened up promising avenues through mobile applications (apps) and gamification to positively impact dietary habits by enhancing self-regulation skills.9–11 Previous research on employing gamification elements (GEs) to support healthy eating has shown promising outcomes.12–16 Notably, GEs like collecting points or completing levels in nonentertainment contexts have proven effective in fostering lasting behavioral changes.17,18 For example, features such as points, levels, and leaderboards make users’ efforts in adopting healthier diets visible, offering supportive feedback and enhancing the overall experience of healthy eating, thus facilitating weight loss.19–21 However, despite the potential of gamification to motivate dietary behavior changes, two main challenges persist.
22
Firstly, sustained engagement with the app is crucial for the motivation triggered by gamification to produce significant changes. Studies suggest that users tend to use gamified apps in the long term if they find them enjoyable and have a positive attitude toward gamification.
23
Thus, it's vital to explore context-specific user preferences regarding app design and features.24,25 While some user preferences for GEs may transcend contexts, others may be specific to the dietary domain.26,27 Therefore, our primary research question (RQ) aims to address:
RQ1: Which gamification elements do users of nutrition apps prefer? RQ2: Which distinct clusters of nutrition app users can be differentiated in terms of their preferences? RQ3: What are the socio-demographic characteristics and personality traits of the users in each cluster?
Secondly, many gamification projects fail, in practice, due to inappropriate operationalizations such as “one-size-fits-all” approaches that neglect context and users’ personal needs and preferences.28–31 Schöbel et al. called for research on personalized gamified systems, emphasizing user preferences and their characteristics.
32
Elsewhere, Passalacqua et al. found individualized gamified systems to be more effective than “one-size-fits-all” approaches, as no single GE is most effective at fostering motivation among different users.
33
In this vein, scholars have called for more research to better understand the similarities and differences between users and their preferences across contexts. The hope is to gain a deeper understanding of making IS more attractive to users, which can, in turn, encourage the sustained use of motivational apps.27,34,35 For GEs to reach their potential—and, in this case, foster lasting changes in users’ dietary habits—they need to be aligned with user preferences and needs in specific contexts. As a result, there is an urgent demand for an increased understanding of users’ needs and preferences regarding GEs.26,36,37 Hence, our second and third RQs are:
To answer our RQs, we expand existing efforts in this context (Anonymous et al., blinded for review) by conducting a multi-method approach. Thereby, the paper continues as follows. After providing relevant theoretical background information, we describe a comprehensive, structured literature review to identify the GEs suited to food diet contexts. From there, the structure of an online survey based on a best-worst scaling (BWS) approach to identify participants’ GE preferences is presented. We applied cluster analysis and examined distinct clusters of individuals, which we describe below in terms of their preferences, personality traits, and sociodemographic characteristics. Finally, we discuss our results with reference to related fields and insights we gained about different users based on individual factors and present the theoretical and practical contributions of this work.
Theoretical background
Dietary behavior change using gamification
Traditional information-based approaches to enhancing knowledge may have been successfully applied to nonhabitual behaviors. Yet, these approaches are ineffective at changing highly habitual behaviors related to food and diet. For habitual behaviors, interventions targeting self-regulation skills may be more effective.38,39 Self-regulation describes the motivational, intentional, and action-oriented process of implementing and maintaining health-promoting behaviors. 40 Individuals go through two different processes to change their behavior by turning an intention into an action: (1) goal setting (motivation phase), which establishes behavioral intention, and (2) goal pursuit (volition phase), which leads to the enactment of healthy behavior. 40 These processes are influenced by phase-specific self-efficacy, which describes the individuals’ strength or belief in their capacity to complete tasks successfully and overcome challenges. 40 The intention-behavior gap is often more significant for habitual behavior, as in the case of diet, which emphasizes the need for interventions in the volition phase.39,41 People who have already downloaded a behavior-change nutrition app are, arguably, motivated to improve their dietary behavior but may struggle during the second phase (goal pursuit) to turn intention into action and use the app long-term (intention-behavior gap). Hence, a supportive environment for dietary decision-making might remove this lack of self-efficacy by motivating people and overcoming the intention-behavior gap.
Motivation is influenced by fulfilling the three basic needs: the needs for competence (also named mastery), autonomy, and social relatedness. 42 Gamification interventions can address the fulfillment of these three needs.41,43 Gamification is commonly defined as the “use of game design elements in non-game contexts”. 44 An emphasis is placed on “elements” as this differentiates gamification from serious games, which describes the “use of complete games for nonentertainment purposes.” 44 Gamification researchers often differentiate three GEs based on the mechanics, dynamics, aesthetics framework by Zichermann and Cunningham. 45 While game mechanics refer to functional components visible to the user (e.g., points, leaderboards), game dynamics determine the users’ reactions in accordance with the mechanics (e.g., bluffing when playing cards). 46 Lastly, game aesthetics define users’ emotional responses when interacting with the gamified system. In this study, GEs refer to game mechanics, which are visible to the user. 45
Different lists of GEs and their categorization have been identified in previous gamification studies. Thiebes et al. identified 31 game mechanics and dynamics structured in five clusters (e.g., cluster rewards include badges, point system, and achievement). 46 In comparison, Hsu et al. and Hamari et al. identified nine GEs, and Scheiner seven.29,47,48 Bedwell et al. identified 19 game attributes (e.g., challenge, fantasy, and control). 49 These differences lead to different uses and combinations of GEs in IS research. Thiebes et al., for example, defined competition as a GE, while, in other studies, competition is used as a category, not as an element. 46 Hsu et al. use achievement to categorize the GEs’ rewards, goals, reputation, and status, while Thiebes et al. use achievement as GE in the category of rewards.46,47 Our work focuses on ten GEs (see Table 1), which are mostly studied in food-related gamification research as described in the section “Research Process and Results.”
GE selection.

Note: GE = gamification element.
Several researchers have emphasized the importance of the underlying application context and the users’ preferences when including GEs in IS.29,32,34 Even though dietary behavior is highly habitual and individual, so far, there are mainly “one-size-fits-all” approaches, neglecting the different target users’ preferences and characteristics that have been studied.28–30
Individual gamification preferences dependent on the underlying context
Both Tondello et al. and, more recently, Passalacqua et al. state that personalized gamified systems are more effective than “one-size-fits-all” approaches, emphasizing a need for personalized gamified systems that suit users’ preferences based on their individual characteristics.33,38 User satisfaction and a positive attitude toward gamification play a central role in continuous app use.23,50 Therefore, analyzing users’ preferences is crucial to support user satisfaction and a positive attitude toward gamification and, thereby, continuous app usage. To date, two different research streams on users’ preferences for GEs have been identified. We build on and extend these streams: Studies in the first stream focus on personalized gamification based on users’ personality traits and/or individual characteristics, for example, self-perception and/or sociodemographic data.24,51–53 People differ in how they behave and how they approach tasks due to their personality traits. 54 For example, Tondello et al. broadly define six different gamification user types rooted in personality traits. 51 “Personality traits” hereby refer to individual characteristics that are stable over time, provide reasons for human behavior, and are rooted in an individual's psychology. 55 A model commonly used to analyze individuals’ personality traits is the Big Five model, structured around the five dimensions of extraversion, agreeableness, conscientiousness, neuroticism, and openness to experience.56,57 In other studies, Self-perception (also termed self-esteem by Rosenberg) has been the focus.52,58 Self-esteem refers to a favorable or unfavorable attitude toward oneself, for example, feelings of unworthiness for low self-esteem. 58 Findings of studies in this stream are meant to enable optimal designs for specific and a priori defined target groups, accounting for individual factors and independent of any underlying context. As IS—in combination with artificial intelligence—acquires the ability to better understand its users, the personalization of gamification is one of the most pressing issues in gamification research. 32
Studies in the second research stream point to the importance of the underlying context and evaluating GEs therein, such as social media platforms for improving vegetable intake (e.g., 59 ) or Internet-of-things-enabled apps for passing on energy-saving recommendations to employees. 60 In the context of education and physical activity, prior studies have analyzed users’ GE preferences.26,36 Schmidt-Kraepelin et al. found similarities—as well as several disparities—between the contexts of education and physical activity. 26 This emphasizes the importance of separately investigating users’ preferences in each underlying context (i.e., food vs. education) to support user satisfaction and encourage continuous app usage. 50 Despite this understanding, there exists little to no prior research on users’ gamification preferences that combines both research streams in the context of healthy eating. This is even though diet is understood to be one of the main contributing factors to individuals’ health. More research is needed to better understand the similarities and differences in users’ GE preferences in relation to the underlying contexts. Riar recently pointed out that users can fundamentally differ in their needs and design preferences for GEs. 37 Analyzing users’ preferences is recognized as a key step in the development of a broad range of apps, yet not, it seems, in the development of many diet-focused apps. This is despite evidence to suggest that designs based on analysis of user preferences foster higher user retention and actual and long changes in dietary habits.14,29,50,61 The task here is not only to design GEs to match a target behavior: We must also continue to deepen our understanding of the needs of different kinds of users by examining the relationship between personality types and different GE design options.27,37,62 Such an understanding would provide us with a solid basis for identifying which GEs relate to user needs and for better-linking design decisions with a target group. 27
Research process
We applied a sequential multimethod approach consisting of three steps (see Figure 1). For data collection, we first conducted a literature review to identify the most common GEs. Based on the results, we surveyed the BWS approach to analyze associated user preferences for GEs in the context of diet and food choices. Along with the BWS approach consisting of ten GEs, we included control variables and the known Big Five.56,57 In the second step, we analyzed the data collected during the survey.

Research process consisting of three steps: literature search, data collection, and data analysis.
Step 1: Literature search
Methodology of literature search
In Step 1, we conducted a structured literature review of GEs in nutrition apps to identify the most analyzed elements. 63 Since there is an unlimited number of GEs, we decided to limit the scope of investigated GEs to the ten most significant in the food field. Even though the context of diet is closely related to the context of physical activity, we decided not to adapt the list of GEs found by Schmidt-Kraepelin et al., who focused on literature in the context of gamification and health behavior change support systems for physical activity. 26 As suggested by vom Brocke et al., Webster and Watson, and Wolfswinkel et al., our literature review comprised five steps (Figure 1).63,64 We expanded an existing literature review in this context (Anonymous et al., blinded for review) by changing the search string, using broader databases, and refining inclusion and exclusion criteria. When designing the search string, we considered three components: First, we included the terms (gamif* OR game*) to cover gamification in general. We extended this by focusing on gamification studies in the field of healthy diet and added AND (nutrition* OR diet* OR “weight loss”). Lastly, we added the term AND (app* OR system*) to focus on GEs implemented in an app or any IS. The literature searches were conducted in two comprehensive databases, the Association for Information System Electronic Library (AISeL) and the Scopus database, including all other potentially relevant databases, for example, Springer or IEE. 65 AIS eLibrary specializes in IS and covers conference proceedings, which are typically more up-to-date, which is why we added it to the Scopus database. 66 We excluded nonacademic publications and focused on conference papers, articles, reviews, and book chapters. The search string was applied to title, abstract, and subject in AISel and to title, abstract, and keyword in the Scopus database.
The search was run in March 2021 and initially yielded seven hits from the AISel database and 234 from Scopus. After filtering for English articles and removing duplicates, our set consisted of 240 articles. Next, we conducted a three-step selection process, including title, abstract, and full-text review using our predefined exclusion (EC) and inclusion criteria (IC): (EC1) the paper deals with gamification in any domain other than diets or only mentions the concept of gamification without providing further research; (EC2) the paper deals with gamification to educate about healthy dietary behavior; (EC3) the paper deals with serious game design. (IC1) The paper focuses on the use of gamification in the context of diets and food choices; (IC2) the paper evaluates gamified nutrition apps that aim to improve dietary behavior by tracking food intake; (IC3) the paper provides empirical evidence regarding the impacts and outcomes of gamifying diets and food choices. Finally, we were left with a set of 25 studies (see Figure 2 for further details).

Structured literature review: selecting relevant articles.
Next, we analyzed the remaining 25 studies, searching for GEs that had been shown to improve eating behavior by tracking food intake. A total of 10 such GEs were identified (see Tables 1 and 2). Mindful of the varying definitions and categories found in prior research (see Section “Theoretical Background”), we excluded GEs belonging to a serious game design like story and fantasy, which we have already mentioned as an EC in our literature review. 67 As game dynamics and aesthetics are not visible to the user, we focused on users’ preferences for game mechanisms. Hence, we also elected to exclude the element achievement, which can be classed as game aesthetic, and the element challenges, which belong to gamification dynamics. 68 Next, we counted the number of times a GE was analyzed in prior studies identified during our literature review and focused our attention on the 10 GEs most frequently mentioned.
Screenshots and definitions of the 10 GEs analyzed.

Included GEs based on literature search
The following GEs were addressed most frequently in the 25 studies identified: Player as an avatar, progress bar, goals, leaderboard, levels, badges, points, virtual currency/items, coupons, and social interaction (for a definition, please see Table 2). This list differs from previous efforts in this context (Anonymous et al., blinded for review) as we identified and analyzed more research papers in the structured literature review. A detailed overview of the papers identified in the literature review can be found in Appendix B.
Step 2: Data collection
BWS is a particular type of conjoint analysis first applied by Szeinbach et al. in health care. 79 In this process, the participant repeatedly chooses two objects from a changing set of three or more objects–one they prefer most (best) and the one they like the least. 80 The BWS approach holds several advantages for our research compared to similar preference elicitation methods or simple rankings. First, each element is analyzed separately, forcing the participants to weigh the objects. 81 The approach is scale-independent; therefore, it does not suffer from potential order effects. 27 To apply the BWS method, we collected data via an online survey (similar to the approach of Anonymous et al., blinded for review but expanded to include different GEs and questions on personality, among others). The survey consisted of an introduction and four sections involving questions. Firstly, participants were asked to imagine that they had decided to improve their diet and to support this process by looking for a nutrition app. Next, ten different GEs were explained (see Table 2). For each GE, we created an exemplary screenshot that was shown to participants to help them visualize the GE. For example, the GE goals involved instructions such as “drink at least eight glasses of water a day to get enough fluids.” The screenshot displaying the GE leaderboard showed a ranking of all users, including the participant who was ranked in the middle. The progress bar showed the user’s progress, with a bar just over half full indicating, for example, remaining calories or fat intake.
Once the GEs had been explained, the BWS procedure started, and we measured the dependent variable. Participants stated their GE preferences: Firstly, the nutrition app presented sets of four GEs from which participants identified the GE they liked most (best) and the GE they liked least. Based on a recommendation made by Orme, we created 15 different blocks, each consisting of four different GEs (see Table 3). 82 Hence, each GE occurred in six different question blocks (see Appendix A).
Bundles of GEs in BWS.
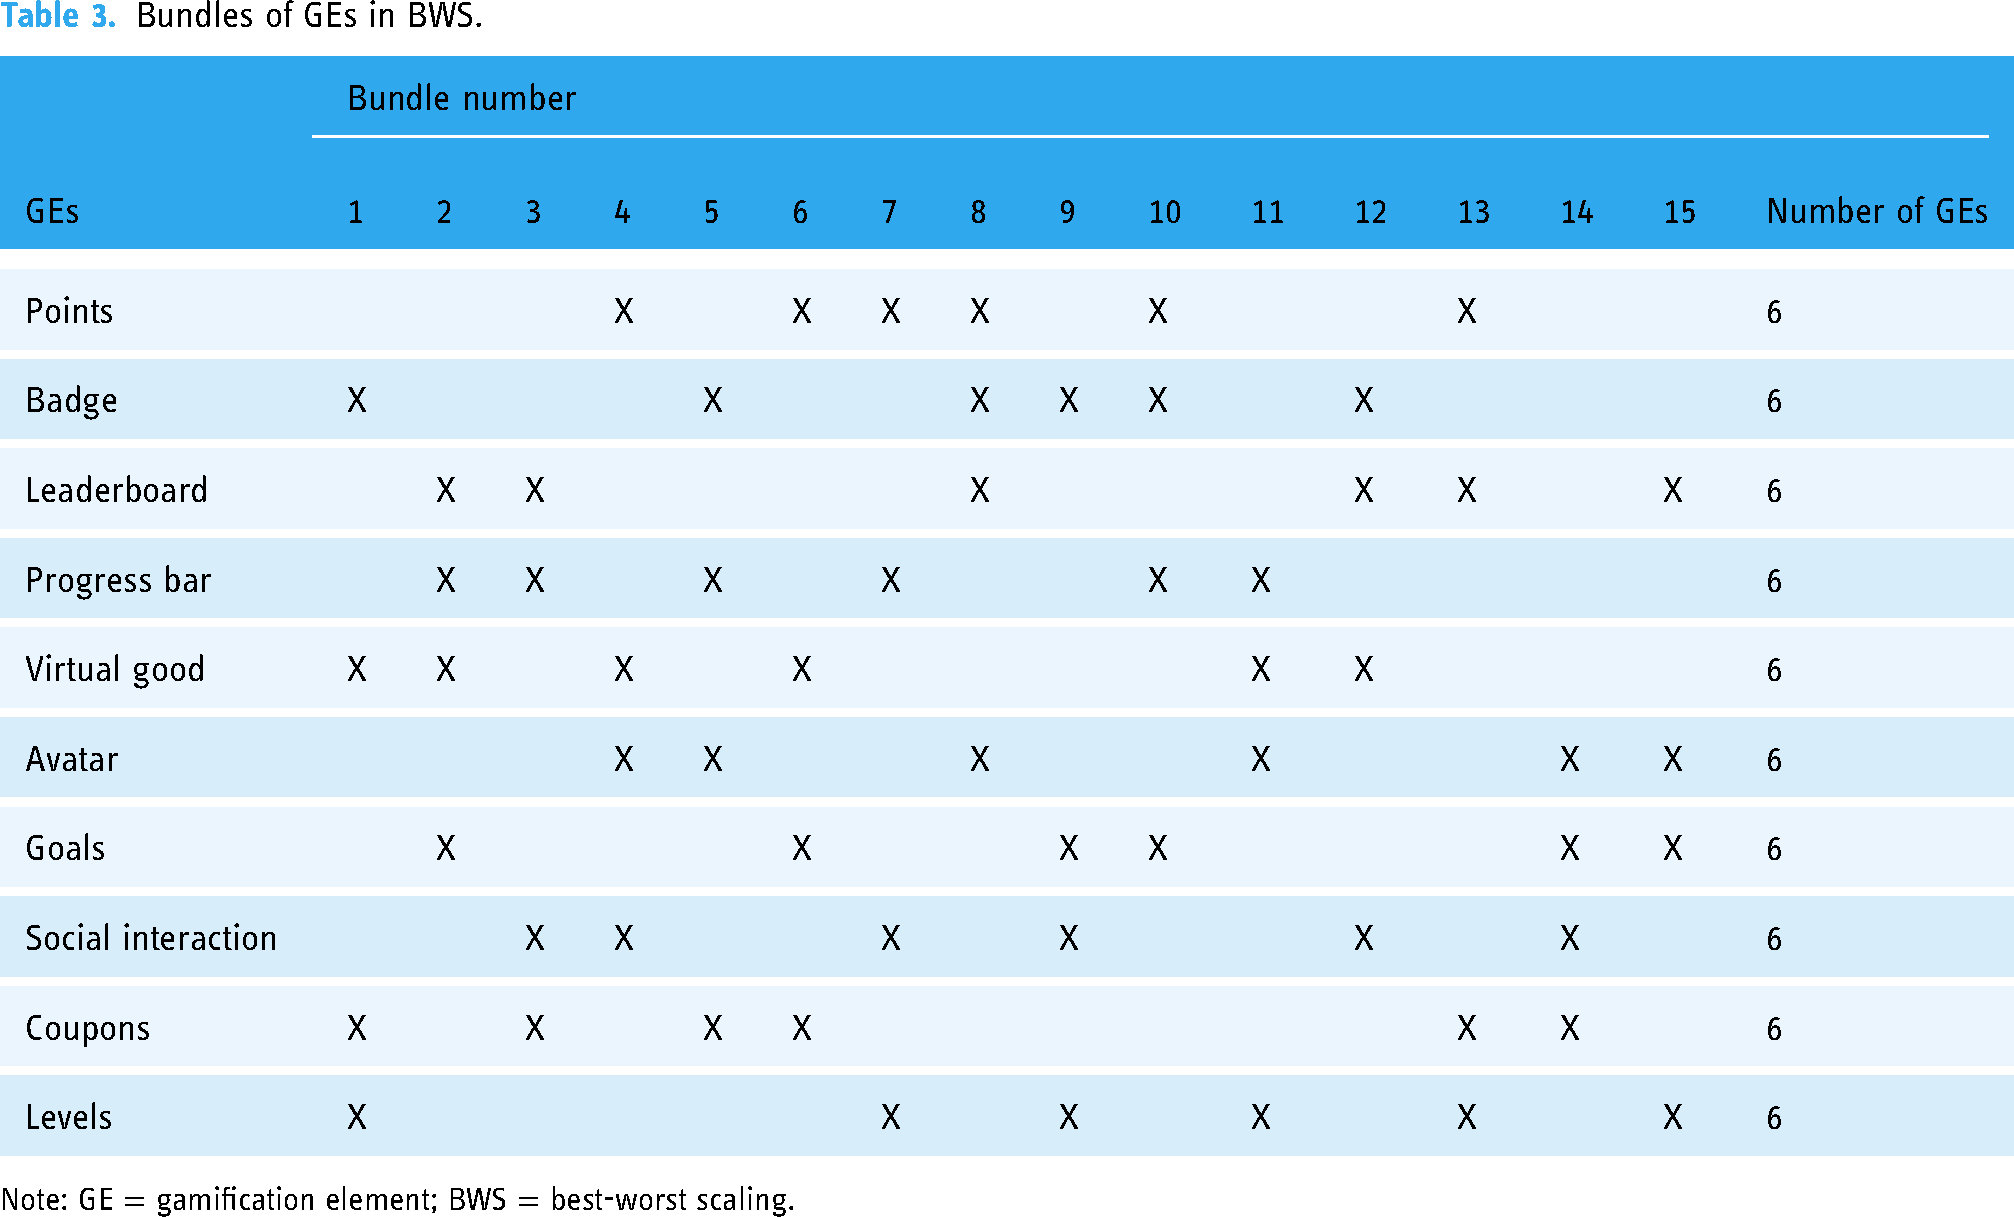
Note: GE = gamification element; BWS = best-worst scaling.
In the next section, we asked the participants whether they would prefer to see their friends or anonymous users in social GEs such as leaderboards. We also asked questions concerning individual diet goals and where participants felt they were most likely to fail in efforts to improve their diets.22,83,84 We then asked the participants about their prior experiences with nutrition apps containing GEs. Finally, we measured the individual self-perception of each participant using the measurement scale by Rosenberg (see Appendix A) and asked them to answer an abbreviated form of the Big Five questionnaire (see Appendix A).58,85 Including the 15 BWS questions, the survey consisted of 50 questions and took an average of 15 min to complete (see Appendix A). The final task was to gather information on the sociodemographic characteristics of age, gender, family status, educational level, and monthly income. As an incentive, we raffled two gift boxes from the company Little Lunch. Before distributing the survey, it was tested on family and friends and a professional external research panel.
Participants were recruited through Amazon’s Mechanical Turk (MTurk). MTurk is a crowdsourcing platform and a suitable survey tool for collecting individual-level data. 86 Mturk enables the recruitment of a representative sample of the US population regarding gender, age, and education. Moreover, research indicates that survey data obtained through MTurk tends to exhibit higher reliability compared to data collected through traditional methods.87,88 Mturk has already been used in numerous studies at the interface between gamification and healthcare.89,90 For these reasons, we considered Mturk to be an appropriate platform for recruiting survey participants for this study. Participants who were native English speakers were exclusively included in the study. The objective was to secure a diverse sample encompassing a wide range of genders, ages, and educational backgrounds. An overview of the demographic attributes of the participants is presented in Table 4. We used one control question to review the quality of respondents’ answers and exclude invalid responses. The data were checked for completeness and meaningfulness, ensuring that each questionnaire had been filled out in its entirety and that participants had not selected the same GEs as those they most and least favored. All completed questionaries met these requirements, meaning that none were excluded.
Demographic information.

Step 3: data analysis
BWS approach to answer RQ1
We undertook a counting analysis and an analytical closed-form solution of a multinomial logistic (MNL) regression to define the ranking positions.82,91 For the counting analysis, the difference in the number of times an element was chosen as most and least preferred was calculated and divided by the number of times the element appeared in a set (in our case, six), multiplied by the number of total participants (in our case, 308). 92 The results of the counting analysis provide a standardized mean value (SD). The std. means reflected the participants’ collective preference for the GE and took values between −1 and 1. The higher the value, the more often participants preferred an element.27,80
The simple normalized best-worst (BW) scores served as a good approximation of the true scale scores calculated by an MNL model.92–94 The counting analysis did not provide us with estimates of the uncertainty around the scores used to calculate the utility coefficients (Coefficients) and standard errors (SE) from the MNL model. 91 The lower bounds (LB) and upper bounds (UB) represent a 95% confidence interval in relation to the coefficients. 95 When comparing their analytical BW scores to the results of BW scores normalized via a counting analysis, Lipovetsky and Conklin found the closed-form solution to be a more accurate descriptive statistic for aggregate best-worst choice probabilities. 91
The results of both computations are presented in Table 5. The dashed line in Table 5 separates the elements that are, in sum, positively rated from those that are negatively rated. The GEs most favored are goals (Rank 1), progress bar (Rank 2), and coupons (Rank 3), while the GEs least favored are social interaction (Rank 8), virtual good (Rank 9), and avatar (Rank 10).
GE preferences.

Note: GE = gamification element; BW = best-worst; SE = standard errors; LB = lower bounds; UB = upper bounds.
Cluster analysis to answer RQ2
To address RQ2, we carried out a cluster analysis (k-means) on the mean BW scores of the ten GEs. K-means was first introduced by MacQueen but is still popular due to its easy-to-implement, simple-to-use, and empirical success.96,97 K-means clustering methods are more robust against outliers, the choice of distance metric, and the inclusion of irrelevant variables compared to hierarchical methods. 98 In addition, we compared the results with the results of a hierarchical clustering method with wards minimum variance method and squared Euclidian distances to confirm the choice of our clustering method (K-means). The results of the hierarchical cluster analysis can be found in Appendix D. Our respondents’ cluster membership provided the dependent variable, and the respondents’ mean BW scores provided the independent variable. That is, we clustered respondents in terms of the similarity of their preference orders. Deciding between different cluster solutions (i.e., the number of clusters) always involves a trade-off between manageability and homogeneity within each cluster. 99 When determining a suitable number of clusters, we assessed multiple cluster solutions for their interpretability. To determine the optimal number of clusters, we compared the Silhouette coefficients and the sum of square errors (SSE) for different cluster solutions. Silhouette coefficients provide a cluster quality measurement that is independent of the used clustering algorithm. 100 Kaufman and Rousseeuw propose that an average Silouhette coefficient above 0.50 can be interpreted as a reasonable number of clusters. 101 The results of the Silouhette coefficient indicate two or three to be a reasonable number of clusters. The SSE using three clusters is smaller than two clusters. Based on these results, we decided to apply three clusters with a Silhouette coefficient of 0.54 and an SSE of 16,729.24. The silhouette coefficients and SSEs for different numbers of clusters can be found in Appendix B.
Statistical analyses of gamification clusters to answer RQ 3
Our next set of analyses addressed the third RQ. First, we describe the three different clusters concerning their GE preferences based on BW differences by cluster. We compute the t-statistics to compare the t-statistics for each cluster with the rest of the sample and Kruskal–Wallis test statistics to identify significant differences in the BW ratings between the clusters. We described the clusters in terms of membership, meaning people's nature and characteristics within the clusters, using simple univariate comparisons and chi-square (χ2, in case of nominal variables) and Kruskal–Wallis (H, in case of ordinal variables) test statistics to identify significant differences between the clusters.
To better understand the clusters and describe them in terms of attitude and personality, we conducted a series of analyses based on the GEs use preferences and history (i.e., individual diet goals, likely failures of dietary change, and prior experience with nutrition apps containing GEs) and personality traits (i.e., self-perception and Big Five) as measures in the survey. We used Pearson's contingency coefficient (C) to statistically assess the differences regarding prior experience with nutrition apps, individual diet goals, and failures of dietary change among the clusters. C is a measure of association between two categorical variables, and chi-square is used to compare data in a contingency table. 92 We used the adjusted contingency coefficient developed by Ott et al., which enables comparisons across differently-sized contingency tables. 93 We evaluated the significance of association (i.e., C) via the chi-square test with Monte Carlo simulation, as suggested by Hope.102–104
Regarding respondents’ personality traits, we assessed self-perception and Big Five scores, focusing on reliability levels using Cronbrach's alpha. Concerning respondents’ personality traits, we evaluated the self-perception and Big Five scores. We performed Kruskal–Wallis tests to indicate significant differences between the clusters. To elucidate the differences between all clusters, we conducted Wilcoxon rank-sum tests.
Results
In the following, the three different clusters are first examined in terms of their GE preferences. The results are then presented in regard to differences between the clusters in terms of socio-demographics, previous experience with dietary apps, individual dietary goals, and failure of dietary change. Finally, the results are presented in relation to the respondents’ personality traits (self-perception, Big Five).
The weightings of GEs that matter to the different clusters are complex, as presented in Tables 6 and 7. Table 6 ranks the GEs based on the mean BW score for each cluster. Thus, it shows in an aggregated fashion how the clusters value different GEs. Table 7 compares the t-statistics of the BW rating for each cluster with the rest of the sample, thus formally showcasing their differences. For example, respondents in Cluster 1 tend to rate leaderboards, progress bars, and goals lower than the average for all respondents in Clusters 2 and 3. Conversely, those same respondents rate virtual goods and coupons significantly higher than the other clusters. The results of Table 7 also allowed the comparison of different clusters. For example, Clusters 2 and 3 are very similar in their emphasis on virtual goods and social interaction. Yet, these clusters also diverge in their ratings of, for example, badges or avatars. Results of a Kruskal–Wallis test show that the clusters differ significantly in their mean BW scores besides their BW scores for social interaction and levels (see Table 7).
The rank order of the GEs based on BW differences by cluster.

Note: GE = gamification element
Cluster groups, Kruskal–Wallis H, and t-statistics for mean BW scores.

Note: Bold indicates a t > 3.00 (strong above-average orientation), as Auger et al. 105 stated. Italics indicate a t < –3.00 (strong below average orientation). BW = best-worst.
*p < .05; **p < .01; ***p < .001
As Table 7 only shows the difference between each cluster and the rest of the sample, Figure 3 shows the mean BW score of each cluster’s GEs. This delivers further insights and is easier to understand. Firstly, the mean BW score enabled us to evaluate how each cluster rated each GE (positively or negatively). For example, leaderboards are rated as being of little importance, yet Cluster 2 rates this technology as highly important. Secondly, we observed that clusters give some GEs an extremely high or low rating (e.g., coupons and avatars in Cluster 1), while some GEs average around a zero in their mean BW score (e.g., the badges in Cluster 1). Thirdly, Figure 3 clearly shows an opposite trend between Cluster 2 and the other two clusters in some GEs.

Best-worst rating of GE by clusters (ranked from high to low based on total).
Table 8 presents cluster differences based on socio-demographic characteristics. A quick overview of the results reveals that members of Cluster 1 are in their end-thirties, while the other two clusters, on average, represent participants in their mid-thirties. Furthermore, Cluster 1 has the highest percentage of males, singles and the highest net income.
Cluster groups and descriptive statistics.
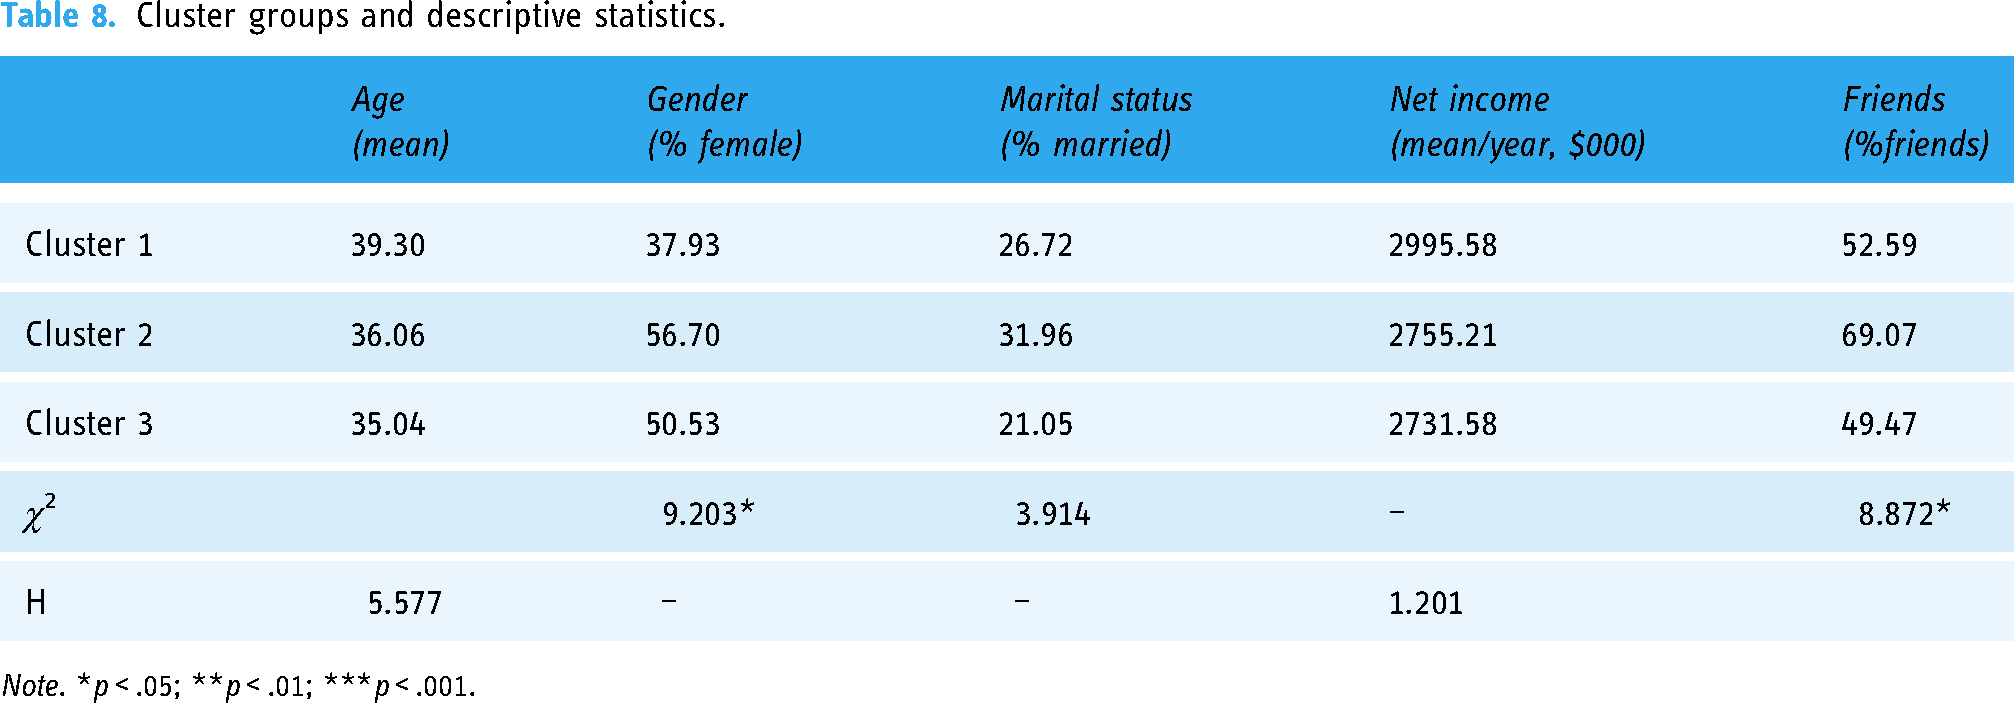
Note. *p < .05; **p < .01; ***p < .001.
Chi-square (χ2, in case of nominal variables) and Kruskal–Wallis (H, in case of ordinal variables) test statistics, also stated in Table 8, indicated how heterogeneous the clusters are. While the clusters differ less in their distributions of age, they vary significantly in terms of gender and education.
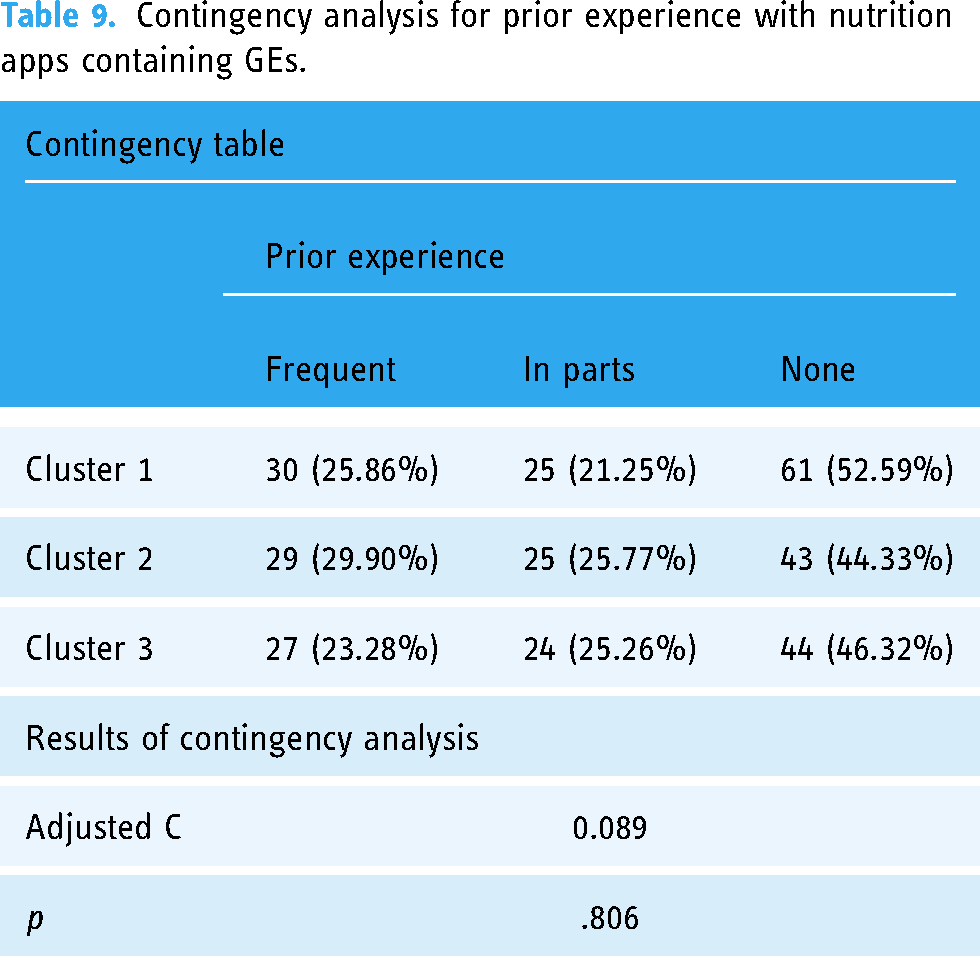
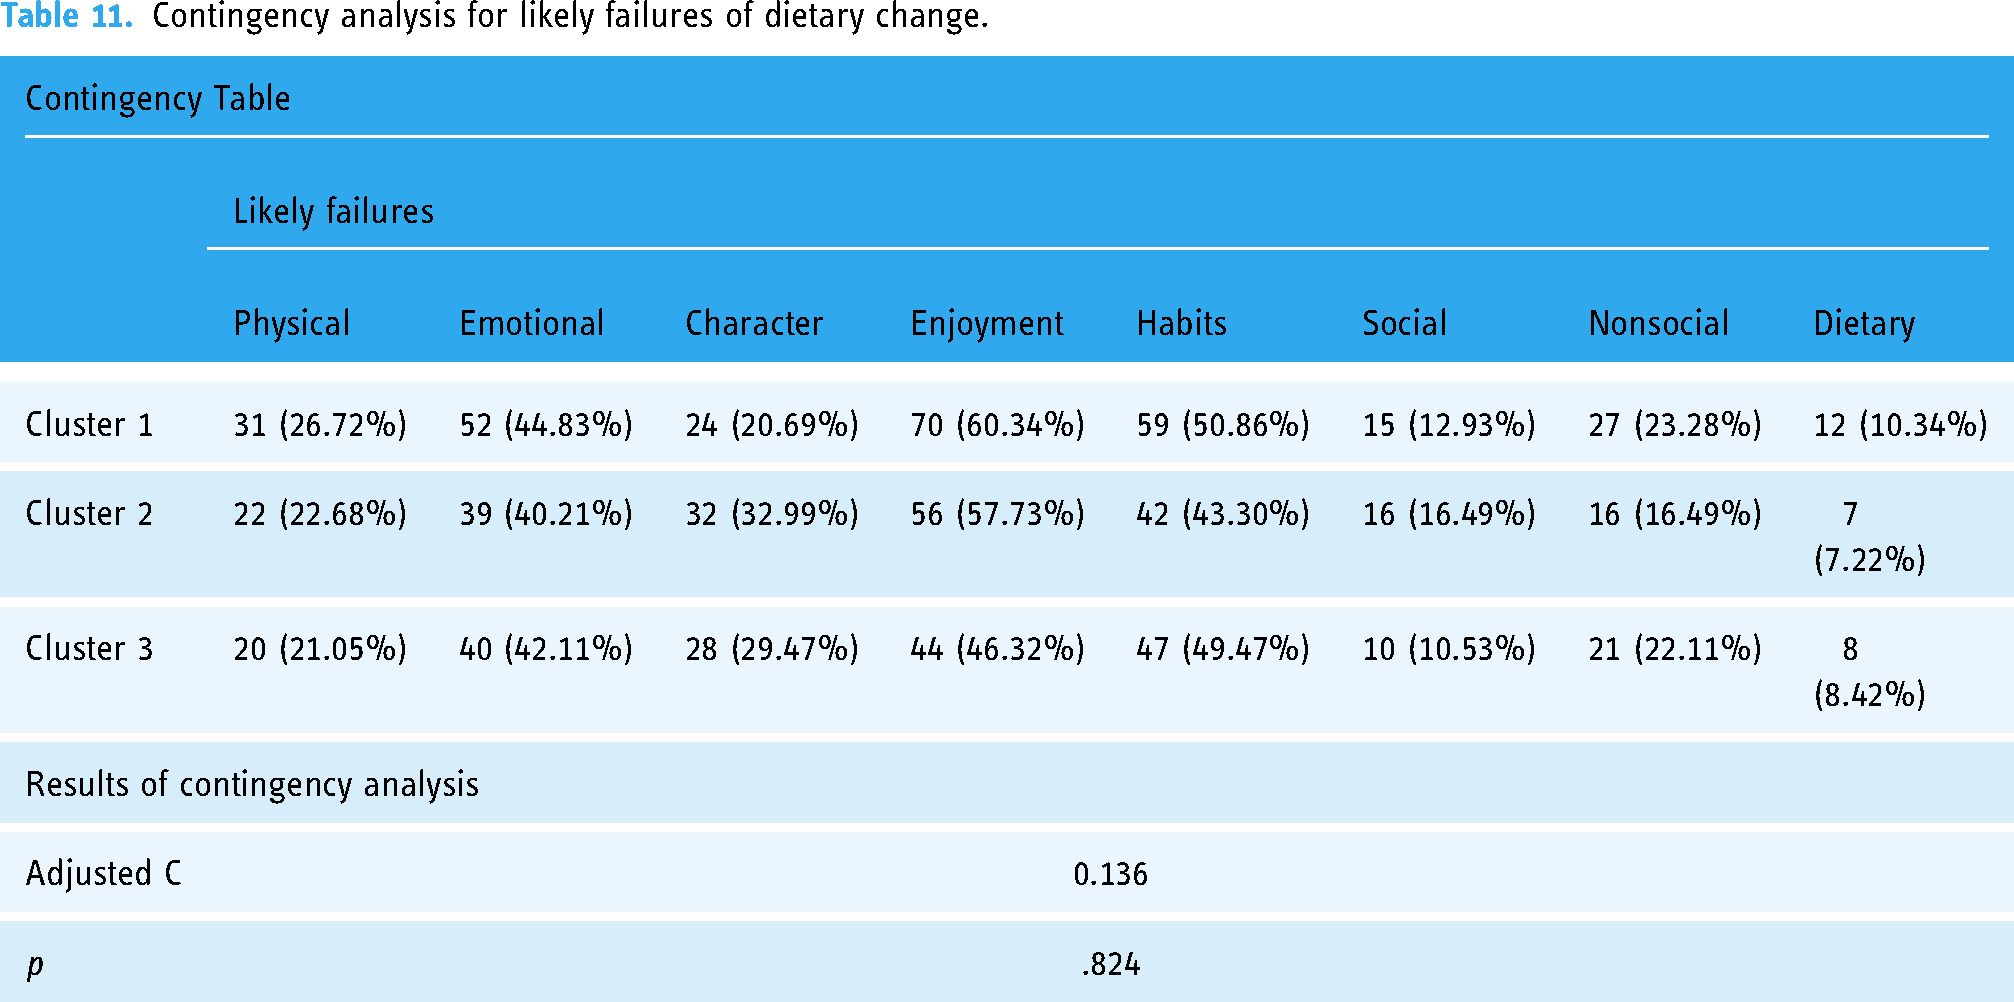
Tables 9–11 summarize the results of the analysis of the user preferences. The rows of each contingency table represent an assignment to one of the clusters. The columns refer to categorical variables describing the dimensions of each cluster’s usage preferences or experience with nutrition apps containing GEs. Data in each cell present the number of observations (i.e., survey respondents). There are no significant differences for any dimension.
Contingency analysis for prior experience with nutrition apps containing GEs.
Contingency analysis for individual diet goals.

Contingency analysis for likely failures of dietary change.
With regard to respondents’ personality traits, we evaluated the self-perception and Big Five scores. Cronbach’s alpha values of 0.933 (self-perception) and 0.601–0.907 (Big Five) indicate modest to excellent reliability levels for both scores. 106 Comparing the self-perception scores for the three clusters reveals Cluster 3 to have the highest self-perception score of 20.200 (SD = 5.949), followed by Cluster 2 with 18.474 (SD = 5.939), and Cluster 1 with a score of 18.862 (SD = 6.971). A Kruskal–Wallis test indicates significant differences between the clusters (H = 4.782, p = .092). Wilcoxon rank-sum tests reveal marginally significant differences at the 10% level between Clusters 1 and 2 (p = .093) as well as between Clusters 2 and 3 (also p = .093).
Equivalent testing of the Big 5 scores broadly confirms the results above (H = 2.834, p = .242). Only in the trait’ openness’ do the clusters differ. A Kruskal–Wallis test indicates significant differences between the clusters (H = 9.252, p = .010). Examining the simple results of the openness scores reveals that Cluster 2 has the highest openness score of 13.701 (SD = 4.681), followed by Cluster 3 with 12.157 (SD = 4.365), and Cluster 1 with an openness score of 11.922 (SD = 4.779). Again, to elucidate the differences between all clusters, we conducted Wilcoxon rank-sum tests. The tests reveal significant differences between Clusters 1 and 2 (p = .015), and between Clusters 2 and 3 (p = .022), but not between Clusters 1 and 3 (p = .763). Figure 4 plots the three clusters’ self-perception and Big Five scores, illustrating similarities and differences.

Comparison of Big Five dimensions and self-perception across clusters
Discussion
Users can be inherently different when it comes to their needs and design preferences. Therefore, to encourage target behaviors, we must align gamification design options with users’ preferences to support continuous app usage and individual characteristics to enable personalized gamification.32,50 In this study, we investigated which GEs connect with which user preferences and whether linking design decisions with the specifics of a target group is potentially superior to a “one-size-fits-all approach” in the context of nutrition apps. To this end, we formulated three RQs at the front end of the paper. The first RQ referred to users’ preferences for different GEs in nutrition apps. Our results provide a clear ranking; the elements goals, progress bar, and coupons are strongly preferred, pointing to individuals’ preferences for (1) cognitive motivational sources and (2) extrinsic motivators. Accordingly, food-related apps could be designed to incentivize users to achieve self-set goals and/or provide them with immediate performance feedback.36,40,107 The poor performance of leaderboard, social interaction, virtual good, and avatars imply that the average nutrition app users in our sample may experience a lack of tangibility and/or feel under pressure of failure when compared to others, which is in line with prior research on the matter.36,53
A comparison of our results with the results of similar counting analyses in the contexts of physical activity and learning management systems (LMS) shows that preferences concerning GEs partly differ across contexts.26,36 The GEs most favored in the context of physical activity are the progress bar (Rank 1), goals (Rank 2), and points (Rank 3). Many existing physical activity and health apps, such as Step Counter, Fitbit, or Weight Loss, integrate GEs that foster competition and collaboration. 107 Yet, our results indicate that users of nutrition apps do not prefer competitive approaches. These findings are similar to observations made in the context of education. 36 As in our research on nutrition apps, the GEs least preferred in the context of physical activity are virtual goods (Rank 8), social interaction (Rank 9), and avatars (Rank 10). On the other hand, the GEs most preferred in the context of LMS are levels (Rank 1), points (Rank 2), and goals (Rank 3), while the GEs least preferred are avatar (Rank 8), time pressure (Rank 9), and loss aversion (Rank 10).
Another of our findings is that while the users of nutrition apps we surveyed prefer to set goals and be rewarded when these are reached, they prefer external rewards (i.e., coupons) over internal rewards (i.e., virtual goods). More generally, it has been observed that the majority of apps that focus on supporting mental health offer integrated internal rewards, while apps for physical activity tend to focus on external rewards 107 ; hence, our study suggests that users of nutrition apps prefer reward strategies akin to those offered by physical activity apps. Lastly, the finding that avatars are the GE least preferred by nutrition app users also tallies with users’ preferences observed in other studies of physical activity apps. 27 This finding may relate to the fact that relatively few apps use avatars, meaning many users are likely to be unfamiliar with this GE. 108
Further commonalities and differences can be identified when comparing preferences for GEs in nutrition apps, physical activity, and LMS.26,36 Points, progress, and goals are among the most preferred GEs in all three contexts, supporting Schmidt-Kraepelin et al. in their assumption that definite preferences for specific GEs exist across contexts. 26 Social elements such as social interaction or leaderboards tend to be rated weakly in all contexts, raising the question of whether current GEs are failing to address a present-yet-unrecognized need for social relatedness. Preferences for leaderboards are stronger in the context of physical activity than in the context of nutrition apps and LMS, perhaps reflecting the more competitive nature of sports compared to LMS and nutrition. So, while dietary behavior might be perceived as more individual and private than physical activity, our results suggest that social relatedness is less valued in the former context.
Our second RQ aimed to identify clusters of nutrition app users based on the diverse preference orderings observed in response to our first question. Subsequently, the third question sought a detailed description of each cluster concerning sociodemographic characteristics and personality traits. We identified three distinct clusters. While these clusters differ in sociodemographic characteristics, their average scores from our chosen personality measures do not significantly vary. However, two specific personality facets, openness to change and self-perception, exhibit significant differences across clusters, suggesting considerations for GE design choices. Regarding the remaining personality traits, such as neuroticism, agreeableness, conscientiousness, and extraversion, GE designs may favor a “one-size-fits-all approach,” as our findings show no significant differences. Therefore, we cannot confirm previous findings regarding the impact of personality traits on preferred GEs.24,51,53
Cluster 1 primarily comprises male users (62.07%) in their late thirties, with a relatively high net income (US$2995.58) and a preference for routine. Also, Cluster 1 members are more resistant to change than other nutrition app users (i.e., users in Cluster 2). Cluster 2 consists mostly of female users in their mid-thirties, characterized by a high level of openness. Cluster 3 represents users with slightly higher self-perception scores, indicating users with high levels of self-worth and self-acceptance–statistically speaking, significantly higher than Cluster 2. Additionally, Cluster 3 users have a preference for anonymity. Analyzing preferences for GEs, we found that Clusters 1 and 3 share similar preferences, favoring points, goals, and levels while disliking leaderboards and social interaction.
In contrast, Cluster 2 users prefer progress bars and leaderboards, with a notable preference for openness. In particular, the high score of the element leaderboards in Cluster 2 stands out against the low approval rating in the overall sample. While we argue that users of nutrition apps do not generally value competitive approaches, particularly open-minded users may appreciate GEs like leaderboards, feeling these do help them to stay motivated when changing their diet. This observation aligns with previous research indicating that leaderboards may enhance motivation, particularly for users with low self-efficacy. 52 Wu et al. found that self-efficacy moderates the effect of leaderboards on users’ motivation to perform physical activity. 52 The effect increases for low self-efficacy. Users in Cluster 2 score lowest in self-efficacy but hold a higher preference for leaderboards than those in Clusters 1 and 3. Also notable for Cluster 2 is the lowest rating of avatar (−3.51 in Table 6) compared to the rating in Clusters 1 and 2 (−2.64 and −2.45, respectively, in Table 6). This goes along with the findings of Jia et al., who found that people with high levels of openness (here: Cluster 2) are less likely to be motivated by avatars. 40
Looking closely at our results, some further points stand out: firstly, the mean BW scores for Cluster 1 fluctuate closely around zero for some GEs, indicating different views on these GEs (i.e., levels, progress bars, badges). However, analysis shows that this cluster cannot be further divided. All clusters are pronounced in their strong positive or strong negative opinions. In particular, Cluster 3 shows a strong tendency toward pronounced acceptance or rejection of some GEs (e.g., the second-highest overall mean BW rating of +3.51 for progress bars and the second-lowest overall rating of −3.42 for leaderboards). Overall, our findings provide insights into the relationship between user clusters, personality traits, and preferences for GEs in nutrition apps.
Contribution to existing literature
We contribute to existing knowledge on personalized gamification to promote healthy behavior. Specifically, we focus on users’ preferences for GEs in nutrition apps. We contribute in three ways by analyzing how GEs might be implemented in ways that reflect users’ preferences and based on individual factors leading to personalized gamification systems (Research Stream 1, also see section “Theoretical Background”) in the domain of nutrition apps (Research Stream 2, also see section “Theoretical Background”).
Firstly, by combining both above-mentioned research streams, we were able to clearly rank GEs in nutrition apps (Top 5: goals, progress bar, coupons, points, and levels, Least 5: badge, leaderboard, social interaction, virtual goods, and avatar). Overall, the results indicate that users prefer cognitive, motivational sources, and extrinsic motivators but are less interested in social interaction and competition. In relation to the first research stream, we provide theoretical implications as to how GEs can be chosen to motivate a specific target group based on their characteristics and motivational structures.
Secondly, we identify that nutrition app users comprise two different target groups that differ in their personality traits, openness and self-perception. The main difference is seen in the high score of the element leaderboard and the low score of avatars for Cluster 2, a cluster consisting of open-minded users with relatively low levels of self-perception. Both observations echo prior research findings and could support existing assumptions.52,53 Though we find that users do not generally prefer competition as motivation to improve their diets, for open-minded users, it appears that, even in the context of food choices, GEs like leaderboards are preferred. This calls for further investigation of personalized gamification.
Thirdly, like prior research studies focusing on users’ preferences in the second identified research stream, we find evidence of differences in users’ preferences. This adds to the case for separate reflections on each GE. We show that, in general, users of nutrition apps prefer GEs that guide individual progress (i.e., goals and progress bar). This is similar to the results of a study by Schmidt-Kraepelin et al. undertaken in the context of physical activity. 26 On this basis, we can suggest that users enjoy competing against themselves, for example, in the form of goals. For both contexts (physical activity and healthy diet), it seems that users do not prefer to engage in social interaction. The fact that results are similar in the contexts of exercise and diet raises the possibility that similarities in preferred GEs may extend to the wider context of healthy behavior. This suggestion may also shed light on the different assessments of competition (i.e., leaderboard) in the related contexts of physical activity and healthy diet: arguably, leaderboards are more commonly associated with physical activity than with diet, which may be a more individual and private concern.
Practical implications
Our research provides several real-world implications for the use of GEs in nutrition apps. In this work, we investigated users’ preferences for specific GEs and analyzed whether these preferences differ in identified clusters based on socio-demographic characteristics and personality traits. Our results suggest that nutrition apps can be equipped with GEs that match preferences relating to different personality traits and, hence, reveal the importance of personality traits in enabling users to benefit from these apps. While individuals stand to benefit from a healthier diet and, hence, lower risks for serious illness, public health stands to benefit from long-term decreases in the economic cost of unhealthy eating. Health insurance companies, for example, stand to gain from our finding that, when developing a gamified nutrition app, it is important to focus on identifying and developing preferred GEs, such as goals, progress bars, coupons, and points. A targeted and well-considered selection of GEs should, thus, be given preference over, for example, superior app design. Insurance companies might consider entering into agreements with supermarket chains that could accept the GE coupons in the companies’ nutrition apps.
On the other hand, those GEs that are most often identified as the least favored by users should be avoided. These include social interaction, leaderboards, and avatars. That said, it is essential that those aiming to promote the long-term use and acceptance of nutrition apps consider contextual aspects and the needs of target groups, as different preferences may arise depending on the context. When it came to different preferences relating to the sociodemographic data of the target group, we found only minor differences, so this aspect should only be of minor concern.
Limitations and future research
Our study has limitations. Firstly, while we conducted a thorough literature search to identify a comprehensive set of GEs, ongoing digital progress may reveal additional elements that could influence user preferences. Future research in the realm of diet and food choices could explore these emerging GEs to understand their impact on user preferences.
Secondly, our quantitative empirical study relied on data from a single cross-sectional survey. Consequently, we were unable to assess the real-life, long-term effects of GEs on dietary behavior, limiting the robustness and generalizability of our findings. Future studies should consider generating additional data sets to enhance the reliability of results.
Thirdly, our study focused specifically on healthy diet contexts. However, as discussed in the “Theoretical Background” section, preferences for GEs are context-dependent and may not be generalizable across different applications. Therefore, we cannot guarantee stable results across various contexts. Future research could leverage our study as a methodological and theoretical foundation to explore similar questions in other health-related domains, such as medication adherence, blood glucose monitoring, smoking cessation, or stress management.
Lastly, our study provided only one design specification for the GEs based on leading literature in the field. While chosen to ensure meaningful engagement among participants, there are numerous other potential design specifications that warrant empirical investigation. We encourage fellow researchers to explore and verify additional design specifications that could enhance engagement with GEs.
Conclusion
The increasing number of overweight people puts strain on individual health, but also on the health care system. It also increases associated economic costs. The use of GEs in nutrition apps is a promising strategy through which we might positively influence dietary behavior. To date, we know little about how to best “gamify” nutrition apps to align them with users’ preferences and foster high usage through user satisfaction. Against this background, this work aimed to gain a greater understanding of users’ preferences for GEs in nutrition apps, which might, in turn, increase user satisfaction and encourage them to continue using the nutrition app. A BWS approach highlights top (e.g., goals, progress bar, and coupons) and flop GEs (e.g., social interaction, virtual goods, and avatars).
On top of this comprehensive overview, we conducted a cluster analysis to differentiate distinct preference clusters of nutrition app users and analyzed their socio-demographic characteristics and personality traits. Results point to three distinct clusters with varying GE preferences. Cluster 1 primarily consists of male users in their late thirties who have relatively high net incomes and a strong preference for routine, making them more resistant to change compared to other clusters. They mostly prefer GEs like coupons, points, and goals, while showing less interest in social interactions, avatars, and leaderboards. Cluster 2 primarily consists of female users in their mid-thirties who are characterized by a high level of openness. They prefer progress bars, leaderboards, and goals, but are less interested in badges, avatars, and virtual goals. Cluster 3 is characterized by slightly higher self-perception scores, indicating users with high levels of self-worth and self-acceptance, along with a preference for anonymity. They prefer progress bars, goals, and points, but are less interested in virtual goods, social interactions, and leaderboards. Regarding personality traits, preference differences appear to be linked to different degrees of openness to change and varying levels of self-perception. Our study contributes to research and practice by highlighting differences in the selection of GEs in gamified nutrition apps and provides insights into the influence of socio-demographic characteristics and personality traits on GE preferences.
Footnotes
Acknowledgements
The authors thoroughly acknowledge the general support and encouragement provided by Dr. Valerie Graf-Drasch.
Contributorship
All authors contributed equally to the various stages of manuscript preparation. They reviewed and edited the manuscript and approved the final version of the manuscript.
Declaration of conflicting interests
The authors declared no potential conflicts of interest with respect to the research, authorship, and/or publication of this article.
Ethical approval
Our study did not require an ethical board approval because it did not contain human or animal trials.
Funding
The authors received no financial support for the research, authorship, and/or publication of this article.
Guarantor
CJ
Research ethics and patient consent
According to HHS regulations for the protection of human subjects, the study does not fall under the category of human subject studies. The survey was anonymous, and informed consent was obtained from all those who agreed to complete the survey by clicking the corresponding button on the introductory page.
Appendix
result of structured literature reviews—gamification element selection.

| GE | Sources | |
|---|---|---|
| Avatar | Virtual pet |
109,110
|
| Virtual human |
111–115
|
|
| Player | ||
| Feedback | Progress bar |
20,83,113,116–122
|
| Scoreboard |
123,124
|
|
| Visual feedback |
109,113,125
|
|
| Goals (implemented as challenges) |
20,22,110,119,121,125–127
|
|
| Leaderboard |
19,20,22,83,111,120
|
|
| Levels |
77,110,115,117,118,122
|
|
| Rewards | Badges |
111,113,118,120
|
| Points |
19,22,77,109–111,113,116,118,121–123,127,128
|
|
| Virtual currency/items |
77,110,112,115,117,120,126,127
|
|
| Coupons |
77,110,116,123
|
|
| Social interaction | 19,20,22,83,111–113,119–121,124,128 | |
SSE, SSG, and Silhouette coefficient for different cluster solutions

| Number of clusters k | SSE | SSG | Silhouette coefficient |
|---|---|---|---|
| 2 | 18,708.91 | 3436.63 | 0.57 |
| 3 | 16,729,23 | 5414.18 | 0.54 |
| 4 | 15,399.74 | 6745.80 | 0.50 |
| 5 | 14,243.85 | 7901.69 | 0.47 |
| 6 | 13,404.64 | 8740.90 | 0.44 |
| 7 | 12,679.64 | 8740.90 | 0.41 |
Note: SSE = sum of square errors; SSG = sum of square errors between groups.
Appendix D. Results hierarchical clustering
Below are the results of cluster descriptions based on hierarchical clustering using Ward's minimum variance method and squared Euclidean distances with a cluster number of 3.
Comparison of Big Five dimensions and self-perception across clusters:
Results Kruskal–Wallis Test:
No significant differences between the clusters concerning self-perception (H = 2.242, p = .326)
Results Kruskal–Wallis Test:
No significant differences between the clusters concerning Big Five scores (H = 3.267, p = .267)