
Abstract
Background
Micro-randomized trials (MRTs) enhance the effects of mHealth by determining the optimal components, timings, and frequency of interventions. Appropriate handling of missing values is crucial in clinical research; however, it remains insufficiently explored in the context of MRTs. Our study aimed to investigate appropriate methods for missing data in simple MRTs with uniform intervention randomization and no time-dependent covariates. We focused on outcome missing data depending on the participants’ background factors.
Methods
We evaluated the performance of the available data analysis (AD) and the multiple imputation in generalized estimating equations (GEE) and random effects model (RE) through simulations. The scenarios were examined based on the presence of unmeasured background factors and the presence of interaction effects. We conducted the regression and propensity score methods as multiple imputation. These missing data handling methods were also applied to actual MRT data.
Results
Without the interaction effect, AD was biased for GEE, but there was almost no bias for RE. With the interaction effect, estimates were biased for both. For multiple imputation, regression methods estimated without bias when the imputation models were correct, but bias occurred when the models were incorrect. However, this bias was reduced by including the random effects in the imputation model. In the propensity score method, bias occurred even when the missing probability model was correct.
Conclusions
Without the interaction effect, AD of RE was preferable. When employing GEE or anticipating interactions, we recommend the multiple imputation, especially with regression methods, including individual-level random effects.
Introduction
The widespread adoption of smartphones and other mobile devices has driven considerable attention towards mobile health for diagnosis, treatment, and prevention of diseases. As of 2018, over 300,000 health-related applications have been developed,1,2 typically based on the best possible behavior change theory. However, with few exceptions, it remains challenging to determine the optimal timings and frequency of interventions based on these theories.3,4 Micro-randomized trials (MRTs) have been introduced as a trial design to optimize apps by obtaining required knowledge through clinical studies. 4 MRTs usually span several weeks, up to a few months, with participants randomized numerous times at pre-determined time points. In MRTs, the assignment of the interventions could be changed depending on previous outcomes and time-dependent covariates. Time-dependent covariates would also be considered when evaluating the intervention effects.4,5 Although study design incorporating time-dependent covariates and previous outcomes is the strength of MRT, some trials have been more simply designed and analyzed.6–10 Trials where time-dependent covariates or previous outcomes are used only to increase statistical power in the analysis 11 can be considered simple MRTs.
Missing data are a frequent issue in clinical studies of health-related apps. The systematic review of apps for chronic diseases reported that approximately 40% of data were missing, on average. 12 The missing data are often classified as missing completely at random (MCAR), missing at random (MAR), and missing not at random (MNAR), with these classifications varying across.13–17 For our purposes, we adopted the definitions used in the paper by Curnow et al. 17 We simplified their definition and applied them to our study. MAR was defined as the case in which missingness depends on only observed variables; MNAR was defined as the case in which missingness depends on unobserved variables. Although research on the causes of missing data in clinical studies of apps is limited, the associated factors are considered to be diverse, including age, educational history, occupation, health literacy, and personality characteristics. 12 These factors are numerous, and some are difficult to measure; thus, measuring all factors associated with missing data is typically challenging. In addition, variables such as personality characteristics are associated with lifestyles, like the number of walking steps.18–20 Therefore, unmeasured background factors may introduce non-negligible bias into the estimates (Figure 1).

Directed acyclic graph illustrating non-negligible bias generation mechanisms due to unmeasured background factors.
To the best of our knowledge, appropriate methods for handling missing data in MRTs have not yet been adequately evaluated. We focused on a simple MRT in which interventions were randomized in the same probability for all participants and without considering time-dependent covariates in the analysis. As a first step in considering missing data in MRT, our study aimed to investigate the proper methods for handling missing data in MRTs when missingness depends on background factors. We performed two generally preferred methods, the available data analysis and the multiple imputation. 16 Sixteen scenarios were considered, based on presence of the interaction effect between the background factor and the intervention, presence of unmeasured background factors, types of background factors (continuous or categorical), and influence of covariates on probabilities of the missing (large or small). Following the simulation study, we applied missing data handling methods to the MRT of the assistant to lift your level of activity (Ally), an exercise promotion app for healthy adults. 8
Methods
In repeated measures studies, generalized estimating equations (GEE) and the random effects model (RE) are often used for estimating the intervention effects. 21 GEE and RE were not valid for MRTs with time-dependent covariates,5,22 but we used GEE and RE in our analysis since we assumed a situation in which such time-dependent variables were not present. For the handling of missing measurements, we performed the available data analysis and the multiple imputation.
Generalized estimating equations 21
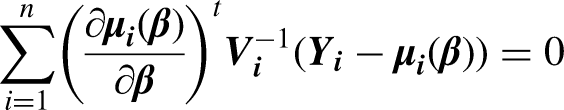
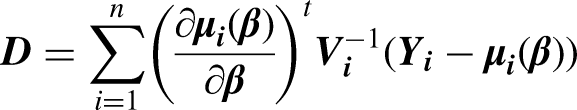
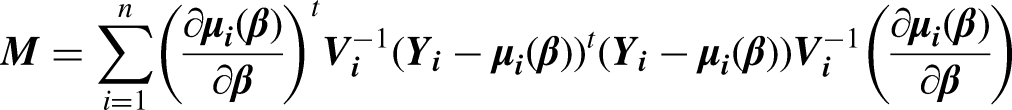
GEE is a multivariate analysis method for clustered data, for instance, where subjects are measured at many time points. We estimate the intervention's or other variables’ effect (

Random effects model 21
RE is also a multivariate analysis method for clustered data. However, unlike GEE, the effect is estimated by maximum likelihood estimation. We describe the linear model that we performed in this study. Outcomes are modeled as follows:

Available data analysis
A simple approach to address missing data in these analyses is to remove missing data and analyze only the observed data. This method is known as the available data analysis. In general, non-negligible bias occurs in the available data analysis when unmeasured covariates affect missingness and outcomes. 23 In this study, we performed the available data analysis on GEE or RE and compared the results with the case of the multiple imputation.
Multiple imputation
The multiple imputation is a statistical approach for addressing missing data by repeatedly imputing missing values. The multiple imputation consists of three steps. The first step is to create m sets of pseudo-complete datasets by imputing repeatedly missing values based on the imputation models. The second step is to estimate the parameters


Regression method 26
In the regression method, a regression analysis with the imputed variable as the explained variable is performed using the observed data. The model
Propensity score method 27
A propensity score is the probability of missing data and is estimated by the logistic regression or other methods using observed data. Let

Research ethics and patient consent
This research was a simulation study; no data were obtained from new patients. In the application section, we used the data in the Ally Micro-Randomized Trial. All individual participants enrolled in the study provided informed consent. 8 The anonymized dataset was available online, and we used the data after obtaining the permission from the authors.
Simulation study
Data generation
We assumed an MRT with 100 participants, 30 time points, continuous outcomes, and three background factors. The simulation of the assumed MRT was repeated 1000 times. Let
For the background factors, two cases were considered: (a) the factors followed the standard normal distribution, and (b) the factors took the value of either 1 or −1 with a probability of 0.5 independently. The outcomes were calculated using the following equation:


Simulation statistical analysis
The generated datasets were analyzed by GEE and RE with individual-level intercept. Covariates were not adjusted in either analysis. We specify independence for the correlation structure of GEE and used the Kenward–Roger method to estimate the degrees of freedom in RE. We compared the following methods for handling missing data. Multiple imputations were performed within each subset of time points (we called this “by time point”), and multiple imputations were performed on pooled data without distinguishing time points (we called this “disregarding time points”). In the “by time point” method, imputation was performed 30 times on the dataset containing 100 participants, and in the “disregarding time points” method, imputation was performed once on the dataset containing 100*30 values. As a reference, we also analyzed the dataset before generating the missing data (Full).
Available data analysis (AD). If Regression method with Regression method with Propensity score method with Propensity score method with If we hypothetically assume that only Regression method with Regression method with Regression method with Propensity score method with Propensity score method with
In all multiple imputation, we generated 100 pseudo-datasets and combined the results. We obtained the final results by averaging the point estimates and standard errors of 1000 simulations.
Simulation results
A consistent pattern was observed in all scenarios, irrespective of whether the covariates were continuous or categorical. Therefore, we present the results without distinguishing between different distributions of the covariates. The results were summarized in four sections based on presence of the interaction effect between the intervention and the background factor, and whether we accounted for all covariates or only one covariate (MAR or MNAR).
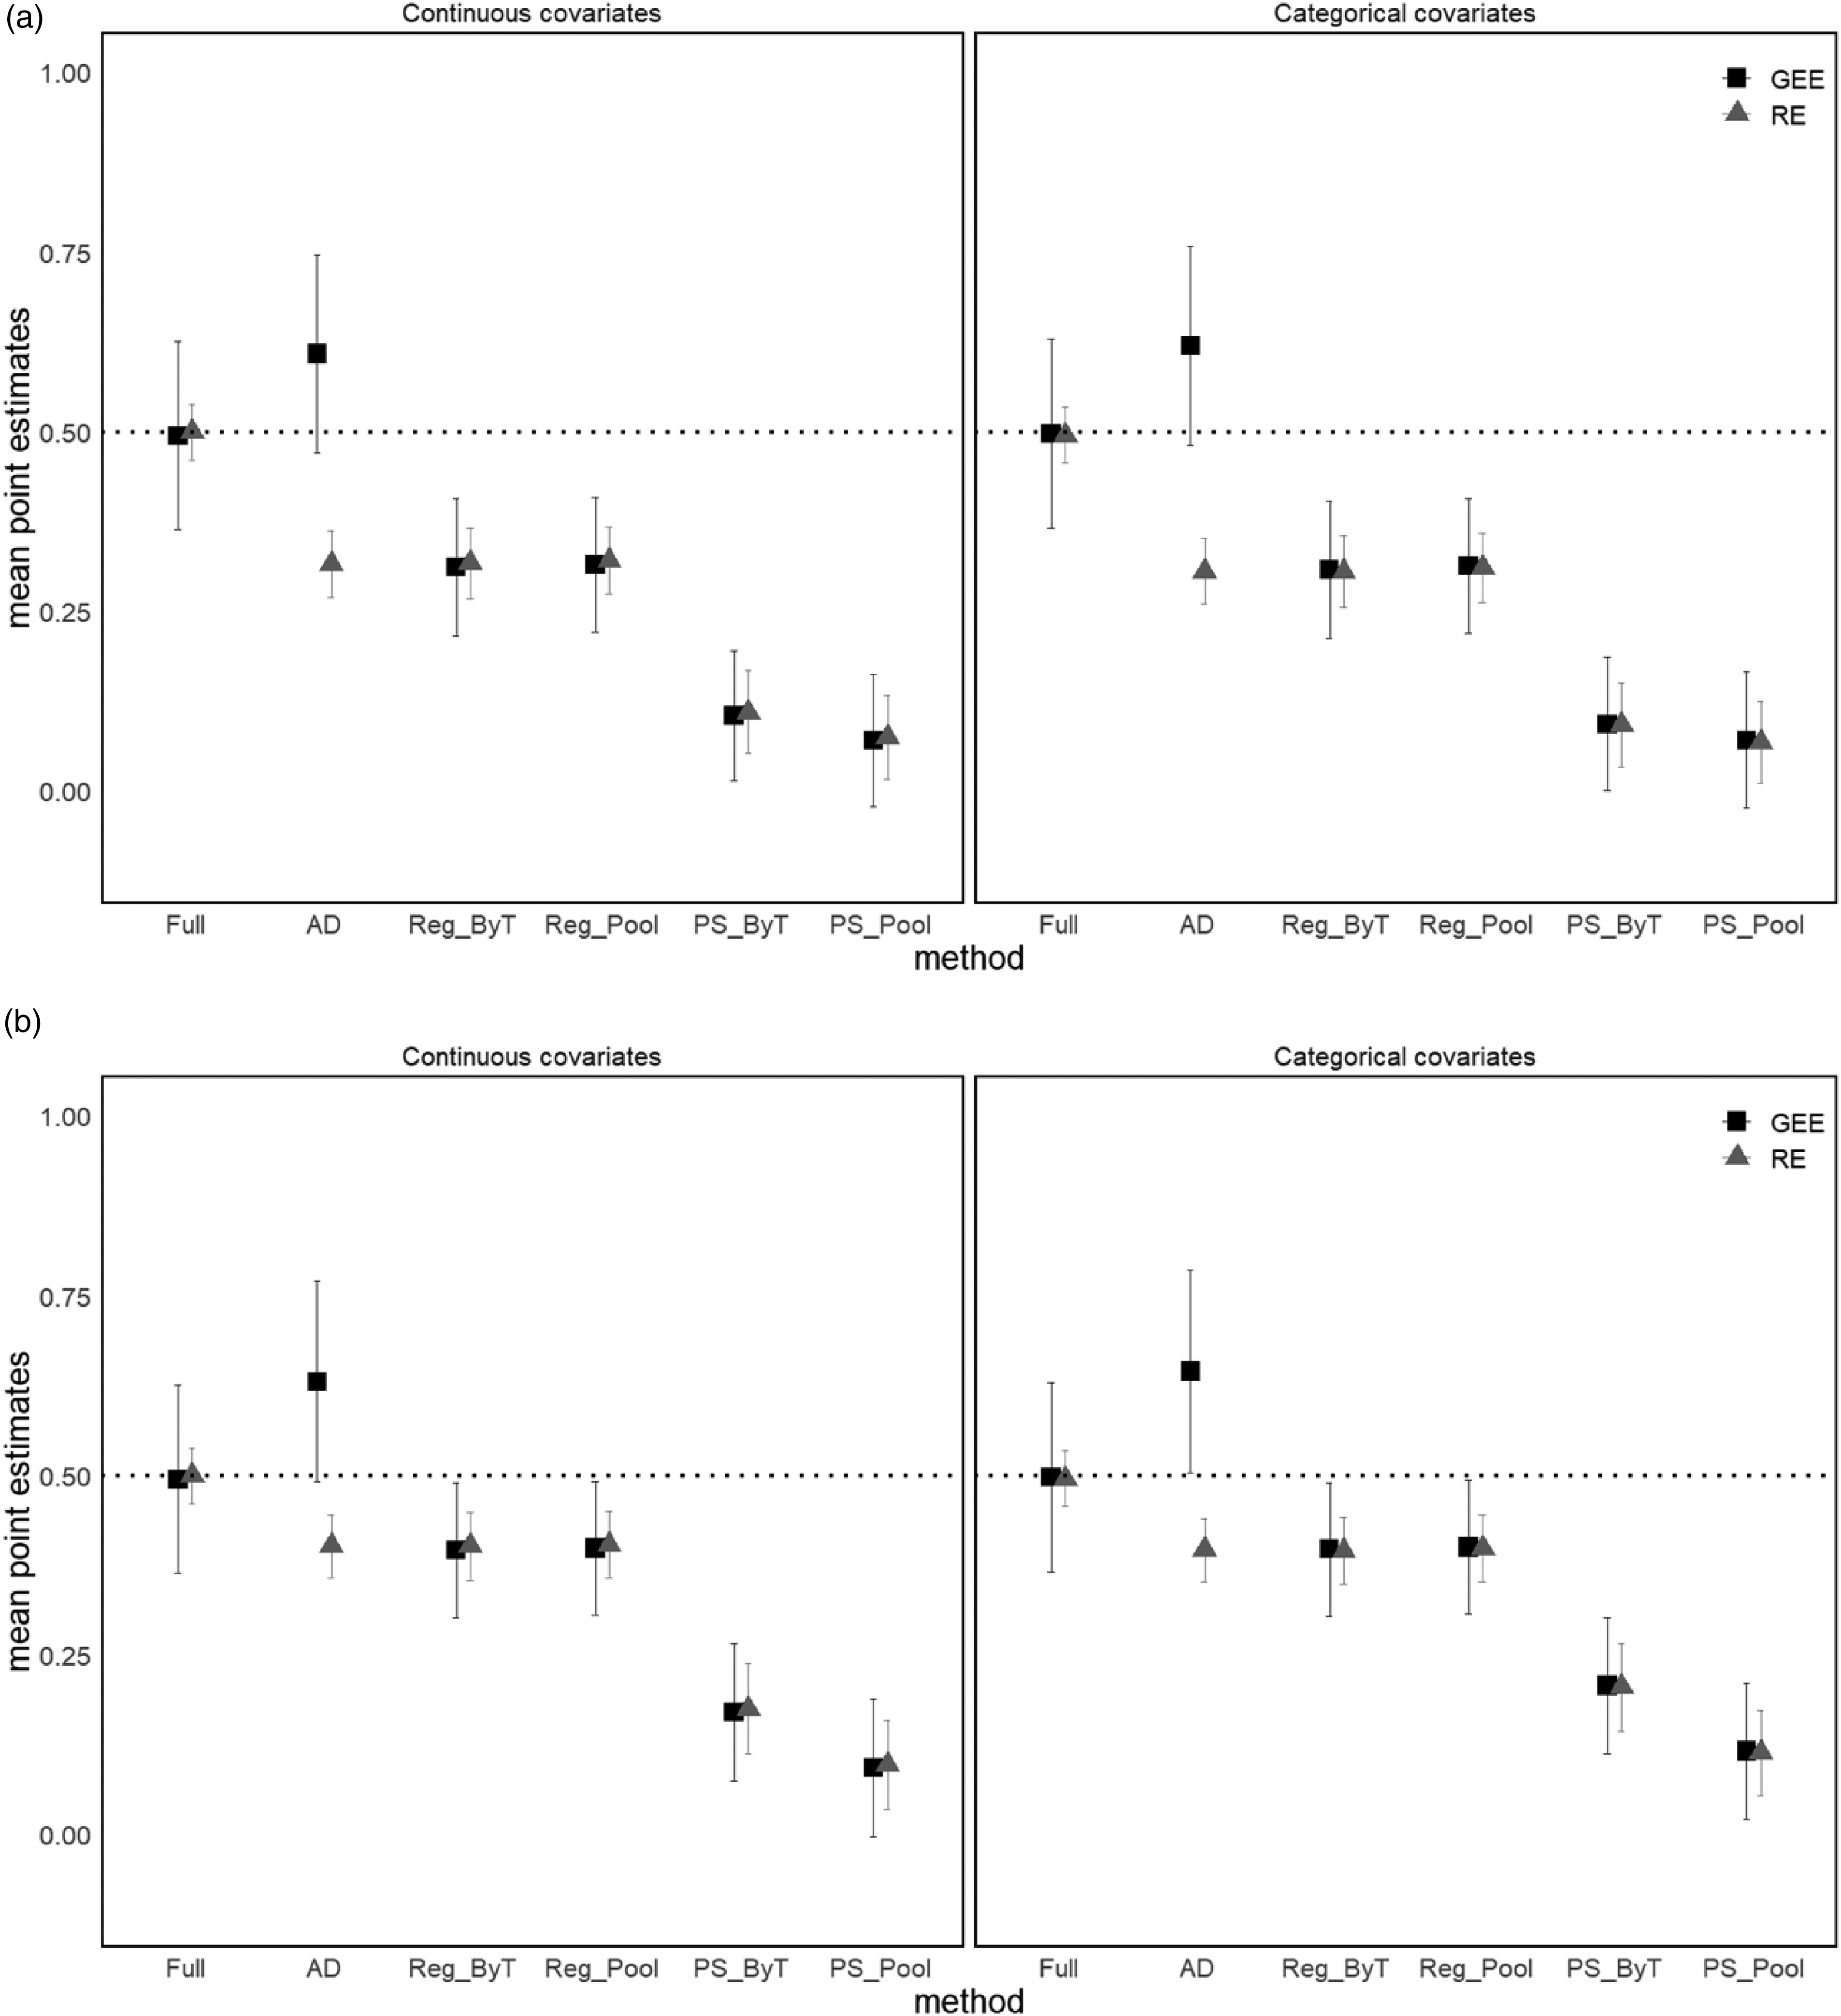
Under MAR and without interaction
In the available data analysis, the GEE estimations were biased, but this bias was minimal in the RE estimates (Figure 2(a) and (b)). In the regression methods with

Simulation results of mean point estimates ± average standard errors when all covariates were accounted for, there was no interaction, and the effects of covariates on missingness were (a) large and (b) small.
Under MNAR and without interaction
In the regression methods with A and

Simulation results of mean point estimates ± average standard errors when only one covariate was accounted for, there was no interaction, and the effects of covariates on missingness were (a) large and (b) small. Values in parentheses are average standard errors.
Under MAR and with interaction
In the available data analysis, both the estimations of GEE and RE were biased (Figure 4(a) and (b)). The regression methods with
Simulation results of mean point estimates ± average standard errors when all covariates were accounted for, there was the interaction, and the effects of covariates on missingness were (a) large and (b) small.
Under MNAR and with interaction
In the regression methods with A and

Simulation results of mean point estimates ± average standard errors when only one covariate was accounted for, there was the interaction, and the effects of covariates on missingness were (a) large and (b) small.
Standard errors
The results regarding standard errors were presented below, without distinguishing between different mechanisms of missing data, presence of interactions, and degrees of impact of covariates on missingness. In all analyses, standard errors of the RE were smaller than those of GEE. The multiple imputations in GEE outperformed the available data analysis in terms of accuracy, but the multiple imputation in RE had worse accuracy.
Application study
The ally micro-randomized trial (the ally trial)
We compared the available data analysis and the multiple imputation by applying them to the Ally MRT data. The MRT of the Ally, an app that promotes physical activities in adults, was conducted in Switzerland between October and December in 2017 with 274 health insurance participants. The results of this trial were published, and the anonymized dataset was available online (cited 2023 Apr 13).
8
The purpose of the trial was to evaluate the effects and interactions between the three interventions.
Incentive conditions (cash, charity, or no incentives) Weekly plannings (action planning, coping planning, or no planning) Daily self-monitoring prompt (receiving or not)
Interaction effects between incentives and self-monitoring prompts (SMPs) and interaction effects between incentives and weekly plannings were postulated when the study was designed.
29
Each intervention was randomized at different times. The SMPs were randomly assigned every day except Sunday, which was micro-randomized. The primary endpoint was achievement of the target number of steps per day, whereas the secondary endpoint was the number of steps taken. The expected number of steps was 11508, calculated as 274 participants for 42 days. However, 34.4% (3957/11508) of the records were missing. The published paper reported that only incentives were effective.
8
Application statistical analysis
We estimated the step ratios and 95% confidence intervals (CIs) for the three interventions, the interactions between incentives and plannings, and the interactions between incentives and SMPs. The log-transformed numbers of steps were analyzed as the outcomes using GEE and RE. We specified independence for the correlation structure of GEE and used the Kenward–Roger method to estimate the degrees of freedom in RE. In RE, to account for the nesting of interventions (split-split-plot design), we specified the interactions between participants and incentives, and the interactions between participants, incentives, weeks, and plannings as random effects.
The available dataset included age, gender, employment status, smartphone operating system, and the number of steps taken during the baseline period as background factors. The number of steps taken was imputed from these background factors and interventions at each time point. Because there were missing background factors, we imputed the background factors with multiple imputation by chained equations (MICE)
30
among background factors and then imputed the missing step counts. In MICE, categorical variables were imputed with the logistic regression, and continuous variables were imputed with the predictive mean matching.31,32 We compared the following methods for handling missing step counts.
Available data analysis. Regression method with interventions and background factors by time points. Regression method with interventions and background factors, disregarding time points. Regression method with interventions, background factors and the individual-level random effect as the intercept. Propensity score method with interventions and background factors by time points. Propensity score method with interventions and background factors, disregarding time points.
In all multiple imputation, we generated 100 pseudo-datasets and combined the results. SAS 9.4 was used for all statistical analyses.
Application results
The estimates of the step ratio for the SMPs, which were micro-randomized in the study, remained consistent among different methods for handling missing data (Table 1). Other estimates did not also change considerably (Table 2, Table 3).
Estimates and 95% CI of the step ratios of self-monitoring prompts for the Ally trial.

CI, confidence interval; Ally, assistant to lift your level of activity; SMP, self-monitoring prompt; GEE, generalized estimating equations; RE, random effects model.
Estimates and 95%CI of the step ratio for the Ally trial by GEE.

CI, confidence interval; Ally, assistant to lift your level of activity; GEE, generalized estimating equations; AP, action planning; CP, coping planning, SMP, self-monitoring prompt
Regression method with interventions and backgrounds by time point.
Regression method with interventions and backgrounds, disregarding time points.
Regression method with interventions, backgrounds and the individual-level random effects as intercept.
Propensity score method with interventions and backgrounds by time point.
Propensity score method with interventions and backgrounds, disregarding time points.
Estimates and 95%CI of the step ratio for the Ally trial by the random effects model.

CI, confidence interval; Ally, assistant to lift your level of activity; AP, action planning; CP, coping planning, SMP, self-monitoring prompt.
Regression method with interventions and backgrounds by time point.
Regression method with interventions and backgrounds, disregarding time points.
Regression method with interventions, backgrounds and the individual-level random effects as intercept.
Propensity score method with interventions and backgrounds by time point.
Propensity score method with interventions and backgrounds, disregarding time points.
Except for incentive interventions, the point estimates of the step ratios ranged from 0.9 to 1.1, and the 95% CIs included 1.0. The point estimate of the step ratio for the incentive intervention was approximately 1.1. In some multiple imputation, the lower limits of the 95% CIs exceeded 1.0. GEE resulted in narrower CIs for the incentive interventions and wider CIs for the SMPs compared to RE.
Discussion
Principal findings
We evaluated the performance of the available data analysis and the multiple imputation in MRTs in which interventions were uniformly randomized for all participants through the trial and without considering time-dependent covariates in the analysis. We considered 16 MRT scenarios in simulation based on the presence of the interaction effect between the background factor and the intervention, the presence of unmeasured background factors, the distributions of background factors, and the influence of covariates on the missing probabilities. The three main findings were as follows: first, the available data analysis could be an option for handling missing data; second, including random effects in the regression methods reduced bias; and third, the propensity score method performed poorly, even when the mechanism of missing data was MAR.
Our first main finding was that there were some scenarios in which the available data analysis performed better than the multiple imputation. In general, bias in the available data analysis can occur because of unmeasured factors influencing both missing data and outcomes. 23 In our study, bias was observed in GEE. However, when using RE for the available data analysis in scenarios without the interaction effect, the bias was minimal. In the presence of time-dependent covariates, RE is not considered valid, and methods based on estimating equations have been proposed.5,22,33 However, within the MRTs we focused on, our results suggested that RE may be better than GEE. These results are consistent with the statements in Little 14 : “If the data are MAR, likelihood inference based on the random effects model is equivalent to inference based on the full likelihood considering missing-data mechanism. In contrast, GEE generally requires a stronger assumption to yield a consistent estimator”. Nonetheless, these results do not necessarily imply that the available data analysis by RE is superior to other methods. In our study, bias was evident in scenarios with an interaction between the covariate and the intervention, similar to observations in GEE. This could be because the random effects partially reflected the effects of the unobserved covariates in the patterns without the interaction, and the random effects corresponding to the interaction were not included in the patterns with the interaction.
Our second key finding was that including random effects in the regression model of the multiple imputation could help reduce bias. As expected, the multiple imputation with the regression model performed well only in scenarios where we accounted for all covariates and without the interaction, whereas bias was observed in scenarios where we accounted for only one covariate or with interaction effects. However, the bias was reduced by including individual-level random effects as intercepts in the imputation models with only one covariate. The results indicate that including individual-level random effects could reduce the influence of unmeasured background factors.
Our final key finding was that the propensity score method could introduce bias, even in situations where the missing probability model was correct. The propensity score method does not consider the association between the variables used to estimate the probabilities of missing data and the outcome variable. When the intervention affects the outcome variable but not the missingness, the intervention effect is underestimated because the associations between the outcome variable and the interventions are not correctly reflected in the imputations. 34 In the simulations, the impact of background factors on missing data was greater than that of the intervention, and the effect of the intervention on the outcome may have been underestimated due to the relatively small impact of the intervention on missingness. When imputations were performed at each time point, the observed subjects in the subgroups stratified by missing probabilities were absent and could not be completed. In MRTs with a small number of participants, estimates may not be obtained if missing data are handled using the propensity score method at each time point.
In our study, multiple imputation had shown better efficiency when we used GEE but not when we used RE. This comparison conclusions of efficiency in RE align with previous studies.35–37
Based on the findings of this study, it is challenging to determine the best method of handling missing data in MRTs. However, we can propose several recommendations. The available data analysis of the RE might perform others when interaction effects are not considered. Nonetheless, this assumption may not hold true in the context of MRTs. Within the scope of our study, we found that multiple imputation by regression methods, including individual-level random effects, yielded better results under such conditions.
Limitations and future research
This study had some limitations. First, it assumed that background factors and the intervention determined the presence of missingness. In the Ally trial, since the number of steps was measured automatically, the association between missingness and previous outcomes was expected to be weak. However, in other MRTs, there may be a strong association between missingness and previous outcomes. Therefore, it is necessary to research cases in which missingness depends on the previous outcomes in the future. In MRTs with non-monotonic missing data, multiple imputation conditioned on variables of all time points is unrealistic owing to overfitting and problems with the number of parameters. One possible approach would be to apply a two-fold FCS 38 that performs multiple imputation for separate time points.
Second, time-varying covariates were not considered in this study. The time-varying variables analyzed in the Ally trial were the interventions and the outcome, and only the outcome could be missing. However, time-dependent covariates are collectible using wearable devices to optimize interventions.4,39 The analysis of such app studies should consider coping with time-varying covariates; hence, this is an important topic to investigate in the future. In MRTs where time-dependent covariates are used for only statistical power, sensitivity analysis should be performed using missing handling methods without including time-varying covariates in the analysis.
Third, this study examined the performance of the multiple imputation in situations where the outcome was a continuous variable but not in situations where the outcome was a categorical variable.
Fourth, we compared the performance of traditional multiple imputation methods. Multiple imputation using machine learning and other methods have been developed,40–42 and these methods can potentially implement multiple imputation methods with fewer assumptions. The evaluation of applying these methods to the missing data in MRTs is one of the important future works.
Application discussion
In the Ally trial, the expected number of records was 11508, calculated as 274 participants for 42 days, but 34.4% (3957/11508) of records of daily steps were missing. Although many values were missing, the results were similar between the approaches. It was suggested that the study might receive little influence owing to missing data. We found no significant intervention effects in the available data analysis. The paper reporting the results of the Ally trial 8 also found no significant effect when the number of steps was analyzed as a continuous quantity, and the results in this study were considered consistent.
GEE tended to obtain narrower CIs for incentives and wider CIs for SMPs than RE. This result appropriately reflects the study design of split-split plot design. RE that appropriately reflects the study design should be selected.
Conclusion
We compared the performance of multiple imputation and the available data analysis in simple MRTs, where missing data depend on the intervention and background factors. The available data analysis of the random-effects model performed better if there was no interaction between the intervention and the background factor. However, we recommend using the multiple imputation when performing GEE or when interactions are assumed. In addition, the imputation model in regression methods should include individual-level random effects. When using propensity score methods, it is advisable to exclude variables with minimal influence on the outcome.
Footnotes
Abbreviations
Acknowledgements
The authors acknowledge the contributions of the researchers who conducted the MRT of Ally and provided data to the public.
Contributors
MK and KO were involved in research planning, data analysis, and writing the manuscript. All authors reviewed and edited the manuscript and approved the final version of the manuscript.
Declaration of conflicting interests
The authors declared no potential conflicts of interest with respect to the research, authorship, and/or publication of this article.
Ethical approval
Not applicable.
Funding
The authors disclosed receipt of the following financial support for the research, authorship, and/or publication of this article: This research was supported by AMED under Grant Number JP21lk0201701 and the National Cancer Center Research and Development Fund (2021-A-12 to H.B.).
Guarantor
KO