
Abstract
Background
Although patient accessible electronic health records (PAEHRs) offer great potential in enhancing the provision of patient-centered care and improving satisfaction, the adoption rate is still low. Currently, few studies are there for researchers and health organization leaders to understand patients’ thoughts and related factors of PAEHRs adoption in developing countries. China adopted more limited practices of PAEHRs, among which we selected Yuebei People's Hospital as an example.
Objective
The study aimed to research patient attitudes toward PAEHRs use and the associated factors of patients’ adoption of PAEHRs in China, which is achieved by both qualitative and quantitative studies.
Methods
This study employed sequential mixed-methods. The DeLone & McLean information systems (D&M IS) success model, Unified Theory of Acceptance and Use of Technology (UTAUT) and task-technology fit (TTF) model were used to guide the research. Finally, we collected 28 valid in-depth interview responses, 51 valid semi-structured interview responses and 235 valid questionnaire responses. The research model was tested and validated using data collected.
Results
The findings of the qualitative study reveal that patients’ rate perceived task productivity and customer satisfaction as benefits, and poor-quality information as flaws. Results of the quantitative study show that the drivers of behavioral intention are performance expectance, effort expectancy and social influence; the predictors of use behavior are TTF and behavioral intention.
Conclusion
It is necessary to consider PAEHRs’ task-tool role in patients’ adoption behavior. Hospitalized patients value PAEHRs’ practical attributes and attach much importance to the information content and application design.
Keywords
Introduction
Patient accessible electronic health records (PAEHRs) refer to e-services providing patients with web-based access to the data that is stored in the institutional-based electronic health records (EHRs) with the possibility to continuously, rather than upon request, view, sometimes edit or comment, or download it and integrate it into any type of patient-held record.1–3 PAEHRs offer great potential in health care in terms of empowering patients, 1 improving adherence to medications, 4 improving the relationship between patient and clinician, 1 and improving quality and safety of care.1,2,4 A number of developed countries have implemented PAEHRs services in parts or across the entire nation, for example, Australia,5,6 Finland, 7 Denmark, 8 Estonia, 9 Sweden,10,11 Norway, 12 France, 13 the Netherlands, 14 New Zealand, 15 United States, 16 England, 17 Austria, 18 Estonia, 19 Singapore,20,21 to name a few.
However, the adoption rates of PAEHRs have failed to meet expectations.22,23 “In Europe, the adoption rates of patient access to summary records through national systems in the United Kingdom and France have been low at 0.5% and 1.5%, respectively. However, in Sweden, 38% of the population had adopted access to the medical records in primary and specialist care in 2017.” 22 Based on existing literature, the adoption of PAEHRs is associated with patient ethnic and socioeconomic characteristics, and variations in access to the internet.2,24–26 Nevertheless, empirical research on patient perceptions of PAEHRs (such as social influence, privacy concerns and facilitating conditions) obtains inconsistent findings.2,27–30 Moreover, those findings often stem from research carried out in developed countries, and the focal points lay in examining PAEHRs or inpatient portals loaded on websites or hospital-owned-tablets, rather than apps designed to be installed on patients’ own devices or smartphones. 25 Researchers have demonstrated the distinct adoption intention, usage and outcomes of mHealth and eHealth, which represent web-based computer-tailored apps/websites and smartphone-based apps separately.31–33
In China, complete EHRs, which include doctor's notes and diagnoses, usually refer to inpatients’ health records. Although more than 90% of hospitals in China have adopted EHRs, 34 patients generally do not use EHRs systems for either accessing information, scheduling appointments, sending secure messages, refilling prescriptions, or accessing doctors’ notes. 35 On the other hand, the proportion of mobile Internet users exceeds half of China's total population. 36 The desire to extend EHRs access services and the high percentage of mobile phone usage make China a potential country for large-scale implementation of PAEHRs. Currently, there is no research for researchers and health organization leaders to understand patients’ thoughts and related factors of PAEHRs adoption in developing countries.
Among these competitive theories and models (e.g. UTAUT and TTF) targeted at factors influencing users’ adoption and usage in IS areas, it is difficult to decide which models should be selected to precisely interpret the mechanism. We performed a mixed methods study to determine both patient attitudes toward PAEHRs use as well as associated factors of patient adoption of PAEHRs in China. 37
Qualitative study analysis
As PAEHRs research (especially inpatient portals) is in its infancy, 25 an exploratory study is indispensable to provide context and time generalizations to our hypothesis development. We used in-depth interviews and semi-structured interviews to solicit inpatient users’ thoughts toward PAEHRs regarding the perceived benefits and obstacles, as well as attributes they valued when deciding to use the app.
The D&M IS Success Model (Figure 1) was used as the basis to guide the interview questions and analyze the content. The reason that we chose the model was chiefly the multi-perspective feature of the model, 38 namely, the model contains comprehensive factors relating to user adoption of information technology. 39 Compared with related theories, the D&M IS Success Model contains a broader range of factors from a wider perspective, which is a prerequisite for more exploratory research. 40 According to the D&M IS model, 39 user adoption of information systems depends upon six factors: (1) system quality; (2) information quality; (3) service quality; (4) system use; (5) user satisfaction; (6) individual impact and organizational impact.

Updated D&M IS success model. 39
Study site
This study was conducted in Yuebei People's Hospital, a Chinese tertiary hospital setting with 3000 inpatient beds. In 2016, Yuebei People's Hospital initiated a program called EHRs Openness, which provided inpatients with access to all sections of EHRs, including physicians’ notes, radiology results, operative reports, and billing information. 41 Patients who want to access their EHRs can obtain an authorization code from a nurse to login into an application which can be installed on their smartphone. Caregivers, such as family members who are authorized by the patients, can also access the EHR. The study site for both qualitative and quantitative studies in this paper is Yuebei People's Hospital.
Study instruments for qualitative study
To understand the benefits and barriers to technologies for improving patient access to health information, we applied the D&M IS Success Model 39 to guide the study. This qualitative study employed in-depth interviews and semi-structured interviews. The instruments were created by members of the research team, and then tested by a pilot sample of inpatients prior to conducting the full study. The in-depth interview comprised open-ended questions regarding individuals’ attitudes toward the technology of PAEHR. Specific questions concerned: (1) perceived benefits in hospitalization from PAEHR application use; (2) perceived benefits and barriers to PAEHR application use; (3) patient experience of PAEHR. The semi-structured interview was targeted at identifying the features of the PAEHR which patients value: (1) system quality: usability, ease of use and response time (e.g. download time, data update time); (2) information quality: easy to understand, data security; (3) service quality: responsiveness; (4) user satisfaction: patients’ opinions of PAEHR covering the entire customer experience cycle from application introduction through application download, record browsing, record consultant, and service.
Participants for qualitative study
Participants were selected from individuals admitted to Yuebei People's Hospital between October 2018 and November 2018, using a convenience sampling method. Patients who were PAEHR application users were the main respondents. Patients who did not use the applications would be asked questions about the reasons why they chose not to use the application. Participants unable to complete interviews (e.g. due to severe cognitive dysfunction limiting responses to questions or emotionally unstable patients) were excluded. Because the users were inpatients, most of whom suffered from relatively serious conditions, we selected different patients to conduct an in-depth interview and semi-structured interview to reduce the time patients spent responding to the research. Firstly, each participant was asked to complete an in-depth interview, conducted according to our interview guide. Then, a second cohort of patients was asked to complete a semi-structured interview. We obtained 28 valid in-depth interview responses and 51 valid semi-structured interview responses.
Process of qualitative study analysis
In-depth interview data were analyzed using a thematic analysis approach adapted from the procedure outlined by Braun et al. 40 According to the original outline guide, there are six phases of analysis, which would generate bottom-up themes. However, the sole direction analysis may arouse coding confusion. We thereby took the D&M IS Success Model 39 as the guiding framework and the variables as the initial codebook (list of terms). Two members of the research team (JL, JRL) reviewed 8 interview transcripts to identify themes, and associate themes to the component(s) of the D&M IS Success Model with which they most closely corresponded and update the codebook. Once we had an initial set of concepts, we condensed them into summative themes, and then modified the codebook to associate themes to the component(s) of the D&M IS Success Model with which they most closely corresponded. All the themes generated from the 8 interviews corresponded to a D&M IS Success Model component. Then JL and JRL independently coded the remaining 20 interviews. The codebook was applied for thematic analysis using Microsoft Excel for interview responses. In this paper, we achieved high interrater reliability (kappa = .76). Throughout the coding stage, to ensure consistency in categorizing the issue of complaints, three researchers (JL, JRL, and JDM) discussed eliminating divergence. For the fixed-choice items (part of the semi-structured interview), we calculated descriptive statistics using Microsoft Excel which were reported as frequencies and percentages for categorical variables. Free text information following the fixed-choice items was summarized to inform understanding of patients’ thoughts.
Results of qualitative study analysis
Our participants’ characteristics for the qualitative study are shown in Table 1.
Demographic characteristics of study respondents.

In-depth interview results: emerging themes
The qualitative analysis of in-depth interview transcripts identified respondents’ perspectives on the perceived benefits of PAEHRs application to support hospitalization care, barriers to application use or application adoption. The first layer of theme classification consists of task productivity, customer satisfaction, poor quality information and external limitations to usage, among which the first two themes belong to the benefits category and the last two themes belong to the barriers category.
Task productivity. There are two sub-themes under the code task productivity. The first is information. The information includes information about results, surgery, orders, costs or treatment progress. Here are some examples from respondents. “If the application is not available, I have to ask the doctors or nurses about the test results. You know, the nurse will give us test results (paper version), however, it's not timely as the e-version. I mean, once the test results are released, I can check it directly on the app” (patient number P5); “during the doctor's rounds in the morning, the communication usually lasts a short time. Sometimes I can’t remember what the doctor said. Since I used the app, I can read doctor's notes during the rounds. Besides, I knew for the first time that the doctors have so much work to do, I mean, they note so much information…” (patient number P6); “I work in Guangzhou, and the time I can spend to accompany my father is limited. Because my parents are both elderly, the doctor has to inform me about some results, you know, call me or text me via Wechat (equivalent to WhatsApp). Now I can directly check the results in Guangzhou on the app” (patient number P8).
The second sub-theme of task productivity is known as an increased understanding of the condition. This category provides the health records, especially the notes provide patients with information on treatment logic. One example is that “I am not a doctor. When I saw some abnormal results, I don’t know the reason and neither the outcomes it may bring. I am interested in the part about physician notes. If I read through them, sometimes I can figure it out” (patient number P26).
Customer satisfaction. The definition of customer satisfaction is that the information shared in the PAEHR application helps to meet the inpatients’ (or others involved in a user's care, like caregivers) needs and improves customer satisfaction. Examples are: “due to the benefits of improving transparency of care delivery, the application is much helpful to improve the relationship and make patients like me more satisfied” (patient number P20); “I am pretty satisfied with the hospital. I haven’t heard that there are any other hospitals which released this kind of application” (patient number P3).
Poor quality information. There are three sub-themes under the code poor quality information. Firstly, advanced-level content means that EHRs are provided at an advanced reading level or with professional jargon that is not understandable for a user. Here is one quote from respondent patient P13. “I feel that the records I see are actually the records clinicians wrote, I mean, the same version. So it is difficult for me to understand the meaning such as health care jargons.”
Secondly, another theme under poor quality information is information overload, which is defined as the amount of information conveyed to users from the application that is redundant or unnecessary. One quote is that “the doctor lets me access the whole record which I really appreciate. However, there are so much information, so many parts of the records. You know, I gave birth to a baby. I am suffering from fatigue and the surgical incision still hurts. It’s impossible for me to thoroughly read the records” (patient number P27).
The sub-theme poor organization means the material design of the layout and display of the output contents is poor or doesn’t fit the user's needs or preferences. Patient number 19 said that “the record is a bit hard to follow. You see, the page is like an image, even the headlines are not clear…However, you should improve the design of the record appearance.”
External limitations to the usage
Being busy or stressed, inaccessible application and patient–clinician conflict are three sub-themes of external limitations to usage. Two examples of code being busy or stressed are that “I installed the app. But I seldom use it. It's time costly. I am really busy, so I hired someone to take care of my dad. When it's necessary, the doctor will call me and I will ask the doctor directly” (patient number P25); (and) “I came to the hospital once a month. I prefer to discuss the treatment for the cancer face to face with the clinician. The clinician always explains the situation in a way I can understand. I don’t want to be frightened by the records” (patient number Non-user P1).
The definition of inaccessible application is that application is difficult to access or use due to technical barriers (e.g. difficulties in accessing or using requisite technologies). One quote: “I use a smartphone without Internet. So I don’t use the service of… But my daughter uses it (patient number Non-user P2)”. Another quote is that “I don't want to use my phone too much. I’m not a technology type of person. Although I installed the app, I only check it once a day. The clinicians and nurses are still under the obligation to communicate with patients even though I use the app” (patient number P16).
The code patient–clinician conflict is defined as the user belief that record information may raise tension between the user and his/her clinicians, or strain the patient–clinician relationship. A quote for this code is “to some extent, the clinicians are reluctant to share everything with us. I am afraid I asked too many questions and annoyed the clinician. When I saw some abnormal records…” (patient number P7).
Semi-structured interview results
For the semi-structured interviews, users valued usability, ease of use, adequacy of the application (meeting needs) the most as shown in Table 2. Besides, patients attached moderate importance to response time, responsiveness, efficiency of the application, effectiveness of the app. Nevertheless, patients showed the least interest in data security. For users who scored 2 or 3 for data security, we asked about their perception toward it. The reason that they didn’t take data security as the first consideration during the adoption of the PAEHRs application is: firstly, the application is a useful tool for inpatients, so the usefulness and ease of use are far more important for users; secondly, patients thought that the authorization code is safe enough otherwise the data will be stolen anyway.
Semi-structured interview results.

Quantitative study analysis
Researchers have advanced several models for technology acceptance, including the task-technology fit (TTF) theory 42 and more recently the Unified Theory of the Acceptance and Use of Technology (UTAUT). 43 These theories have examined the factors that impact user acceptance of new technology from difference perspectives and bolstered technology acceptance research considerably. 44 There are many studies show that combine TTF with UTAUT can explain user adoption and intention with technology well.45,46 Therefore, drawing broadly on the results of qualitative research and literature review, we choose UTAUT and TTF models to guide our quantitative study.
The adoption of PAEHRs application depends on a patient's decision to use the technology, expressed in the literature as behavioral intention (or intention to use). 47 Venkatesh et al. empirically integrated eight distinct psychological and sociological theories to propose antecedents of users’ adoption and usage of technologies producing the UTAUT and UTAUT2 which increased the predictive ability of prior technology acceptance models.48–50 UTAUT has been chosen as a theoretical perspective to explore factors affiliated with patients’ use of ePHRs.51,52 The results testified again that performance expectancy, effort expectancy, social influence and facilitating conditions explain a high proportion of the technology adoption and usage. 52
To analyze user usage behavior, TTF is extended from TAM by considering how task affects the technology use. 42 TTF theory has been applied across varied contexts to understand the linkage between tasks requirements, the functionality of the technology, utilization frequency, user reactions, and performance, due to its succinctness and popularity. 53 According to the TTF theory, a suitable task-technology characteristic will encourage use of technology and the perceived fit among the task, technology and users will improve the technology use. 54 The TTF adoption model suggests that the user will use a new information technology if it assists an individual in performing his or her portfolio of tasks efficiently. 55 Hence, the adoption of a new information system will depend greatly on the users’ daily tasks. 56
In the healthcare context, especially in our research, the function of PAEHR is as a practical tool that enables inpatients to access information to fulfill their daily tasks such as informing results and making decisions, rather than entertainment tools, and the results of interviews also support this conclusion. So how tasks and technology fit may determine patients’ adoption and use. Although researchers are using the integration of TTF and UTAUT in the area of mobile banking,57–59 to the best of our knowledge, none of the existing studies have taken a holistic view of assessing PAEHRs by examining the technology perception and task technology fit. Appendix A summarizes some important empirical research on users’ adoption of PAEHRs.
Research model of quantitative study
PAEHR is a relatively new concept. In this study, we posit that the TTF combined with user perceptions of technology in the service play an important role in the decision to adopt PAEHRs. We propose a holistic research model that is theoretically grounded on two well-established theories: (a) TTF and (b) UTAUT. The TTF model provides the theoretical basis to assess the task technology fit in PAEHR, the technology characteristics and task characteristics are not measured in this study due to the homogeneity of the patient's task and the sole technology tested. Attitude toward technology is measured using UTAUT. Since PAEHR is rather new to mHealth, user experience is scarce. In Yuebei People's Hospital, the PAEHRs sit in highly volunteer-driven environments. Consequently, two UTAUT moderators, voluntariness and experience are not considered in this study. However, the two other moderators, gender and age are taken into account to remain as close as possible to UTAUT. The research model is depicted in Figure 2.

Research model incorporating TTF and UTAUT to understand intention to use and use behavior.
Hypotheses development of quantitative study
In the current study, the PAEHRs practice named EHRs Openness uses wireless technologies to provide patients access to information and doctors’ notes. EHRs Openness supplements the traditional face-to-face doctor–patient communication channel with real-time test results and doctors’ notes information transfer.64,65 Technology makes I Openness attractive to users by empowering patients fulfilling daily health care tasks in terms of accessing information to acquire knowledge of disease, especially making decisions such as choosing palliative care or surgery after more thoroughly understanding their situation. 25 Whether patients adopt and use the technology is subject to the extent of task technology fit. 56 Namely, when the technology of PAEHR provides functions and support that fit the requirement of the task of inpatients, the adoption and actual use will be increased. 56 Therefore, we define our first hypothesis as Hypothesis 1 (H1):
Hypothesis 1 (H1): Task technology fit positively influences user use of PAEHR.
According to Goodhue and Thompson, 56 the impact of TTF on utilization is also shown via a link between TTF and beliefs about the consequences of using a system (i.e. performance expectation). This is because TTF should be one important determinant of whether systems are believed to be useful, or give more relative advantages. The impact of TTF on performance expectation was tested previously in the area of mobile banking, see Refs.57,58 Thus, we speculate that if inpatients perceive that PAEHR assists individuals in performing his or her portfolio of tasks, they will more likely to believe the PAEHR is useful. Thus, we put forward our Hypothesis 2 (H2):
Hypothesis 2 (H2): Task technology fit positively influences the performance expectancy of PAEHR.
The UTAUT identifies four elementary variables that are direct predictors of intention or behavioral usage. They are performance expectancy, effort expectancy, social influence, and facilitating conditions. 48 Performance expectancy is defined as the degree to which an individual believes that using the system will provide benefits in performing activities. 48 Melanie et al. 66 and Dutta et al. 59 concluded that perceived usefulness (performance expectancy equivalent) is a key factor for a user to accept personal health records. Performance expectancy indicates that the user realizes benefits from the use of the PAEHR. It bears similarities to the perceived usefulness construct from TAM and DTPB. 58 The gains to patients from PAEHR can be more than those available from face-to-face communication or paper-based records. Such benefits include convenience, knowledge, satisfaction, financial benefits, and personal image.50,59 This leads us to formulate our Hypothesis 3 (H3):
Hypothesis 3 (H3): Performance expectancy positively influences the behavioral intention to adopt PAEHRs.
Effort expectancy is defined as “the degree to which a person believes that using a particular system would be free of effort.” 49 This construct reflects the perceived ease of use (TAM/TAM2), complexity (MPCU) and ease of use (IDT), 49 and has a positive impact on behavioral intention. According to Venkatesh et al., 48 the effort expectancy construct is significant in both voluntary and mandatory usage contexts; however, the significance of the effort expectancy is valid only during the first time period (post-training), becoming nonsignificant over periods of extended and sustained usage. In our research, EHRs openness is used by patients for the duration of a hospital stay. Outside of that, patients have no access to their complete EHRs. So in the context of this study, the effort expectancy is hypothesized to be positive to the intention to use.
Hypothesis 4 (H4): Effort expectancy positively influences the behavioral intention to use a PAEHR.
Social influence is a direct antecedent of behavioral intention and is defined as “the degree to which an individual perceives that relevant people believe he or she should use a system.” 49 Based on the social influence theory, individuals can adopt certain behaviors based on the pressures created by social interactions and norms. 67 Consistent with this notion, users’ behavior is influenced by the way peers in the same ward or family members or doctors or nurses value the use of PAEHRs. The inpatient user may feel informed, involved and professionally helped by using a new health technology such as PAEHRs.
Hypothesis 5 (H5): Social influence positively influences the behavioral intention to use a PAEHR.
Facilitating conditions is defined as “the degree to which an individual believes that an organizational and technical infrastructure exists to support the use of the system.” 49 Facilitating conditions are considered to have a direct effect on technology adoption, rather than on usage intentions. Previous studies have confirmed the positive and significant influence of facilitating conditions on usage behaviors such as the usage of the I patient portal. 27 Various approaches to facilitating PAEHRs such as nurse introduction to the application and support from the organization remove hurdles to usage and influence adoption. To confirm this relationship in the context of inpatients’ usage of PAEHRs, the following hypothesis is proposed:
Hypothesis 6 (H6): Facilitating conditions positively influence the adoption of PAEHR.
Previous studies suggest that intention to use a system is the most salient predictor of usage behavior and has been well established not only in IS in general but also in health care and eHealth.29,50,68–70 Hence, we formulate Hypothesis 7 (H7):
Hypothesis 7 (H7): Behavioral intention to use PAEHR has a positive effect on user adoption
As theorized by UTAUT, the relationship between performance expectancy and intention will be moderated by gender and age. Performance expectancies are likely to be especially salient to men for the reason that men tend to be highly task-oriented. 49 With respect to gender, it has been found that younger workers may place more importance on extrinsic rewards. 49 Effort expectancy is also often more salient for women than for men, which could be driven by cognitions related to gender roles. Increased age is related with difficulty in processing complex tasks and allocating attention to information on the job. According to the UTAUT, women tend to be more sensitive to others’ opinions and therefore find social influence to be more salient when forming an intention to use new technology. 49 And, the elders are more likely to place increased salience on social influences. Organizational psychologists have noted that older workers attach more importance to receiving help and assistance on the job, 49 which could be further inferred that older inpatients will be more likely to use the application if the nurses and other IT staff would provide support for them. To examine these moderation relations and see if they hold in the context of PAEHR, we propose the following additional hypotheses (H8, H9, H10, and H11) to test:
Hypothesis 8 (H8): The influence of performance expectancy on behavioral intention will be moderated by gender and age, such that the effect will be stronger for men and particularly for younger men.
Hypothesis 9 (H9): The influence of effort expectancy on behavioral intention will be moderated by gender and age, such that the effect will be stronger for women, particularly younger women.
Hypothesis 10 (H10): The influence of social influence on behavioral intention will be moderated by gender and age, such that the effect will be stronger for women, particularly older women.
Hypothesis 11 (H11): The influence of facilitating conditions on usage will be moderated by age, such that the effect will be stronger for older patients.
Study instruments for quantitative study
To explore the model shown in Figure 2, a survey instrument was developed based on prior literature. The items and the scales for the TTF constructs were chosen and adapted from these existing studies to keep them consistent with the redefinitions of the determinants of PAEHRs acceptance behavior.56,71 The items and scales for the UTAUT constructs were also adapted from existing studies.27,48,72 The scale items of the independent variables were measured by a seven-point Likert scale ranging from 1 (strongly disagree or seldom use) to 7 (strongly agree or frequently use). The questionnaire was constructed in English and reviewed for content validity. Since it was aimed at the Chinese general population, the English version of the instrument was then translated to Chinese. An IS professional translated and another IS professionally reviewed the instrument for content validity.
After the preliminary questionnaire was completed, we conducted a pretest to refine the questionnaire. In the pilot survey, we consulted with 5 teachers and 10 postgraduate students in health informatics, as well as 2 doctors and 5 nurses in Yuebei People's Hospital. The pilot study results are not included in the main survey. The final constructs, operational definitions, and measurement items are listed in Appendix B.
Participants for quantitative study
All the participants in this study were actual users of PAEHR applications to guarantee content validity. The application allows the user (patients or a family member of the patient) to check test results, examination reports, progress notes, ward round records, surgical records and other information using a mobile phone or portable device. Participation in the study was voluntary.
We formed a research group to collect data conducted in the wards of Yuebei People's Hospital. Since our target participants were individuals who had used the PAEHR, we asked potential participants if they had used it in the first place. Patients who were severely ill or could not speak were not approached for the study. The survey was continued only if the patient had already used the PAEHRs. We provided a small gift to encourage participation. The survey ran in April 2019 and lasted for 12 days. We collected 276 questionnaires, and 235 responses were valid. To catch unengaged responses, an instructed-response item was added in the questionnaire. 73 The respondents who answered the instructed-response item incorrectly were recognized as unengaged responses and their questionnaires were invalid. During sampling, there were several departments we could not conduct surveys in such as the critical care unit, neonatology, and the burns unit. We chose 5 of the remaining departments randomly in which to conduct the survey. Whilst wanting to randomly sample, it was necessary to exclude some departments due to the ethical consideration of wanting to minimize the impact on health care delivery.
Process of quantitative study analysis
After conducting a survey research following Katte Kelley et al.'s suggested processes, 74 partial least squares (PLS)-structural equation model (SEM) analysis was used to test our model. Since the research is an early stage exploratory assessment of PAEHRs and more than half of the items in the data are not normally distributed (p < 0.01 based on Kolmogorov–Smirnov's test), the PLS is the most appropriate method for this study. 75 The complexity of the model (a large number of moderators) also makes PLS attractive for this research, as it is less restrictive on the sample size and data distribution. 76 PLS estimation requires 4–10 times the number of structural paths directed at a particular construct in the model.76,77 The sample in our study met the necessary conditions for using PLS.
We also followed a two-step procedure, 78 where the first stage estimates the latent constructs’ scores (i.e. outer model evaluation) and the second stage calculates the outer weights and loadings as well as the path coefficients of the structural model (i.e. inner model evaluation). A confirmatory factor analysis (CFA) was conducted to test the convergent and discriminant validities of the constructs, and then, the structural model was tested to indicate the relationship among latent variables.
Results of qualitative study analysis
Our participants’ characteristics are shown in Table 3.
Demographic characteristics of study respondents.

Measurement model
Firstly, we analyzed the suitability of data for factor analysis. 79 The adequacy of the sample is measured by KMO in SPSS. The sampling is adequate or sufficient if the value of Kaiser Meyer Olkin (KMO) is larger than 0.5 80 or 0.6. 81 The strength of the relationship in SPSS can be measured by a Bartlett Test of Sphericity. The significant value of less than 0.05 indicates that these data do not produce an identity matrix and are thus approximately multivariate normal and acceptable for further analysis.79–81 In this study, the value of KMO is 0.925 and the significant value for Bartlett's Test of Sphericity is less than 0.05.
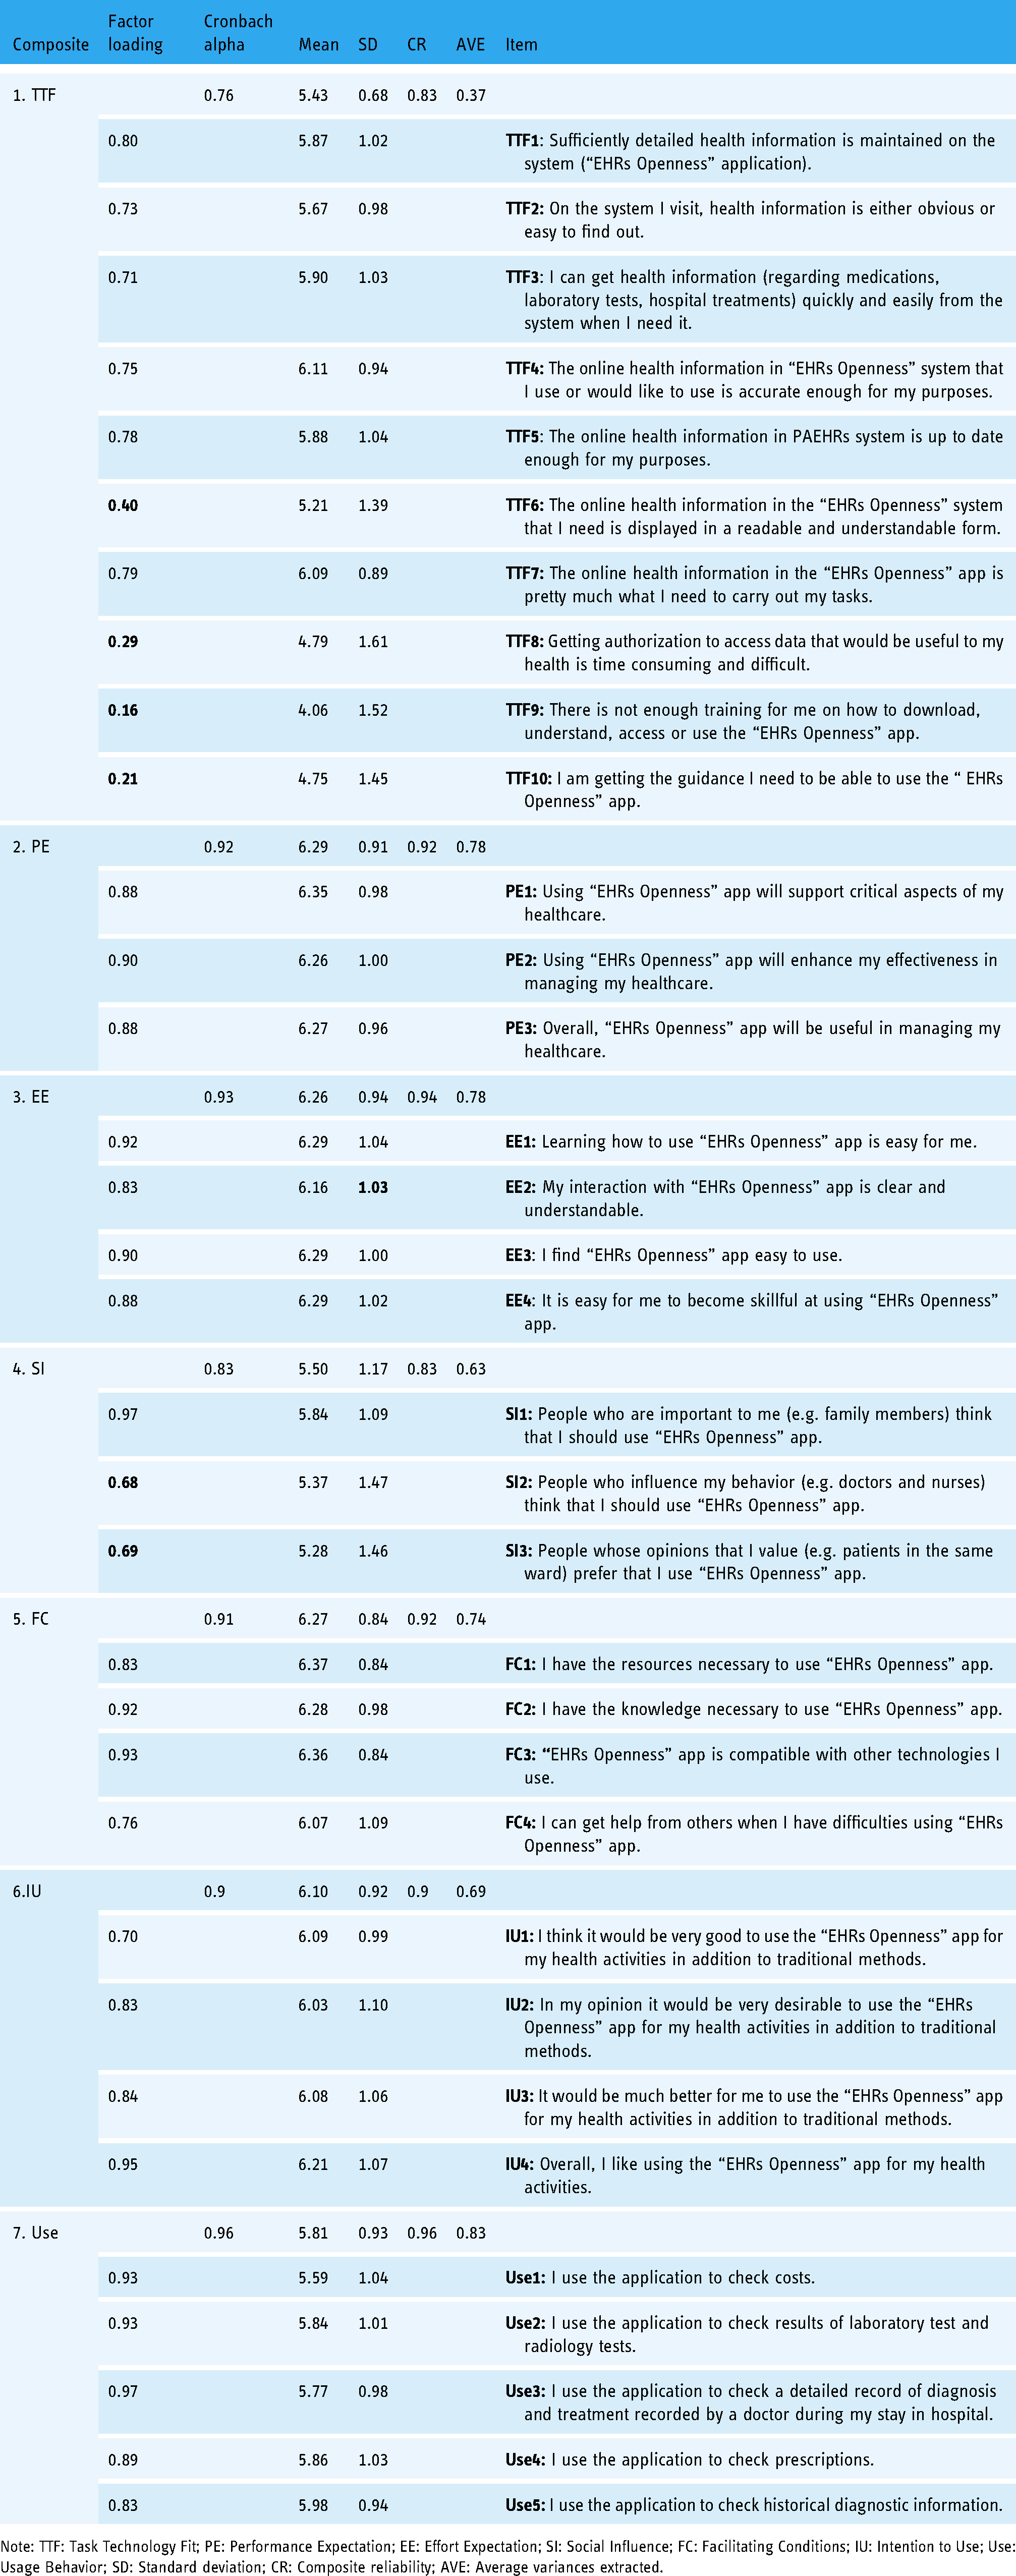
According to Joe Hair et al., 82 to evaluate construct reliability, Cronbach alpha, the composite reliability coefficient (CR) and average variance extracted (AVE) could be reported. Although other researchers claimed that the CR is more appropriate for PLS,27,83 we listed the three different values in Appendix B. The Cronbach's alpha of each construct ranged from 0.76 to 0.96 is above the recommended value of 0.70 by Hair et al. 84 CR values of the latent factors are above 0.70 also suggested by Hair et al. 84 and absolutely exceed the threshold of 0.60 recommended by Bagozzi. 85 Next, we assessed the convergent validity of the constructs. Convergent validity is achieved if the average variance extracted (AVE) scores are above 0.50 86 and each item has outer loadings above 0.70. 78 However, an item is recommended to be eliminated only if its outer standardized loadings are lower than 0.40. 87 Consequently, TTF8, TTF9, and TTF10 should be deleted. And after deletion, the AVE of TTF is 0.52, and the value of CR is 0.88. Detailed results of descriptive, reliability and convergent validity of the measurement model are summarized in Appendix B.
After examining the convergent validity, we assessed the discriminant validity using the heterotrait–monotrait (HTMT) ratio. Following the recommendations by Henseler et al. 88 and Hair et al., 82 authors should report the recently developed HTMT criterion for discriminant validity, instead of cross-loadings or Fornell–Larcker. According to Henseler et al., 88 discriminant validity is achieved if the HTMT value does not exceed the threshold value of 0.90. Table 4 displays the HTMT scores, which indicate that discriminant validity of usage behavior is not achieved.
Summary of discriminant validity (HTMT).
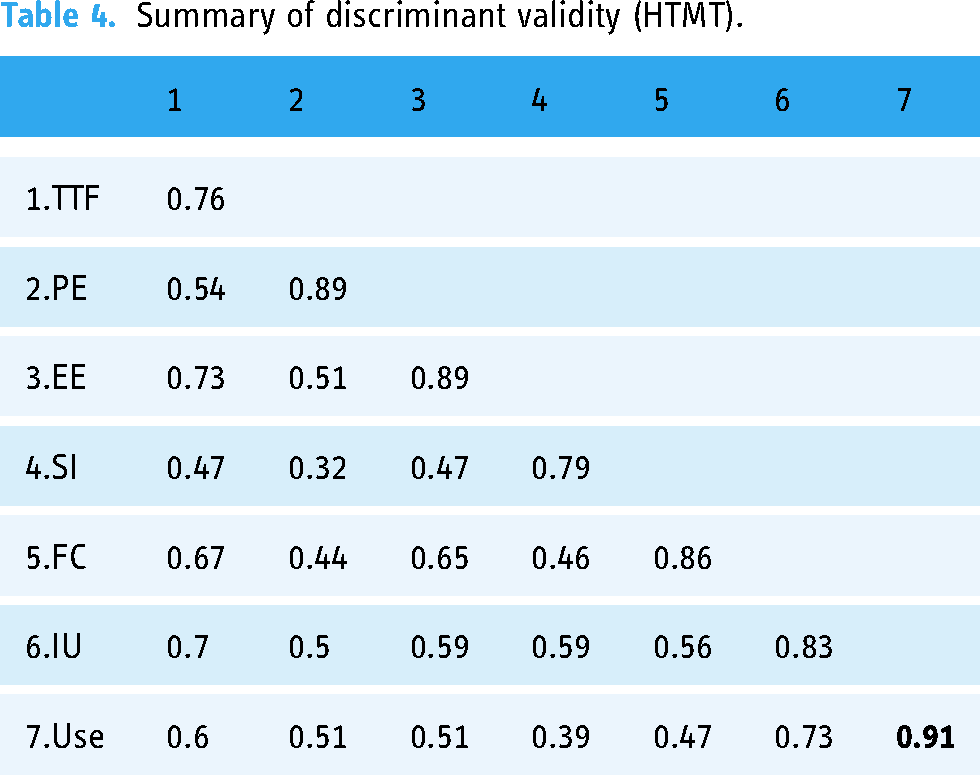
Since there were HTMT scores above the threshold (i.e. 0.90), we checked the upper confidence interval scores. Henseler et al. 88 note that discriminant validity is achieved when the value of HTMS is above 0.90 but the upper confidence interval value is less than one. We ran the bootstrap resampling procedure (3000 subsamples) to obtain the upper confidence interval value and to test the research hypotheses. The upper confidence interval was 0.75. Since the upper confidence interval for intention to use-usage behavior was less than one, discriminant validity is achieved.
Structural model
Table 5 displays the results of the bootstrapping procedure. The results show that task technology fit positively affects usage behavior and performance expectancy, supporting H1 and H2. Performance expectancy, effort expectancy and social influence positively affect intention to use. That is to say H3, H4, and H5 were supported. However, H6 was not supported; this means that facilitating conditions did not influence usage behavior. Intention to use positively influence usage behavior (H7 was supported). Pertaining to moderation effects, neither gender nor age showed significant influence on intention to use or usage behavior.
Results of hypotheses testing.

Note: SPC: Standardized path coefficient.
*p < 0.1.
**p < 0.05.
***p < 0.01.
Discussion and conclusion
Principal findings
The qualitative analysis of in-depth interview transcripts identified respondents’ perspectives on the perceived benefits (task productivity, customer satisfaction) of PAEHRs application to support hospitalization care, barriers (poor quality information and external limitations to usage) to application use or application adoption. For the semi-structured interviews, users valued usability, ease of use, and adequacy of the application (meeting needs) the most. Besides, patients attached moderate importance to response time, responsiveness, efficiency of the application, effectiveness of the app. Nevertheless, patients showed the least interest in data security.
For the quantitative research, the important antecedents of usage behavior are task technology fit and intention to use. Facilitating conditions are not significantly related to usage behavior. In UTAUT, both age and gender are important moderators. However, our study findings were not consistent with previous findings (see Ref. 58 ). The reason may be that the inpatient's information demand exceeds those hindrances such as low IT self-efficacy caused by age (older) and gender (female). Yet, the efforts of related researchers attaching importance to gender and age are still in deficiency. 89
Both qualitative and quantitative studies proved that patients valued performance expectation, effort expectation, social influence and task technology fit when they decide to accept PAEHRs.
If our sights shift from the paths to items of constructs, there is some evidence to validate the findings of the qualitative study. Firstly, although SI2 and SI3 which represent social influence and support from doctors, nurses and patients in the same ward were not deleted, the outer loading value of two items is underneath the threshold value of 0.70. Combined with their low mean value, an undesirable situation in that patients considered that doctors and nurses were in some way reluctant to share EHRs with them occurred, which was akin to the findings of qualitative study. 25 The attitude of patients who shared a ward was not a valuable social influence either. To patients in our research, the most salient social support is from family members. However, we cannot find other research to further compare or corroborate our findings for previous studies seldom specify the social influence origins.
The Items of TTF show consistent e”Iden’e with qualitative study in terms of low information readability. TTF6 means that the information is understandable and readable, and the loading value of TTF6 is close to the deletion threshold of 0.40. Combined with the low mean value of TTF6, it indicates that patients hold the opinion that information on the app is to some extent difficult to understand, which is in line with the findings of the qualitative study. The reason why the mean values and loading values of TTF8 and TTF9 are both low may be due to the fact that they are reverse wordings, and the low scores maybe been contaminated by respondent inattention and confusion. 90 TTF10 means patients could get enough guidance to use the app; however, the relatively low mean value tells us that patients considered the staff members of the hospital provided limited guidance. Nevertheless, the high score of use demonstrates that these adverse conditions seldom affect their actual usage.
Theoretical implications
Performance expectation and effort expectation are, inter alia, essential predictors which were verified by both our qualitative and quantitative research, corroborating other scholars (see27,52,91). Except for these two predictors, social influence here was demonstrated to be a significant indicator to predict patients’ usage intention. According to Venkatesh et al., 49 the social influence construct is not significant in a voluntary context. Consistent with this pattern,27,28 in which UTAUT2 was applied to examine antecedents also found that social influence was nonsignificant. However, a research concerning wearable healthcare technology acceptance by the elderly, 92 which was also conducted in a voluntary context, found that social influence had a positive relationship with the adoption. The reason why the inclusion in a current study appears abnormal is perhaps due to the fact that under the hospital care context patients may take nurses’ introduction of the application as a relatively mandatory requirement or the users are sitting in an unfavorable place, especially for hospitalized patients and elderly. However, this hypothesis awaits further confirmation.
There is closely related research led by Tavares and Oliveira, 27 who integrated UTAUT2, self-perception and chronic disability (as one of the moderators) to provide insight into antecedents of users’ adoption of I patient portal. The reason why we chose not to use self-perception as a vital constructor (which appeared to be significant determinant of intention to use an IT, especially for patients in Refs.93,94) is that the respondents we investigated in the current study were all inpatients, who may feel offended, or did not want to demonstrate the real health condition due to superstition.
Some studies put privacy concerns into consideration due to the fact of the legitimacy and belonging of the patient data (see Ref. 95 ). Yet, there is no evidence in this current study to prove that in a hospital care context patients attach much appreciation, concern or misgivings to data security. This result is found to be consistent with Mold et al. 2 who argued that there were no reports of harm or breaches in privacy among studies concerning PAEHRs in primary care. However, substantial studies29,30,96 have demonstrated privacy and security concerns have been investigated in connection with the intention to use and use. The controversial findings need to be further investigated in the cultural context.
Facilitating conditions are not significant constructs in this study and other studies.27,28 Patients did not mention facilitating conditions such as their resources and knowledge as obstacles to using PAEHRs application in our qualitative research. This is possibly due to the prevalent usage of smartphones and users’ increasing IT self-efficacy. 2
Managerial implications
Leveraging the integrated findings, three important practical recommendations are made to address the needs and concerns of inpatients and enhance PAEHRs application. Firstly, the findings of our study may offer practitioners guidelines to design. Specifically, inpatients value the material design of the layout and display of the output contents. Moreover, inpatients in our study have the freedom to access all parts of the EHRs including physicians’ notes, radiology results, operative reports, and billing information, which are highly requested by patients as found by other studies.2,23,25 However, patients expressed concerns about information overload and anxiety toward advanced-level content. The findings imply practitioners should look to translate medical terminology from EHRs into patient-friendly language. Looking ahead, we need far more open reporting on the (many) limitations of EHRs (including PAEHRs) in providing important insights into how to improve the design of EHRs. 97
Secondly, users of PAEHRs are worried about the negative impact on doctor–patient communication after PAEHRs usage. Their concern originated from a two-fold consideration, one is cognitive overload then requiring professional interpretation, and another is with plenty of information provided online might lead to doctors reducing face-to-face communication, which is in line with Kelly et al.’ s study. 25 In China, patients find a wide gulf between patient experience during actual health care delivery and the institution's claimed patient-centered care which leads to a trust deficiency. 98 From this point, PAEHRs which are provided as a supplementary means to inform information should not hinder or undermine the desired doctor–patient face-to-face communication. Last but not least, because PAEHRs are relatively novel applications and the information embedded is probably difficult to understand for patients, PAEHRs could be seen as a technology-driven service encounter, which may bring disruptive effects. 99 As Lee, 99 Lee and Lee, 70 and Radaelli et al. 100 suggested, it is maybe helpful that hospital administrators consider the introduction, training and instruction strategies (targeted at application usage) to improve the learning experience, as well as doctors, transfer healthcare knowledge to enhance patients’ health literacy. These two strategies are believed to sequentially optimize PAEHRs’ impact on care quality and patient experience satisfaction.99,100
Limitations and directions for further research
This study is not free of caveats or limitations. Firstly, due to consideration of medical ethics, the construct of self-perception which is one of the determinants of health action in the health belief model was not included in our study. Secondly, the current study interviewed patients for one month duration and gathered data at one point in time. Future research could avoid common method bias with better confidence by introducing a time lag between the measurement of the predictor and criterion variables. Thirdly, the demographic of our research sample may limit the generalizability of our findings. To our best knowledge, there are only three public hospitals that implemented PAEHRs in China, and except for our sample hospital, information about other potential candidates is limited. However, we argue that it is a well-rounded study of related factors and perceptions of hospitalized patients and caregivers toward PAEHRs under the context of China. Fourthly, we did not employ any outcome indicators to investigate the influences of the implementation of PAEHR. Wherever possible, using robust study designs preferably randomized controlled trials and clinical endpoints as outcome indicator is an ideal research route.
Conclusions
Our current study indicates that it is necessary to consider PAEHR’ task-tool role in patients’ adoption and use behavior, which was validated by both qualitative and quantitative data analysis. Hospitalized patients value PAEHR’ practical attributes and attach much more importance to the information content and application design. Based on the attributes of PAEHR which could be seen as a technology-driven service, the outcome of PAEHR usage may be better when the appropriate emphasis is placed on introduction, training and instruction strategy development.
Footnotes
Abbreviations
Acknowledgments
This work was supported by the National Natural Science Foundation of China (Grant No. 71974065, No. 72204153). The funding source provided financial support for the collection, analysis and interpretation of data; in the writing of the report.
Contributorship
Jing Liu: Data curation, Software, Writing-Original Draft.
Xiaoqian Gong: Data curation, Software, Writing-Original Draft.
Mark Weal: The third author, Conceptualization, Writing-Review & Editing.
Wei Dai: The fourth author, Software.
Shengchao Hou: The fifth author, Investigation.
Jingdong Ma: The corresponding author, Conceptualization, Writing-Review & Editing.
Jing Liu and Xiaoqian Gong were the co-first authors.
Declaration of conflicting interests
The authors declared no potential conflicts of interest with respect to the research, authorship, and/or publication of this article.
Ethical approval
The authors are accountable for all the aspects of the work in ensuring that questions related to the accuracy or integrity of any part of the work are appropriately investigated and resolved. This study received ethical review from the Medical Ethics Committee of the Yue Bei People's Hospital (No. KY-2021-047).
Funding
The authors disclosed receipt of the following financial support for the research, authorship, and/or publication of this article: This publication is supported by the National Natural Science Foundation of China with no percentage financed with non-governmental sources (PI: JM; grant number: 71974065; PI: JL; grant number: 72204153). The contents are those of the author(s) and do not necessarily represent the official views of, nor an endorsement, by the National Natural Science Foundation of China.
Guarantor
JM.
Informed consent
Informed consent was obtained after the procedure was fully explained to all participants and their legal guardians.
Appendix A. The summary of some of the empirical research in users’ adoption of PAEHRs.

| Authors | Publication year | Theories | Sample | Target country or region | Method |
|---|---|---|---|---|---|
| Tavares J, Oliveira T 27 | 2016 | UTAUT2 and self-perception | 360 valid respondents | Portuguese | PLS |
| Bireswar Dutta, et al. 60 | 2018 | TAM and HTSE | 234 valid responses | Taiwan | SEM |
| Vahid Assadi, Khaled Hassanein 61 | 2017 | SDT | 159 valid responses | Canada | PLS |
| Mihail Cocosila, Norm Archer 62 | 2014 | Constructs include personal information technology innovativeness, computer anxiety, privacy, security and trust, perceived usefulness. | 772 valid responses | Canada | PLS |
| Jamil Razmak, Charles Bélanger 63 | 2018 | TAM and compatibility and communicativeness. | 325 patient respondents | Canada | SEM |
The target population in all studies was patients.
HTSE: health-care technology self-efficacy; SEM: structural equation modeling; PLS: partial least squares; SDT: self-determination theory.
Appendix B. Descriptive,reliability and convergent validity.
| Composite | Factor loading | Cronbach alpha | Mean | SD | CR | AVE | Item |
|---|---|---|---|---|---|---|---|
| 1. TTF | 0.76 | 5.43 | 0.68 | 0.83 | 0.37 | ||
| 0.80 | 5.87 | 1.02 | |||||
| 0.73 | 5.67 | 0.98 | |||||
| 0.71 | 5.90 | 1.03 | |||||
| 0.75 | 6.11 | 0.94 | |||||
| 0.78 | 5.88 | 1.04 | |||||
| 5.21 | 1.39 | ||||||
| 0.79 | 6.09 | 0.89 | |||||
| 4.79 | 1.61 | ||||||
| 4.06 | 1.52 | ||||||
| 4.75 | 1.45 | ||||||
| 2. PE | 0.92 | 6.29 | 0.91 | 0.92 | 0.78 | ||
| 0.88 | 6.35 | 0.98 | |||||
| 0.90 | 6.26 | 1.00 | |||||
| 0.88 | 6.27 | 0.96 | |||||
| 3. EE | 0.93 | 6.26 | 0.94 | 0.94 | 0.78 | ||
| 0.92 | 6.29 | 1.04 | |||||
| 0.83 | 6.16 | ||||||
| 0.90 | 6.29 | 1.00 | |||||
| 0.88 | 6.29 | 1.02 | |||||
| 4. SI | 0.83 | 5.50 | 1.17 | 0.83 | 0.63 | ||
| 0.97 | 5.84 | 1.09 | |||||
| 5.37 | 1.47 | ||||||
| 5.28 | 1.46 | ||||||
| 5. FC | 0.91 | 6.27 | 0.84 | 0.92 | 0.74 | ||
| 0.83 | 6.37 | 0.84 | |||||
| 0.92 | 6.28 | 0.98 | |||||
| 0.93 | 6.36 | 0.84 | |||||
| 0.76 | 6.07 | 1.09 | |||||
| 6.IU | 0.9 | 6.10 | 0.92 | 0.9 | 0.69 | ||
| 0.70 | 6.09 | 0.99 | |||||
| 0.83 | 6.03 | 1.10 | |||||
| 0.84 | 6.08 | 1.06 | |||||
| 0.95 | 6.21 | 1.07 | |||||
| 7. Use | 0.96 | 5.81 | 0.93 | 0.96 | 0.83 | ||
| 0.93 | 5.59 | 1.04 | |||||
| 0.93 | 5.84 | 1.01 | |||||
| 0.97 | 5.77 | 0.98 | |||||
| 0.89 | 5.86 | 1.03 | |||||
| 0.83 | 5.98 | 0.94 |
Note: TTF: Task Technology Fit; PE: Performance Expectation; EE: Effort Expectation; SI: Social Influence; FC: Facilitating Conditions; IU: Intention to Use; Use: Usage Behavior; SD: Standard deviation; CR: Composite reliability; AVE: Average variances extracted.