
Abstract
Objective
Urine colorimetry using a digital image–based colorimetry is potentially an accessible hydration assessment method. This study evaluated the agreement between urine colorimetry values measured with different smartphone brands under various lighting conditions in patients with dengue fever.
Methods
The urine samples were photographed in a customized photo box, under five simulated lighting conditions, using five smartphones. These images were analyzed using Adobe Photoshop to obtain urine Red, Green and Blue (RGB) values with and without colour correction. A commercially available colour calibration card was used for colour correction. Using intraclass correlation coefficient (ICC), inter-phone and intra-phone agreements of urine RGB values were analyzed.
Results
Without colour correction, the various smartphones produced the highest agreement for Blue and Green values under the ‘daylight’ lighting condition. With colour correction, ICC values showed ‘exceptional’ inter-phone and intra-phone agreement for the Blue and Green values (ICC > 0.9). Red values showed ‘poor’ (ICC < 0.5) agreement with and without colour correction in all lighting conditions. Out of the five phones compared in this study, Phone 4 produced the lowest intra-phone agreement.
Conclusions
Colour calibration using photo colour cards improved the reliability of smartphone-based urine colorimetry, making this a promising point-of-care hydration assessment tool using the ubiquitous smartphone.
Introduction
Assessment of patient's hydration is an important aspect of patient management. Conventional methods for estimating a patient's hydration status include assessment of the clinical signs and symptoms, and laboratory blood and urinary tests. Clinical signs and symptoms have poor sensitivity and specificity,1,2 and therefore, are inaccurate to be used alone to determine a patient's hydration status. Moreover, there is no one gold standard laboratory marker for assessing hydration status.3,4 Hematological indices such as hematocrit level and plasma osmolality are valid and reliable markers of hydration4–6 and are the most used in the clinical setting. However, blood collection is invasive, and the laboratory tests have a long turnaround time, which may serve as barriers to utilization for frequent monitoring of patient's hydration. On the other hand, urine tests are non-invasive and typically achieved using dipstick reagent strips in the clinical setting. Urine colour is determined by the concentration of the urinary pigment urobilin, which varies according to the degree of dehydration.5,7 In addition to urine colour, specific gravity and urine osmolality have also been shown to correlate with clinical dehydration.3,7–9
Assessment of urine colour using colour charts to assess hydration has been previously investigated. In a series of experiments, Armstrong et al. 7 found that urine colour, as measured using an 8-colour scale, was strongly correlated with urine osmolality and urine specific gravity in healthy subjects, and therefore, may be used interchangeably to determine hydration status. Urine colour assessment using a colour chart has been found to be a reliable low-cost method to assess hydration among nursing home residents 10 and correlates with urine output and urine to plasma sodium ratio in critically ill patients. 8
Some diseases allow self-monitoring for patients at home provided that they do not exhibit red flags suggesting fluid deficit. For home monitoring of patients, urine colour assessment is potentially an accessible method to inform patients of their hydration status. Even though urine colour charts such as Armstrong's 8-colour scale have been shown to be a valid method for urine colour assessment,3,4,7,8,11 it is known that inter- and intra-observer variability in the performance of colour-matching or assessment of colour differences exists.12–14 Interpretation of urine colour against a colour chart can be influenced by the ambient lighting condition, colour casts from other objects in the vicinity of the urine sample, and the subjectivity of the interpreter's perception of colours. 15 These limitations can be overcome using digital image-based colorimetry techniques with photos of urine samples taken, for example, using smartphones.
Several studies have demonstrated the concept of using digital image-based colorimetry as an alternative to lab-based analysis.16–18 The Red, Green and Blue (RGB) colour code is one of the most common and accurate methods used to represent colours in digital images including on smartphones. 19 Recently, Chew et al. 20 reported a strong correlation between the hydration status of dengue patients and RGB values obtained from smartphone urine images under one controlled lighting condition, suggesting the potential use of smartphones as a home assessment tool.
Smartphone images undergo several stages of processing, including lossy compression and non-linear scaling, to improve the aesthetic results and reduce their size for storage. 21 These processes are device-dependent and may introduce variabilities in the representation of colour values in images. To our knowledge, no studies have explored the reliability of urine colorimetry by comparing images sampled from different smartphones under various lighting conditions. The ability of the digital camera within a smartphone to provide consistent RGB values of urine colorimetry can be used to facilitate the development of a quantitative urine analysis system in a portable and ubiquitous device to enable patients to obtain rapid, accurate and actionable results.
This study aims to determine the agreement between urine colorimetry values measured with different smartphone brands under various lighting conditions in probable and confirmed dengue fever patients. This group of patients was selected as dengue is the most rapidly spreading mosquito-borne viral disease, 22 and dengue patients are at risk of dehydration and shock due to increased capillary permeability with variable degrees of plasma leakage and bleeding. 23
Methods
Study design and setting
This was a prospective observational study conducted from October 2021 to January 2022 at the Emergency Department (ED) of the University Malaya Medical Centre (UMMC). This study was approved by the Medical Research Ethics Committee of the UMMC (MREC ID NO: 202133-9919) on 1 April 2021. All participants provided written informed consent prior to enrolment in the study. This research was conducted ethically in accordance with the World Medical Association Declaration of Helsinki.
Study subjects
Patients with probable or confirmed dengue fever based on WHO diagnostic criteria 24 were eligible. They were recruited by convenience sampling following written informed consent. Exclusion criteria were patients with end-stage renal failure, chronic kidney disease or liver disease, or if they were unable to provide a midstream urine sample. Clinical assessment and management were completed by the attending physician, and the researchers did not delay or influence the patient's management. Urine samples were collected into hospital-standard plastic urine bottles within one hour of patient enrolment.
Sample size
The sample size for the intraclass correlation coefficient (ICC) was calculated based on the methods by Walter et al.
25
and Winer
26
:


Photography box setup and urine image capture protocol
Figure 1 shows the setup of the photography box for capturing the urine images. The box was made of polystyrene foam, measuring 35 cm (height) × 38 cm (length) × 50 cm (width), with white interior to avoid colour casts on the urine sample. The roof of the photography box had a window cut-out (4 cm × 4 cm) that allowed the placement of the smartphone camera array to capture photos of the urine sample. The roof had another window cut-out (13.5 cm × 7.5 cm) for the placement of an LED light source (Ulanzi VIJIM VL196 RGB light).

Photography box setup for capturing urine photos for the five different smartphones under five different lighting conditions.
Inside the photography box (Figure 2) was a transparent acrylic box (8 cm length × 8 cm width × 10.5 cm height) that was open at the top and was removable. The acrylic box housed a disposable Petri dish (5.5 cm diameter × 1 cm height) that would contain the urine sample. The use of the acrylic box was to prevent contamination of urine with other equipment used during urine image capturing. The acrylic box was cleaned and sanitized after each use.

The internal arrangement within the photography box. (a) Transparent acrylic box, (b) Petri dish, (c) colour calibration card, (d) white highlight (RGB 240, 240, 240), (e) gray mid tone (RGB 128, 128, 128) and (f) shadow (RGB 10, 10, 10).
To capture a urine sample image, the Petri dish was placed inside the transparent acrylic box that was already positioned inside the photography box. Ten milliliters of urine sample was transferred using a syringe, into the Petri dish. This would fill up the Petri dish to a height of 0.5 cm of urine. A photography colour calibration card (Datacolor SpyderCHECKRTM 24) was placed 2 cm next to the Petri dish. The colour calibration card contains 24 swatches of standardized colour targets including neutral grey, white and black.
Photos of the urine together with the colour calibration card were captured with each of the five smartphones, under each lighting condition consecutively, within 5 minutes of urine sample collection. The specifications of the five smartphones and the five lighting conditions are summarized in Tables 1 and 2, respectively. The brightness of all lighting conditions was set at 100% intensity. The practical significance of choosing these five lighting conditions was to consider the different situations that might affect the colour of urine images captured by a patient. ‘Warm light’ and ‘daylight’ were used to approximate ambient lighting with the absence of colour casts, whereas ‘red’, ‘yellow’ and ‘blue’ colours were introduced as casts. ‘Warm light’ was set at 3200 K to approximate indoor household lighting. ‘Daylight’ was set at 6500 K to approximate natural mid-day sunlight. 27 Colour casts were created by inserting coloured cardboards to completely cover the interior walls of the photo box. These coloured cardboards were created by painting mounting boards with Nippon Super Matex paint as described in Table 2. We used primary colours ‘red’, ‘yellow’ and ‘blue’ to model possible naturally occurring casts. The built-in digital camera of the smartphones was set to flash ‘off’, JPEG format (24 bits), and at the default resolution of each smartphone. In smartphones with multiple zoom lenses, the default wide-angle rear lens was used. Before each photo capture, the smartphone screen is tapped and held at the center (of the urine image) to lock the smartphone camera focus and exposure.
Specifications of the five smartphone cameras.

CMOS: Complementary metal-oxide-semiconductor.
Specifications of the five lighting conditions.
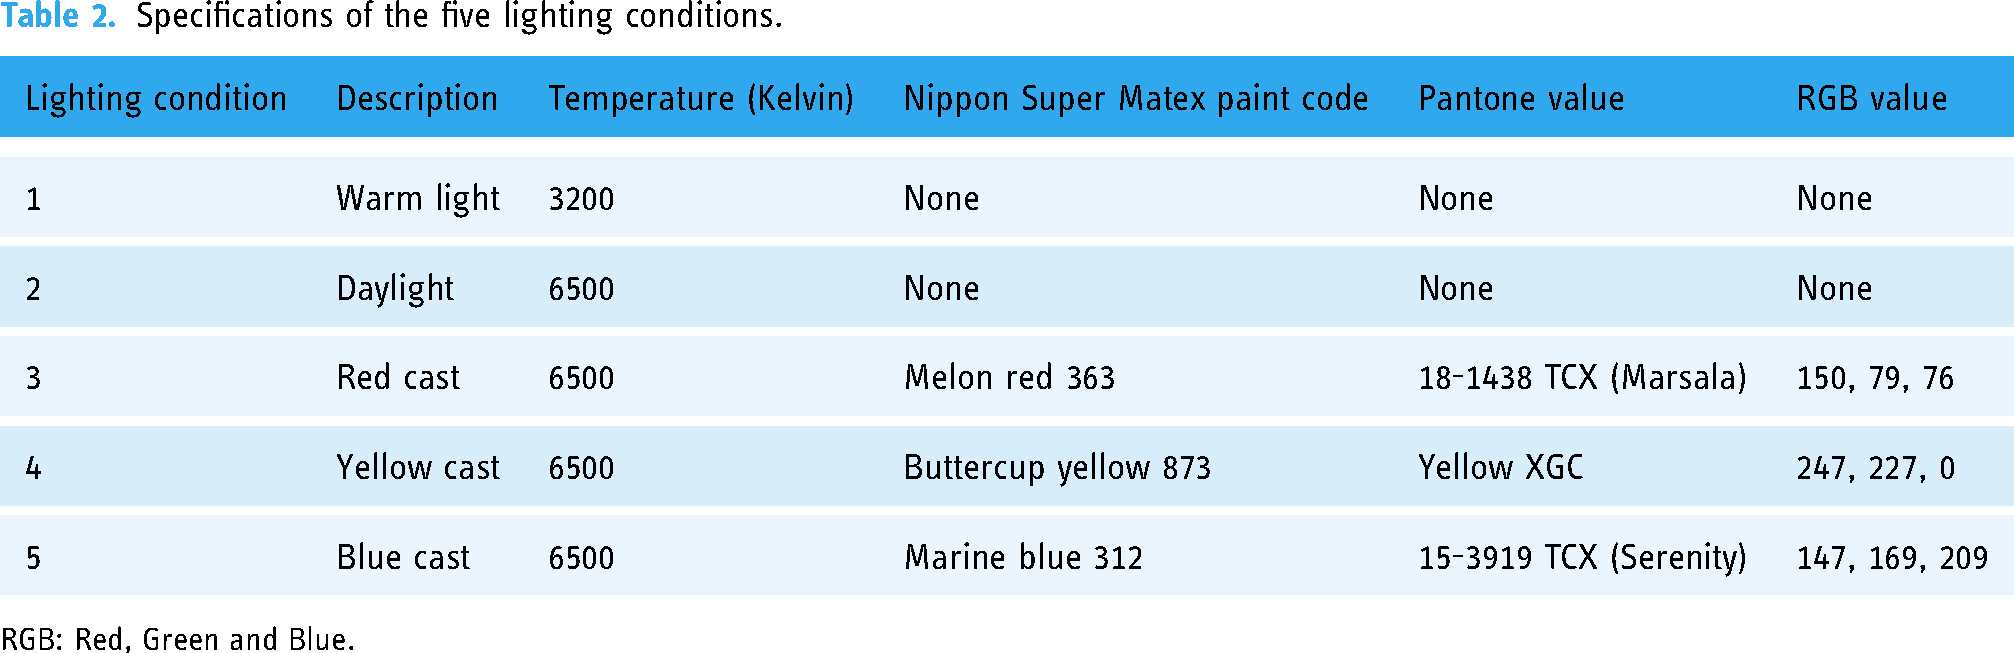
RGB: Red, Green and Blue.
Urine photo analysis and colour correction protocol
The urine images were transferred to a computer and loaded into Adobe Photoshop 2021 for MacOS. Figure 3 shows the process of obtaining RGB values of the urine samples with and without colour correction.

Flowchart of the process of colour correction and measurement of urine RBG values using Adobe Photoshop. RGB: Red, Green and Blue.
The colour correction steps in Adobe Photoshop involved selecting the ‘New Adjustment Layer’ and ‘Curves’ to apply white balancing. The ‘Eyedropper tool’ was set at a sample size of 5 × 5 pixels to sample the three reference colour patches on the SpyderCHEKRTM colour chart (Figure 2): ‘white highlight’ (labelled as D), ‘gray mid tone (labelled as E) and ‘shadow’ (labelled as F). These provided readings for uncorrected RGB values of the three reference colour patches. Adobe Photoshop uses proprietary algorithms to scale the uncorrected RGB values of the colour patches using the SpyderCHEKRTM reference values of D (240, 240, 240), E (128, 128, 128) and F (10, 10, 10). The next step was to select ‘Layer’ and ‘Flatten Image’ so that the colour correction was applied to the whole image. The colour-corrected RGB values of the urine samples were measured as averaged values within a 100 × 100 pixel area using the ‘Eyedropper tool’. Urine RGB values without colour correction were obtained directly from averaged values within a 100 × 100 pixel area of the urine image. The RGB data were then transferred to SPSS for data analysis.
Data analysis
Data were analyzed using IBM SPSS statistics version 26 for MacOS. All continuous variables were tested for normality with Shapiro–Wilk test. Demographic data, urine analysis, management during ED stay and outcome of the patients were analyzed using descriptive statistics. Parametric variables were reported in mean and standard deviation, while nonparametric variables were reported in median and interquartile range. Urine RGB values were obtained with and without colour correction for the five different smartphones under five different lighting conditions. Inter-rater (inter-phone) and intra-rater (intra-phone) agreements in urine RGB values were analyzed using ICC. The ICC analyses to what extent the subjects under investigation agree with each other with repeated measurements.
28
For the urine RGB values taken with five different smartphones under five different lighting conditions to be accepted as reliable, the variances in RGB values must be sufficiently small. ICC is the true variance over total variance inclusive of both true and error variance and is calculated as:
Results
A total of 58 patients were enrolled in the study, and all patients were included in the data analysis. Out of these 58 patients, 32 were diagnosed with probable dengue and 26 with confirmed dengue. Table 3 displays the demographic and clinical characteristics of the patients.
Demographic data, clinical characteristics and outcome of patients.
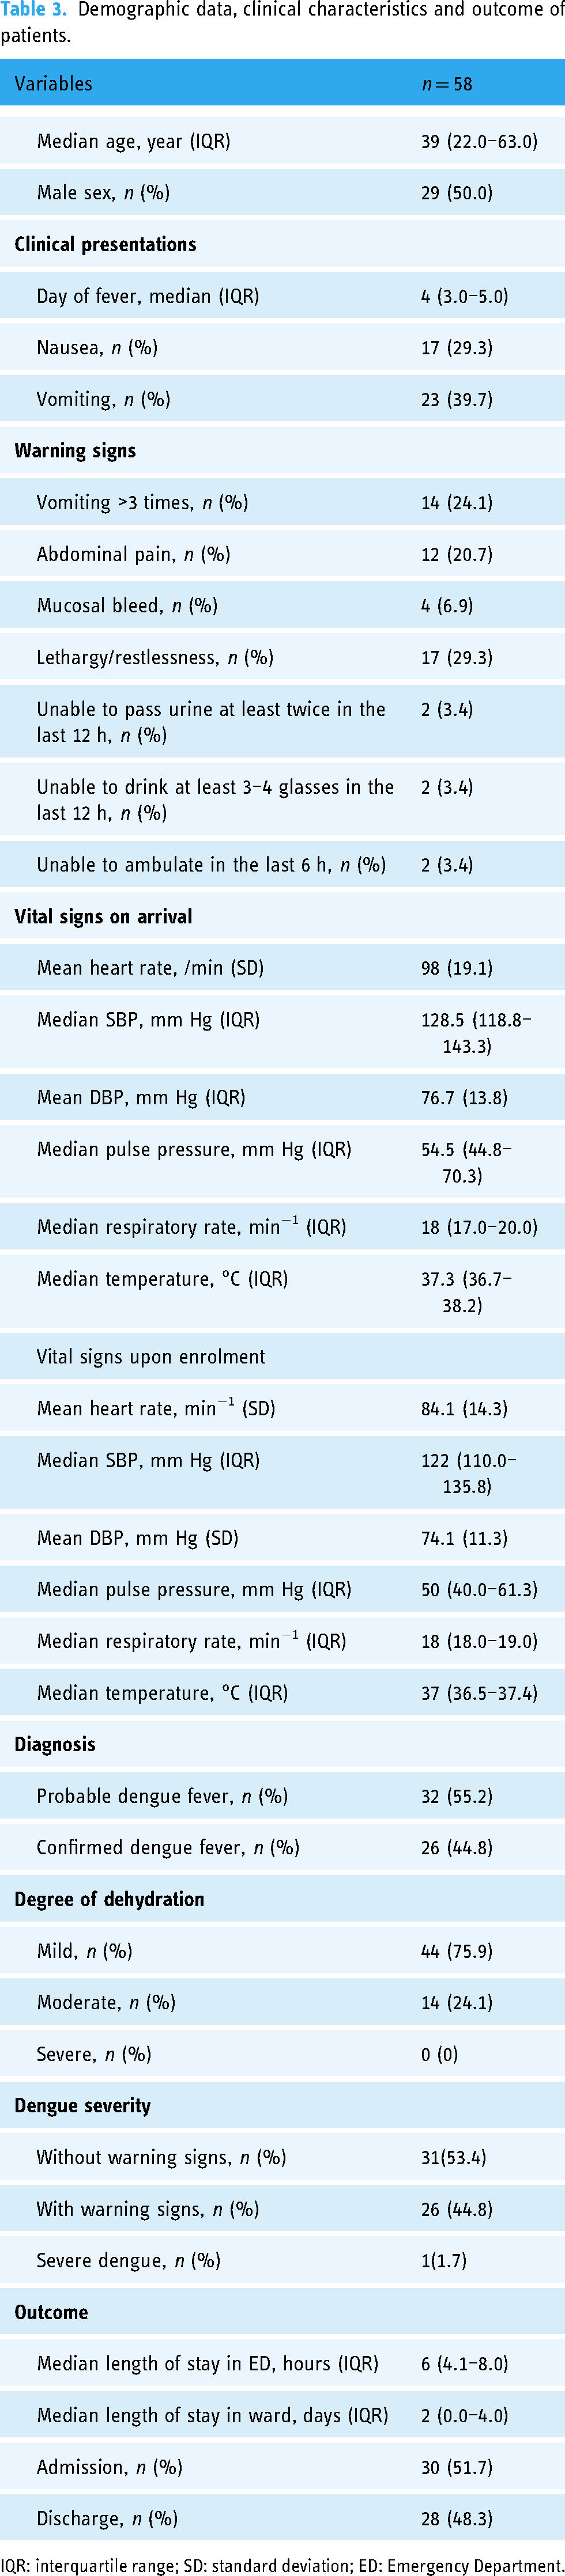
IQR: interquartile range; SD: standard deviation; ED: Emergency Department.
The inter-rater agreement analysis of five different smartphones, with and without colour correction under five different lighting conditions is summarized in Table 4. The agreement of measured Green and Blue values increased from ‘poor’ or ‘moderate’ to ‘exceptional’ with colour correction in all lighting conditions. Without colour correction, the Blue values showed ‘exceptional’ agreement in daylight. However, the Red values showed ‘poor’ agreement with and without colour correction.
Inter-rater agreement analysis of five different smartphones, with and without colour correction under five lighting conditions.

ICC: intra-class correlation coefficient; CI: confidence interval.
Intra-rater agreement analysis of each smartphone under different lighting conditions, with and without colour correction is summarized in Table 5. The agreement in Red values was ‘poor’ for all phones with and without colour correction. The agreement in Green values was ‘moderate’ for Phones 1 and 4, ‘good’ for Phones 3 and 5 and ‘exceptional’ for Phone 2. All phones demonstrated ‘good’ agreement for the Blue values except for Phone 4. With colour correction, all phones demonstrated ‘good’ to exceptional’ agreement for Green and Blue values.
Intra-rater agreement analysis of each smartphone under different lighting conditions, with and without colour correction.

ICC: intra-class correlation coefficient; CI: confidence interval.
Discussion
This study evaluated the agreement of RGB colorimetry measurement of urine images obtained from dengue patients captured with different smartphones under various lighting conditions. Colorimetry analysis is challenging to implement as various factors may influence the results, such as camera specifications, device-specific algorithms, ambient light and colour casts from nearby objects. Colour correction minimizes the effects of these factors by converting device-specific colours to standard, device-independent colours and mitigates the effects of reflectance and irradiance from the lighting conditions on the photographed object. 21
Our study found that, without colour correction, inter- and intra-phone colour measurements demonstrated ‘poor’ to ‘moderate’ agreement. With colour correction, there was an improvement in the ICC values, showing ‘exceptional’ inter- and intra-phone agreement for the Blue and Green values (ICC > 0.9). The agreement remained ‘poor’ for the Red value despite colour correction.
In our study, we utilized a photography colour calibration card and Adobe Photoshop for colour correction of urine images. Nixon et al. 30 found that colour correction between multiple phones using a physical colour card was more accurate compared to colour mapping based on raw image metadata. However, their study was not tested on biological samples. Otero et al. 31 also reported that the variabilities of conjunctival images caused by light intensity, phone specifications and optical zoom levels can be attenuated with colour correction with a calibration card.
Similar to our study, Hong et al. 32 also performed a colorimetry analysis of urine samples using a smartphone under sunlight and fluorescent light. In their study, colorimetry was performed on images of urine strips compared to our study where colorimetry was performed directly on urine images. They utilized preloaded calibration curves as opposed to our method, where images of urine and calibration card were taken concurrently. Hong et al. 32 reported that there was good agreement in the colorimetry values under different lighting conditions. However, they did not compare the colorimetry agreement of different smartphone models.
In our study, the Blue and Green values of the RGB urine colours showed significant inter- and intra-phone agreement, while the Red values showed poor agreement despite colour correction. Several factors may account for these findings. Firstly, most cameras filter out light beyond 650 nm. 33 Since the red colour has the highest wavelength at 620–700 nm, 34 this could explain why the Red value is the least reliable and showed poor agreement between the phones. In a study conducted by Jakovels et al., 35 they designed an RGB imaging system for skin lesion colorimetry. They found that the best contrast between the lesion and surrounding tissues was in the green (500–600 nm) spectral range, while in the red spectral channel, absorption and contrast were significantly reduced.
Secondly, the absorption spectra of urine peak at around 450–500 nm. Within this range, the spectral sensitivity of smartphone camera sensors is highest for Blue, moderate for Green and least for Red.34,36,37 Thirdly, Chin et al. 38 assigned RGB values to the urine colour chart constructed by Armstrong et al. 7 Based on this, the RGB values of normal urine were 255, 243 and 170. In mild (RGB 255, 228, 100) to moderate (RGB 255, 226, 77) dehydration, the Red values were consistently at the maximum value of 255. Although Green was not at the maximum 255, the value approached the maximum in a well-hydrated person. Blue was the only value that significantly changed with different degrees of dehydration. 38 In our study subjects, the degree of dehydration was mostly mild to moderate.
Therefore, we hypothesize that the ‘poor’ agreement for Red values is due to (a) decreased phone camera sensitivity in discerning Red values beyond 650 nm, (b) low absorbance spectra of urine for red wavelengths, and (c) the consistently maximum Red value in our mild to moderately dehydrated population. Nonetheless, this does not affect the overall reliability of urine colorimetry as the spectral absorbance of urine coincides with the peak sensitivity of smartphones for Blue, which had the highest ICC values in our study. The difference in the Red values could be more evident if the samples included severely dehydrated patients as reported by Chin et al. 38
Without colour correction, the various smartphones produced the highest agreement for Blue and Green values under the ‘daylight’ lighting condition. This is expected since daylight (6500 K) has a continuous spectral power distribution covering the full visible range (450–750 nm) thus enabling discrimination of colour and fine details.39,40 On the other hand, the spectral power distribution of warm light (3200 K) is shifted towards infrared (900 nm), beyond the spectral sensitivity of smartphone cameras which peaks at 650 nm.33,41 As expected, colour casts reduced the inter-phone colorimetry agreements. However, colour correction improved the ICC between phones from ‘poor’ or ‘moderate’ to ‘exceptional’ for Blue and Green values in all lighting conditions.
Out of the five phones compared in this study, Phone 4 produced the lowest agreement. Phone 4 specifications were comparable to the other phones in terms of lens aperture and camera sensor specifications. However, it had the smallest sensor pixel size of 1.0 μm, which may have affected the image capture performance since larger pixels capture more light compared to smaller ones. 42 Although Phone 4 had a larger sensor size compared to Phone 2, Phone 2 had larger sensor pixels and thus better agreement with the other smartphones. Nonetheless, this discrepancy in Phone 4 improved after colour correction from ‘moderate’ to ‘good’ for the Green values and ‘poor’ to ‘exceptional’ for the Blue values.
The findings of this study can be the basis for developing a smartphone application using urine colorimetry to assess the degree of dehydration at home. This could guide the clinical decision regarding the patient's hydration status thus potentially reducing the burden at healthcare facilities while identifying the dehydrated patients early. Recently, the use of machine learning and artificial intelligence has been shown to improve diagnostic accuracies in healthcare. Tong et al. 43 reported improved accuracy in colorimetry analysis using three different phones, and Min et al. 44 addressed lighting conditions with the use of artificial intelligence–assisted smartphone-based imaging systems. Future potential development of smartphone-based imaging system with the combination of colorimetry and machine learning algorithms may improve accuracy and decision-making. Furthermore, machine learning classification techniques such as KNN and SIMCA can be utilized to categorize the degree of dehydration from RGB values obtained from smartphone colorimetry.
Limitations
This study has several limitations. Firstly, the colour calibration and colour sampling were performed using Adobe Photoshop 2021 for MacOS, with proprietary algorithms embedded within the software which are not publicly known and thus can only be replicated if using the same program. However, this study is an example of using commercially available tools in order to achieve colour correction across different smartphones under different lighting conditions. This paves the way for future studies to implement other colour correction methods in performing urine colorimetry. Secondly, the investigators involved in capturing the urine photos were not blinded to the phone models, since they would need to access the phone screens to capture photos. It was also not possible to blind them to the light emitting from the LED light source. Thirdly, we did not perform repeated measures of data capture and colour correction processing. However, we ensured that each data capture and colour correction procedure adhered to the study protocol. Fourthly, we did not randomize the sequence of phones and lighting conditions during urine photo capture. We also did not measure or control the temperature inside the photo box. The temperature of the urine sample may be affected by the LED light source and ambient temperature. Since temperature affects the spectral power distribution, 40 this could affect the image captured by the different smartphones, hence influencing the RGB values obtained. However, these effects may be negligible since LED lights are energy-saving and minimally affects the ambient temperature. Furthermore, the image acquisition was completed within 5 minutes for all smartphones.
Conclusions
Our study found that our method of colour calibration using photo colour cards improved the reliability of smartphone urine colorimetry. This is a promising method for developing a non-invasive, point-of-care hydration assessment tool using the ubiquitous smartphone.
Footnotes
Acknowledgements
The management and medical staff of the Emergency Department of the study center.
Contributorship
MNA, AB and KP researched literature and conceived the study and protocol development. MNA was involved in gaining ethical approval. FSN and SSS were involved in patient recruitment. MNA, AB, KP, FSN and SSS contributed to data analysis. FSN and SSS wrote the first draft of the manuscript. All authors reviewed and edited the manuscript and approved the final version of the manuscript.
Declaration of Conflicting Interests
The authors declared no potential conflicts of interest with respect to the research, authorship, and/or publication of this article.
Ethical approval
The Medical Research Ethics Committee of the UMMC approved the study protocol (MREC ID NO: 202133-9919).
Funding
The authors received no financial support for the research, authorship, and/or publication of this article.
Guarantor
KP